Open source dashboard and graph editor for
Graphite and InfluxDB
Torkel Ödegaard
@torkelo
What is Grafana?
play.grafana.org
Who am I?
Torkel Ödegaard
@torkelo
github.com/torkelo
Stockholm
Sweden
Coding Instinct
"we are survival machines - robot vehicles blindly programmed to preserve the selfish molecules known as genes"
Graphite

Input
prod.apps.server-1.counter.login.count 10 1398969187
prod.apps.*.counter.login.count

Functions!
sumSeries(apps.mysite.*.counter.login.count)
aliasByNode(apps.mysite.*.counter.login.count, 2)
groupByNode(apps.mysite.*.counter.*.count, 4, 'sum')
groupByNode(summarize(apps.mysite.*.counter.*.count, '1h'), 4, 'sum')
Graphite can be hard

???
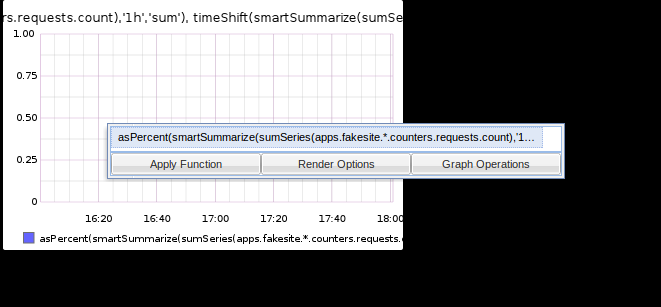
asPercent(
smartSummarize(
sumSeries(apps.fakesite.*.counters.requests.count),
'1h','sum'),
timeShift(
smartSummarize(
sumSeries(apps.fakesite.*.counters.requests.count),
'1h','sum'),
'1h')
)
Alternative Graphite Dashboards
- Descartes
- Giraffe
- Graphitus
- Graph Explorer
- Tasseo
- GDash
- Graphitti
Kibana

Kibana
- Awesome dashboard creation
- Drag and drop panels
- Control row height and panel span in the UI!
- Save / Load dashboard to Elasticsearch / json file
- Graph panel with drag select to zoom
A dark december night

What to do now?
- Create a pull request for Kibana?
- Create yet another Graphite dashboard?
Performance
First thing
Fullscreen graph editor
demo
Graphite query editor
aliasByNode
(
apps.mysite.*.counter.login.count, 2)
groupByNode
(
apps.mysite.*.counter.*.count, 4, 'sum')
groupByNode
(summarize(
apps.mysite.*.counter.*.count, '1h'), 4, 'sum')
Functions! ??
- Code editor
- Code completion
- Suggestions
- Syntax help
Functions! ??
aliasByNode(scaleToSeconds(apps.mysite.*.counter.login.count, 1), 2)
apps.mysite.*.counter.login.count → scaleToSeconds(1) → aliasByNode(2)
Graphite query parser!
Christmas holiday coding spree
- Clean UI
- Graphite expression parser
- Metric segment dropdowns
- Function editor
- Templated queries
Release it!
- First release January 19th
4 months later
- 13 releases
- 261 closed github issues
- 131 open issues
- 70 pull requests
- > 2000 github stars
Monitoring community

Demo
Future
- Full time / part time development
- Alternative dashboard storage
- Metrics key space search
- Quick Ad hoc graphs
- reusable graph templates
- Metric 2.0
- public dashboard templates
- Other panels & time series visualizations
- Optional backend
- Integration with alerting
- Widget
- Inject Grafana Graph panel in other websites
- Reuse graph in multiple dashboards
- Sharable links to graphs
Q & A
Thanks!
@torkelo
@grafana
grafana.org
github.com/grafana/grafana
Grafana
By torkelo
Grafana
- 3,496


