Class Data Analysis
Vertical Group 10:
Disi Koa (Curator)
Tay Shin (Analyst)
Sam Kirschner (Visualizer)
Hong Chan Shon (Intergrater)
Download the data
- https://docs.google.com/a/berkeley.edu/spreadsheet/ccc?key=0Aj1QXjQixf-SdENDS1FzR1FGNE1kLUk0WGR1SW5peVE#gid=0
- File -> Save as -> Download as Comma Separated Value (CSV)
Visualization of the results
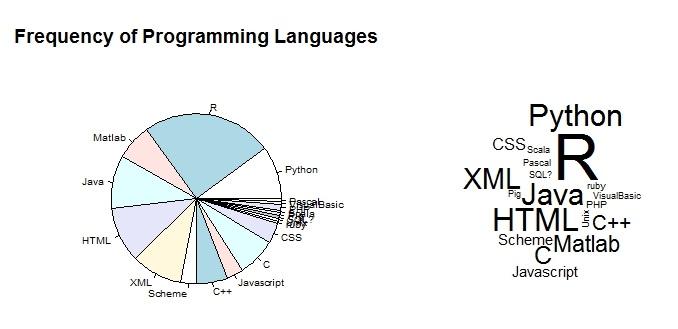
- Pie chart & word cloud, showing the frequency of each programming languages used among us
VISUALIZATION OF THE RESULTS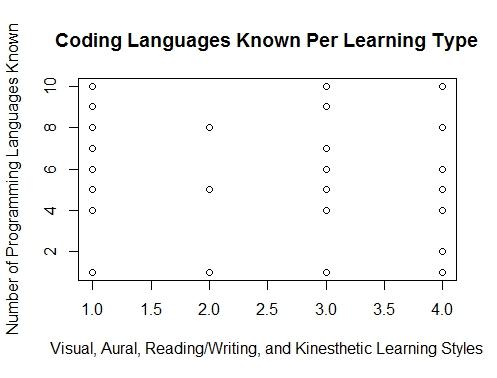
- No particular pattern is visible among learning types, except for reading/writing
VISUALIZATION OF THE RESULTS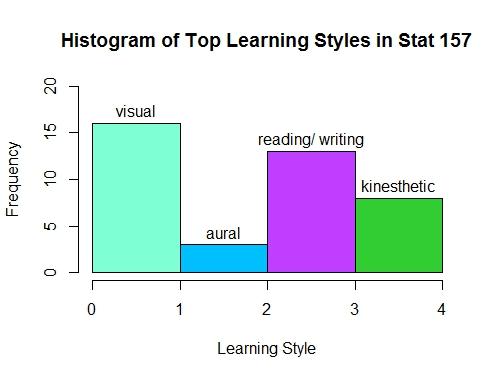
- Which learning style best describes you?
VISUALIZATION OF THE RESULT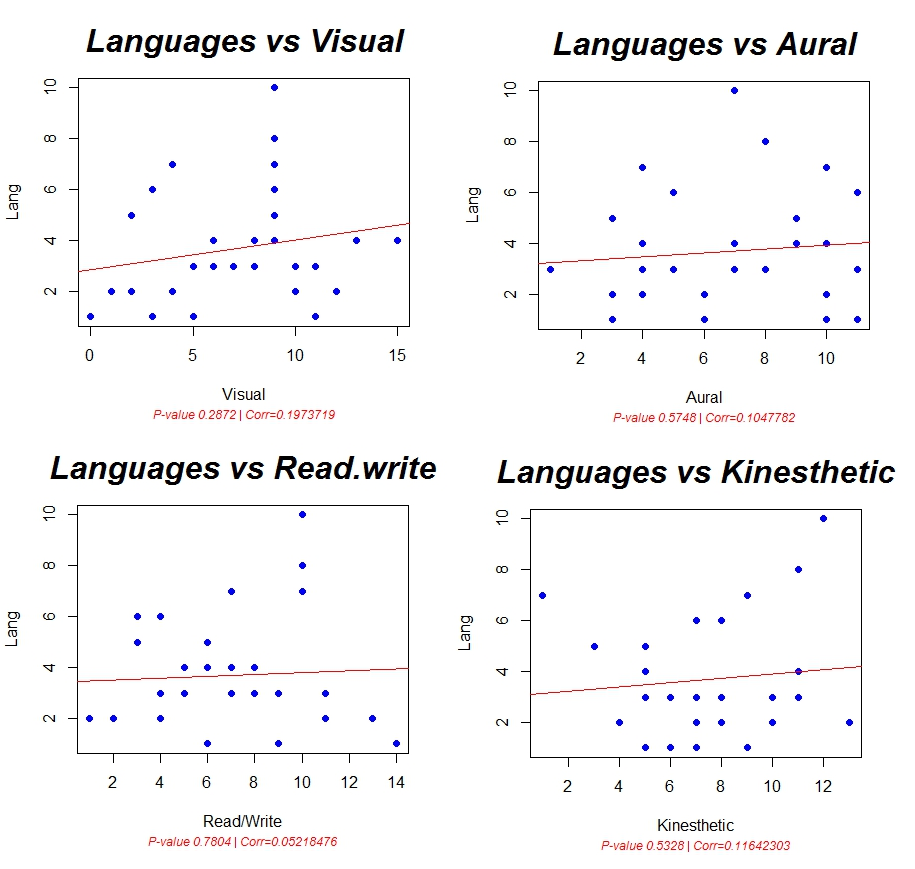
VISUALIZATION OF THE RESULT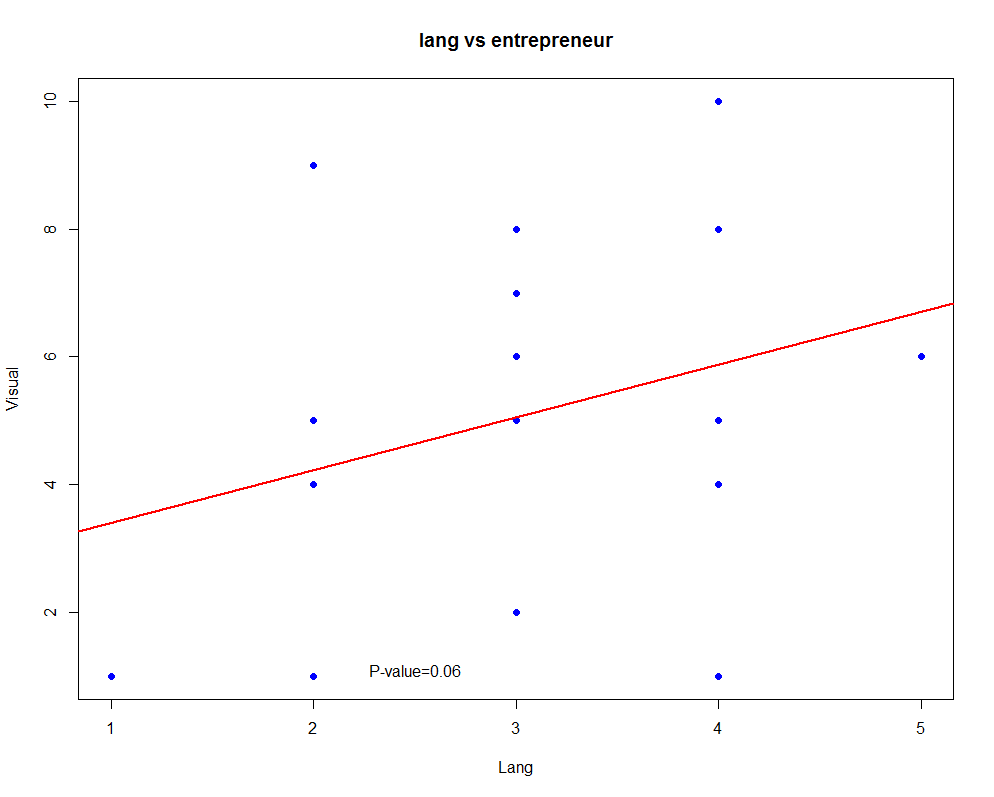
Comments & Wrap up
- R is the most commonly used language, followed by:
- Python, XML, HTML
Stat 157 Project 1 (group 10)
By tzenarr