107-2 Seminar IV
Application of Climate Service
in Building Energy Assessment
- A Case Study on NTU General Library
Wei-Jung Ho
Advisor: Dr. Po-Hsiung Lin & Kuo-Tsang Huang
[Outline]
[Introduction]
- Background
- Knowledge gap
- Research goal, niche & value
[Method]
- Study design
- Study site & data
[Results]
- Descriptive statistics
- Key findings
[Discussion]
- Recommandations
[Future works]
[Background]
- Climate change/ Global warming → COP21 → INDC
- Mitigation/ Reduce emission → Energy transition @TW
- Construction and energy sectors plays an important role in our daily lives. Taiwan's construction CO2 account for about 40% of total (Ministry of Economics, 2000)
- In building’s life cycle, the operational energy usage account for 70~80% in daily use.
- Among all the building mass, schools are usually the key part account of business and housing sector that distributed in different administrative and regional levels in Taiwan.

2012-17 Taiwan's Educational Institute average electricity consumption ratio
Others
56%
Taipei 8%
Tertiary institutions
44%
NTU 2%
Other
Tertiary institutions
in Taipei
6%
[Introduction]
6. Review in policy practice of "Governmental agency and school four-saving project" tends to be an ineffective strategy.
[Knowledge gap]
7. Campus energy management dilemma:
- A methodology to assess the different energy-saving options is missing.
[Research goal]
8. To develop a standard decision supporting assessment (DSA) method to tell different strategies' pros and cons on energy-saving plan.
[Research niche & value]
9. NTU campus is the first university that installs digital electric meters system in Taiwan. And it is also the most complete educational unit with the highest coverage rate.
10. DSA model can be replicate and apply on varies building for energy usage assessment.
[Building Energy Assessment]
-
Before construction:
- Green Architecture Certificate System
- USA LEED
- TW EEWH
- UK BREEAM
-
HVAC system
- ASHRAE - BEAP
- Japan regulation guide
- Green Architecture Certificate System
-
After construction:
- German - Passive design renovation
- DSA method in my thesis
[Why is BEA useful?]
- Predict Future Energy Usage
- Identify if something goes wrong
- Optimal control (ex. pre-cooling/ mixed mode cooling strategy...etc)

[key factors in BEA]
-
Building features
- facades, core&shell, W/W ratio, roof-tops, geometry, interior zone assignment, space design deployment, materials
-
Loading features
- HVAC, lighting, power systems, activity density, schedules

[Study design]


[Study site & data]- NTU General Library
- Completion time: 1997
- Building area: 35,325.221 square meters
- Building floor: 5 floors and 1 basement
- Energy data:
- Different scale-levels of electricity metering: BioIME-Grid > GL has its own HTM high voltage cable > equipment function level (power, lighting, HVAC, and ice storage sub-metering)
- Time lapse point
- < 2012 monthly consumption only
- > 2012 the data can be collected every 15 minutes.
[Findings in Data Analysis]
- Descriptive statistics:
- Yearly trend: Decrease from 2009, but bounce a little back at 2014, and goes down at 2016 again
- Basic load: Every February due to Chinese Lunar Year holiday break

- cf. seasons: summer > winter (m, IQR, & Max)
- Sub-meter ratio (in general):
- HVAC = 48%
- Lighting = 39%
- Power = 13%
[Energy Basic info.]

[Key Finding1: Baseline of GL]

Chinese New Year: 6- 14 Feb 2017
Final Exam Week: 13-17 Jan 2017


May
July
Sept.
[KF2: HVAC&ice storage system]


Cf: GL ice storage system E+ Bill
2016-2014
(kWh)
/E+ price contract/
Summer(6/1-9/30)
Non-summer(10/1-5/31)
22:30-7:30 = 1.61 NTD/ kWh
7:30-22:30 = 3.55 NTD/ kWh
[KF3:Principal components analysis]
- Data: energy, T, RH
- Dimension reduction → Feature extraction → to know how the T, RH inf. E+ load & Lay-back effect

E+ Var, PC1: peak load in day time (2015/7)
Evar trend with the magnitude of its standard deviation
[KF3:Principal components analysis]
- x=Tvar(PC1)
- y=Tvar(PC2)
- w=RHvar(PC1)
Integral value

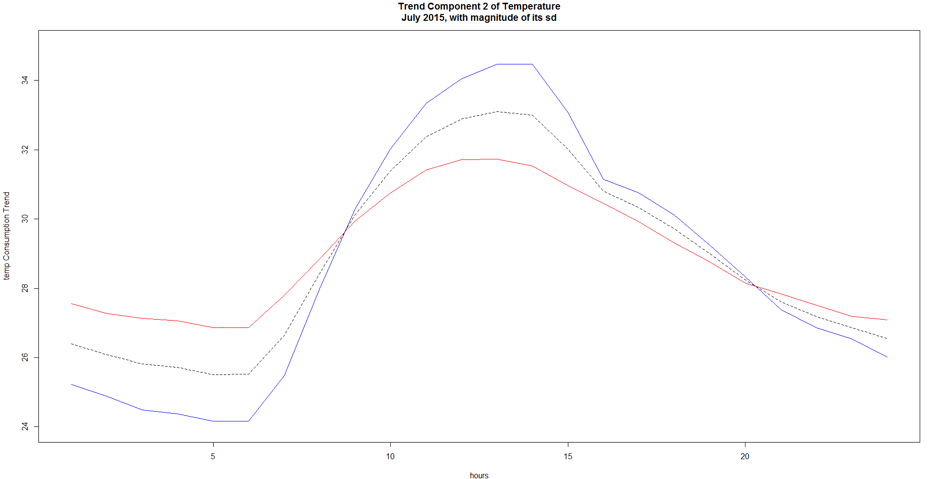


z = 31.12x + 30.70y + 8828.1w -277.43
[KF3:Principal components analysis]

red:850(+)/blue:386(-) (integral score) ; dashed: predicted; real: real value
[HVAC Basic info.]

冷凍循環四要素:蒸發器、冷凝器、壓縮機、膨脹閥
[HVAC Basic info.]

[HVAC units & parameters]
- AHU = 空調箱
- THE = 全熱交換器
- CHP = 冰水泵
- BHP = 滷水泵
- FS = 水流開關
- WDP = 水差壓偵測器
- HEX = 偵測板式熱交換器
- T12 -HEX = 偵測板式熱交換器二次出水溫度
- G1 - OTE = 儲冰槽液位控制器
- Tx -DDC = 直接數位控制器,溫度偵測器
- TSy = 出回水溫度監測器
- COP = coefficient of performance
- BTU = British thermal unit
- EER = Energy Efficiency Ratio
- IPLV = Integrated Part Load Value

[Future works]
Due to I am not able to verify the HVAC data with Architecture model, my research topic have been revised again recently, but the previous research results will be part of my thesis.
In the future, my study discuss how different building forms affected by climate event on campus.

Q&A
[Climate service]
- Climate services provide climate information to help individuals and organizations make climate smart decisions.
- The data and information collected is transformed into customized products such as projections, trends, economic analysis and services for different user communities.
- Climate services equip decision makers in climate-sensitive sectors with better information to help society adapt to climate variability and change.

台大校總區建物耗能排名
資料來源:全校即時電力監控系統,只討論皆有資料的日期,因無考量能源使用密度(Energy Use Intensity, EUI),故排名僅供參考。(2016/8)
研究目的
- 計算:
- 不同手段的成效分析
- 儲冰系統
- 自習室開放時間
- 館內功能區使用配置
- 生機饋線超約罰鍰責任佔比
- 不同手段的成效分析
校園
節電
大背景:氣候變遷下臺灣能源轉型
基本單位:建築節能
- 土木建築
- 機械空調
- 材料照明
社會制度面
- 法制政策
- 歷史脈絡
- 能源管理
電力基礎建設面
- 土木:建築物理
- 電機:智慧電網
- 機械:能源工程
量化分析:資料及特徵值
- 預計使用資料:
- 期間:2014/1/1~2017/12/31
- 內容:527顆電錶資料,歷時四年的時資料
- 天氣資料:大氣系觀測坪(溫度、降水等資料)
- 分析特徵值:
- 年月用電量曲線圖、基礎耗能與尖峰耗能分佈
- 不同月跟季節的日用電曲線差異
- 季節分成兩季:冬(11-4月)、夏(5-10月)
- 不同年度的月份比較
- 日的時變化曲線、細分電錶的空間分佈和類型
- 建物與天氣的關係:溫度、降水、太陽輻射、方位等
分析方法
- k-means clustering
- features = axis
- NS-hashtags
- 相關系統
- 配電系統
- 電費系統
- 空間分配
- 使用類型

資料清理:電錶負值

http://140.112.166.97/power/index.aspx
大樓用電量分佈

用電量(千度)
溫度和用電分布的關係

用電量(千度)


的關係
用電量(千度)


用電量分布圖


R.pkg
- 基本:歷年/月/日用電曲線、季節比較
- 延伸:和不同變因的關係及預測(天氣/氣候)
- 發現的資料洞見(data solution insight)
建物用電分析
儲冰系統
效能分析
-
夏季成功延遲午後尖峰用電
-
冬季加裝之後溫控系統成效不佳
-
全年度整體用電大幅提升
[問卦]
有沒有
系館受太陽輻射影響
溫度大幅上升的八卦
?
2016年8月不同研究教學用大樓用電特性
-
-
https://goo.gl/ezntcf
EUI?
”
-
歷史資料的品質,不足以分析建築耗能
-
總圖增設儲冰槽,降了電費卻用電增加
-
建物的空間權力分配跨院系所
| 代碼 | K1 | K2 | K3 | K5 | I9 |
| 類別 | 辦公類空間 | 圖書館 | 學校教室 與辦公行政 |
工廠實驗 、研究室 |
體育館、運動場館空間 |
| 說明 | 辦公、會議、行政、視聽、研究、實驗相關空間及其附屬大廳與室內公共空間 | 含閱讀區、書庫區及其附屬大廳與室內公共空間 | 普通教室、專科教室、視聽教室、學校辦公行政區 | 研發空間及其附屬大廳與室內公共空間 | 健身房、舞蹈室、室內球場、保齡球道、運動練習室、運動俱樂部、室內游泳池、含附屬空間 |
| 建物 | 行政大樓 | 總圖書館 | 新生教學館、普通教學館、博雅教學館、共同教學館 | 凝態館、 原分所 |
新體育館、 舊體育館 |
| EUI 標準 | 120 | 111 | 135 | 162 | 125 |
建物選定及分類
資料清理:電錶負值
- 單一高壓電錶(整棟):總圖書館、新生教學館、共同教學館、原分所、新體育館
- 用電量合併計算:
- 凝態館(含停車場)
- 博雅教學館(1~4分區分樓層配電錶)
- 普通教學館(高壓空調、照明、新設電錶1&2)
- 舊體育館(水銀燈、健身房、高爾夫、球場、照明、器材室)
- 行政大樓(高、低壓冷氣、主計室空調照明、資訊室照明、資訊室動力、主計室綜合業務組、行政大樓前棟2樓動力、行政大樓後棟1&2樓西照明、行政大樓後棟1&2樓東照明、行政大樓前棟1樓東照明、行政大樓前棟2樓東照明、
行政大樓後棟3樓東側、行政大樓前棟2樓動力)
資料清理:缺失值
- 行政大樓空調分高低壓,高壓缺失值
- 原分所的缺失值:2014/1/1~2014/3/22
-
其他缺失值:
- 斷路(Open circuit)
- 回傳Wifi過程中有其他因素影響
- 例如:跳電之後的訊號缺失或是維修施工暫時關閉之類。

十棟建築物的用電量

十棟建築物的EUI

EUI 類別:I9
新體育館、舊體育館
EUI 類別:K1
行政大樓

EUI 類別:K2
總圖書館

EUI 類別:K3
共同、博雅、普通、新生教學館

EUI 類別:K5
原分所、凝態館


氣溫與用電量分析
為何不使用EUI??
超過EUI平均的四棟建築物:
1.總圖書館
2.新體育館
3.凝態館
4.原分所
第一直覺總會認為
「這四棟建築物一定會亂用電?!」
但,或許我們錯怪了他們?
那麼,有什麼因素會影響用電量嗎?
用電量與季節ANOVA分析

用電量與EUI類別ANOVA分析

20190610_Seminar IV final
By Victor Ho


