#WebPerformances
The perfect toolbox to debug performances

Nov. 18th 2015 – viscaweb.com/meetings
Some statistics...
2 seconds or less is the time half of the web users expect a site to load.
3G and 4G connections are, days after days, more and more used by users.
20% of traffic and revenue are lost every 500ms of overload.
Impacts on the SEO, Google said the time a website takes to load can impact their position in the search engine.

#WebPerformances
Tools
Tools
Tools
Tools
Tools
Tools
Tools
Tools
Tools
Tools
Tools
Tools
Tools
Tools
Tools
Tools
Tools
Tools
Tools
Tools
Tools
Tools
Tools
Tools
Tools
MY CODE DOESN'T WORK, I HAVE NO IDEA WHY...
MY CODE WORKS, I HAVE NO IDEA WHY...


and many others...
#WebPerformances
The perfect toolbox to debug performances
First part:
The bottlenecks...
where are they coming from ?
#WebPerformances
Bottle necks


Databases is where most of the web applications
bottlenecks are coming from.
PHP and CPU have their own limits.
You shall reduce as much as you
can the treatments your CPU has to run.
Assets (images, CSS, JS) are performances
killers especially if your applications requires them to work
and/or if must of your users are using a fragile connection (Edge, 3G...).
#WebPerformances
Cache Stragegy
Do NOT do like him,
THINK of a SMART and EFFICIENT strategy
that just works.
MOST of the time, the problem is not PHP, the database or whatever, the problem... is YOU

#WebPerformances
Cache Stragegy
But what's a good cache strategy ?
In my humble and personal opinion...
When creating a cache strategy,
here are some questions you must ask yourself at MINIMUM:
-
What's the real purpose of this cache?
It will help you for the next questions... -
Who is going to use it?
It will help you to design the code behind it... -
How/When will it be triggered?
Your cache must not give data, it must give GOOD and UP TO DATE data. -
What if the cache is not available? (my favorite)
Will it be important? Will it break your entire website?
Remember the Murphy's Law: If anything can go wrong, it will.
#WebPerformances
#WebPerformances
The perfect toolbox to debug performances
Second part:
The tools:
-
Symfony Toolbar
-
BlackFire
-
Xdebug + MySQL logs
-
StopWatch Component
#WebPerformances
The context
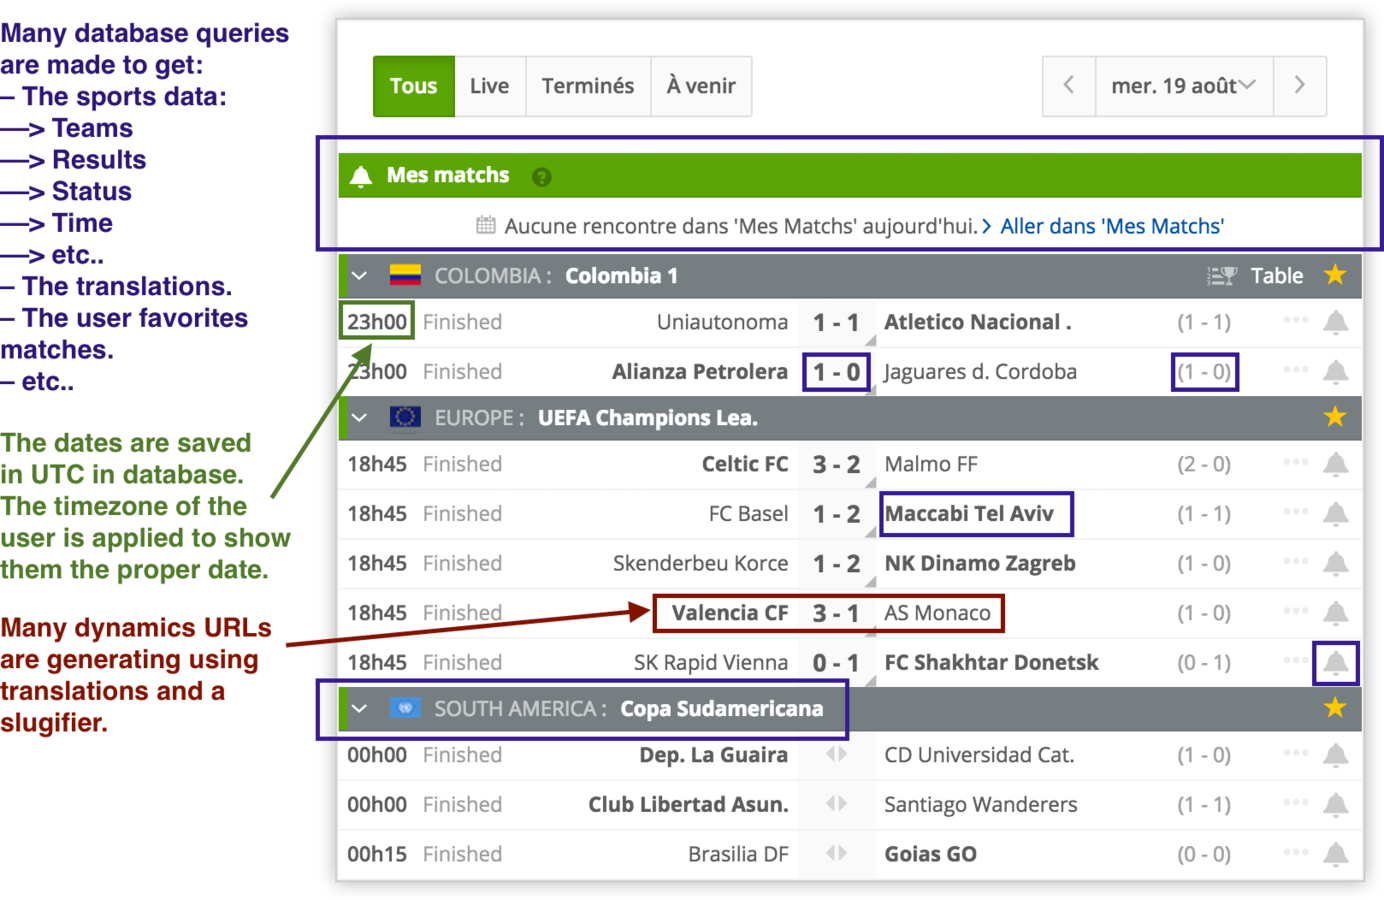
The next slides are based on a small applications displaying soccer matches for a given date.
This list of matches looks simple but many data are displayed.
#WebPerformances
The context
#WebPerformances
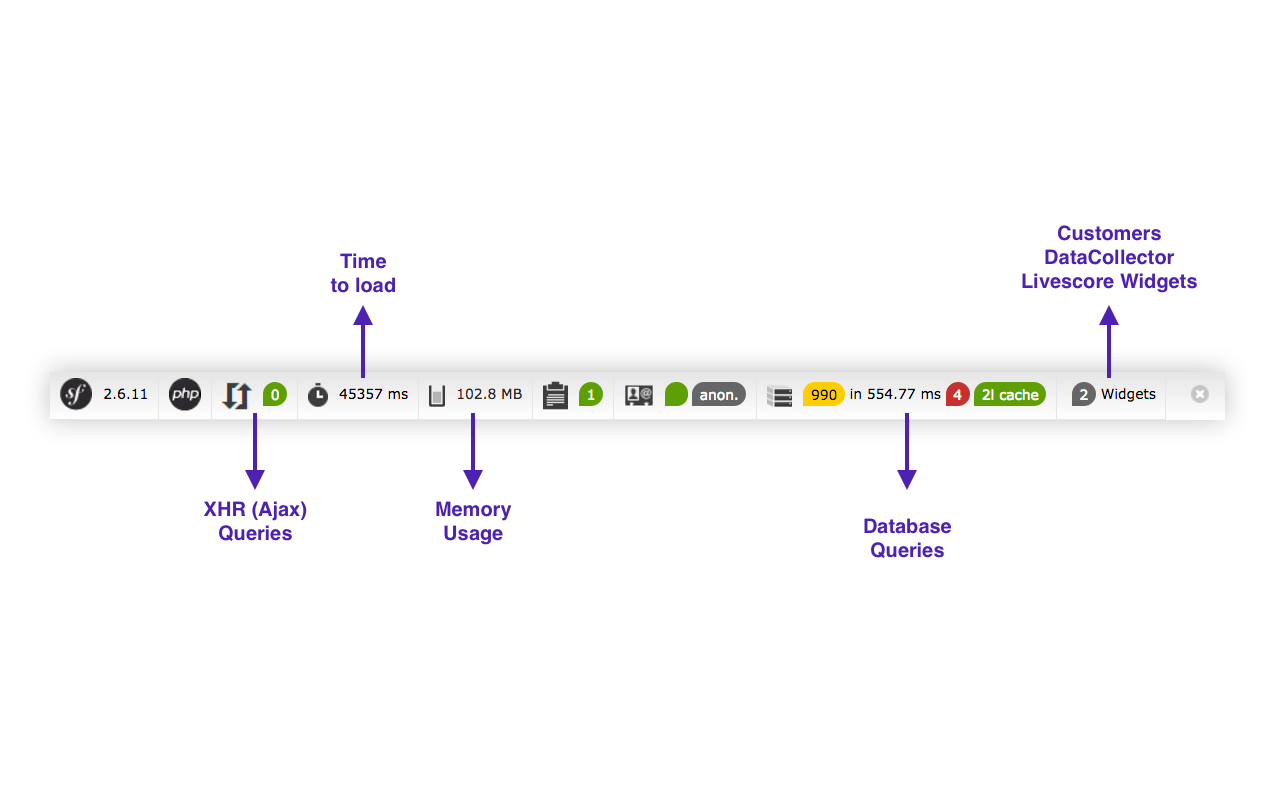
Symfony Toolbar
#WebPerformances
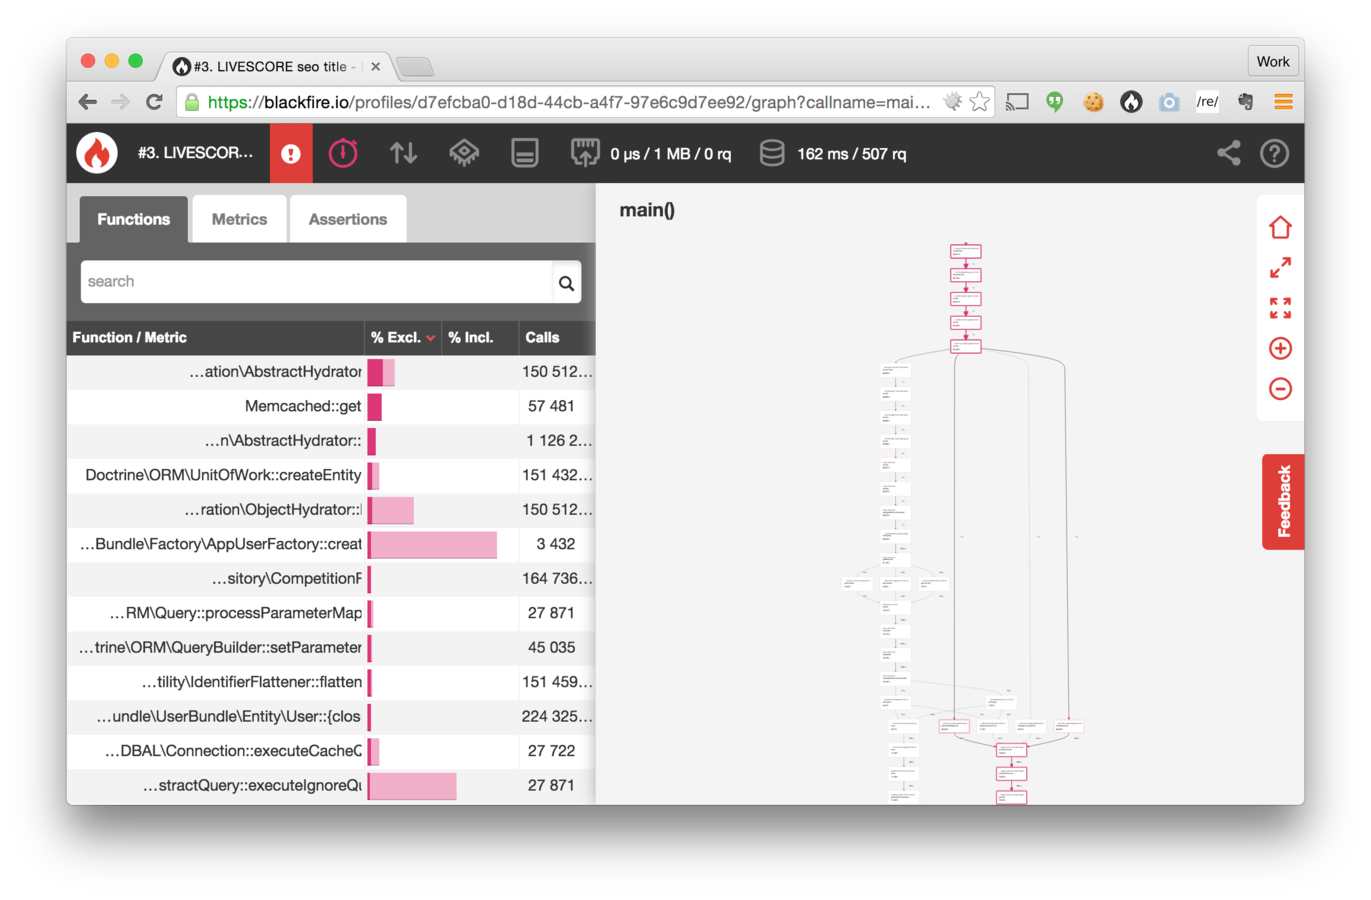
BlackFire
Blackfire Profiler automatically instruments your code to gather data about consumed server resources like memory, CPU time, and I/O
#WebPerformances
BlackFire
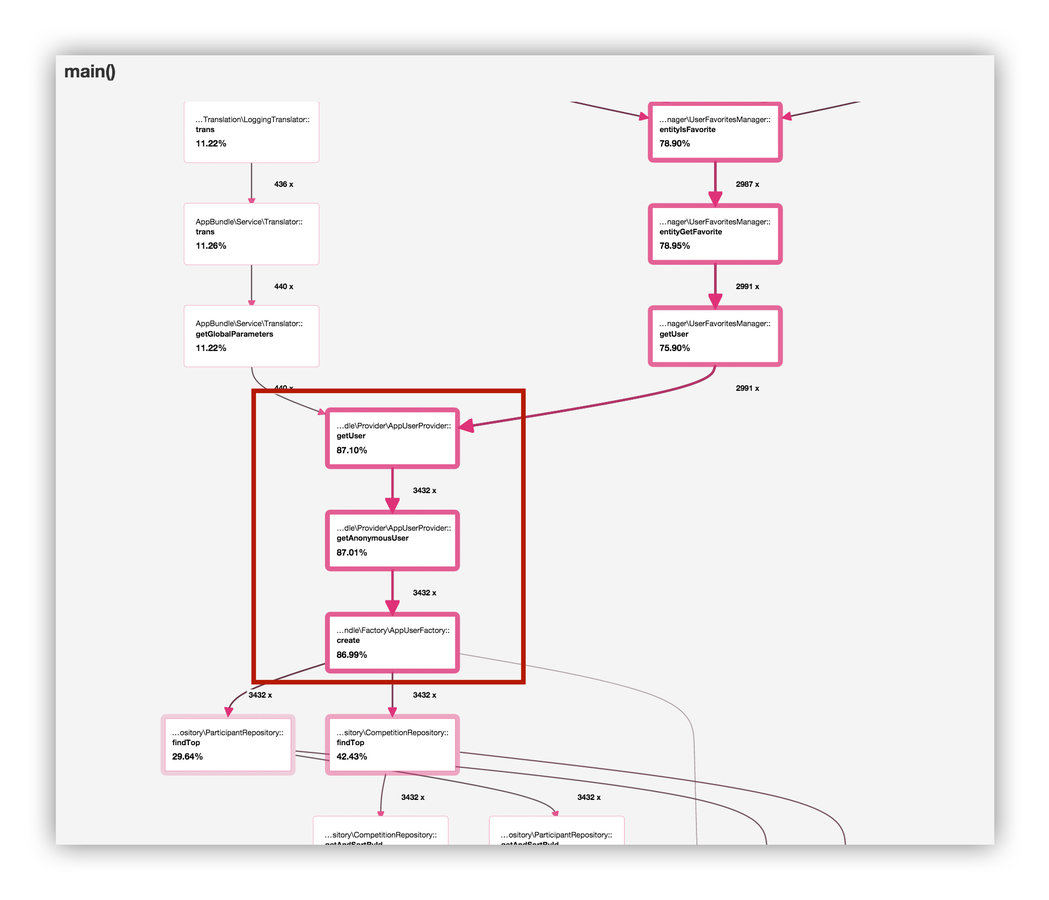
Let's analyse a profile...
#WebPerformances
BlackFire
The toolbar
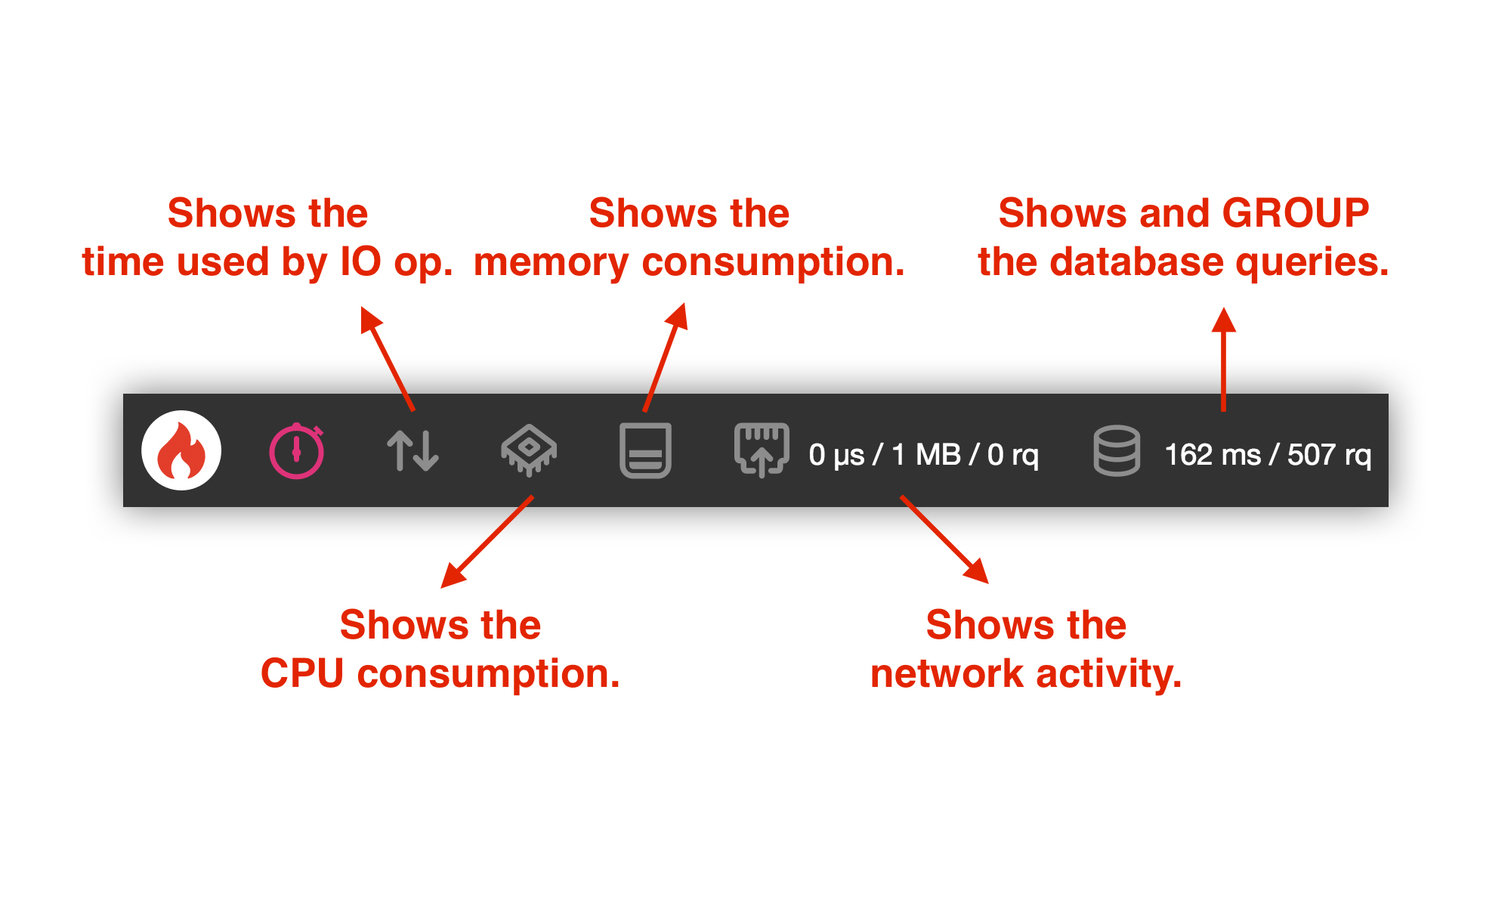
#WebPerformances
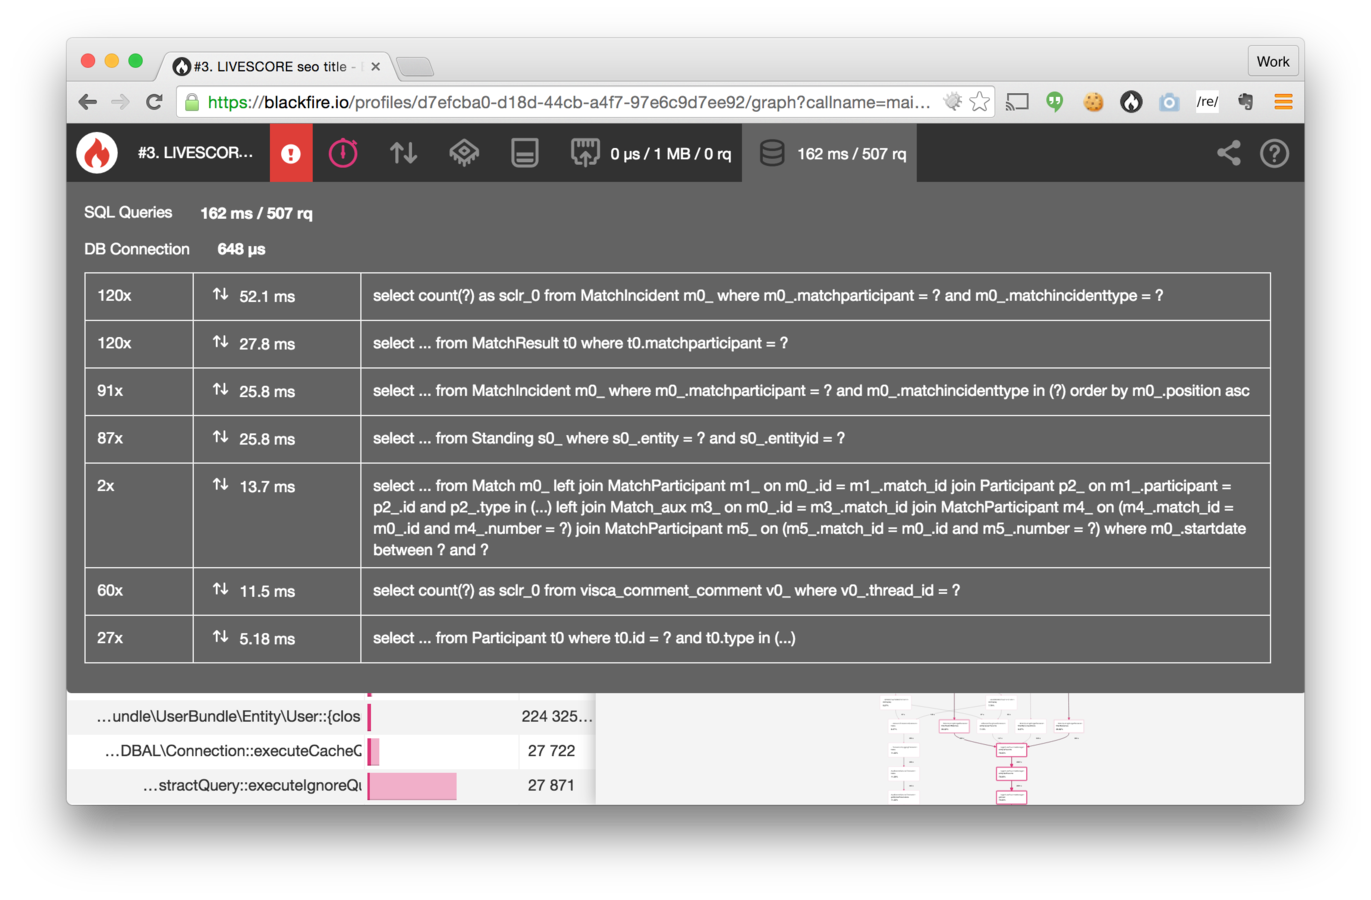
BlackFire
The toolbar groups as well the SQL queries.
#WebPerformances
BlackFire

#WebPerformances
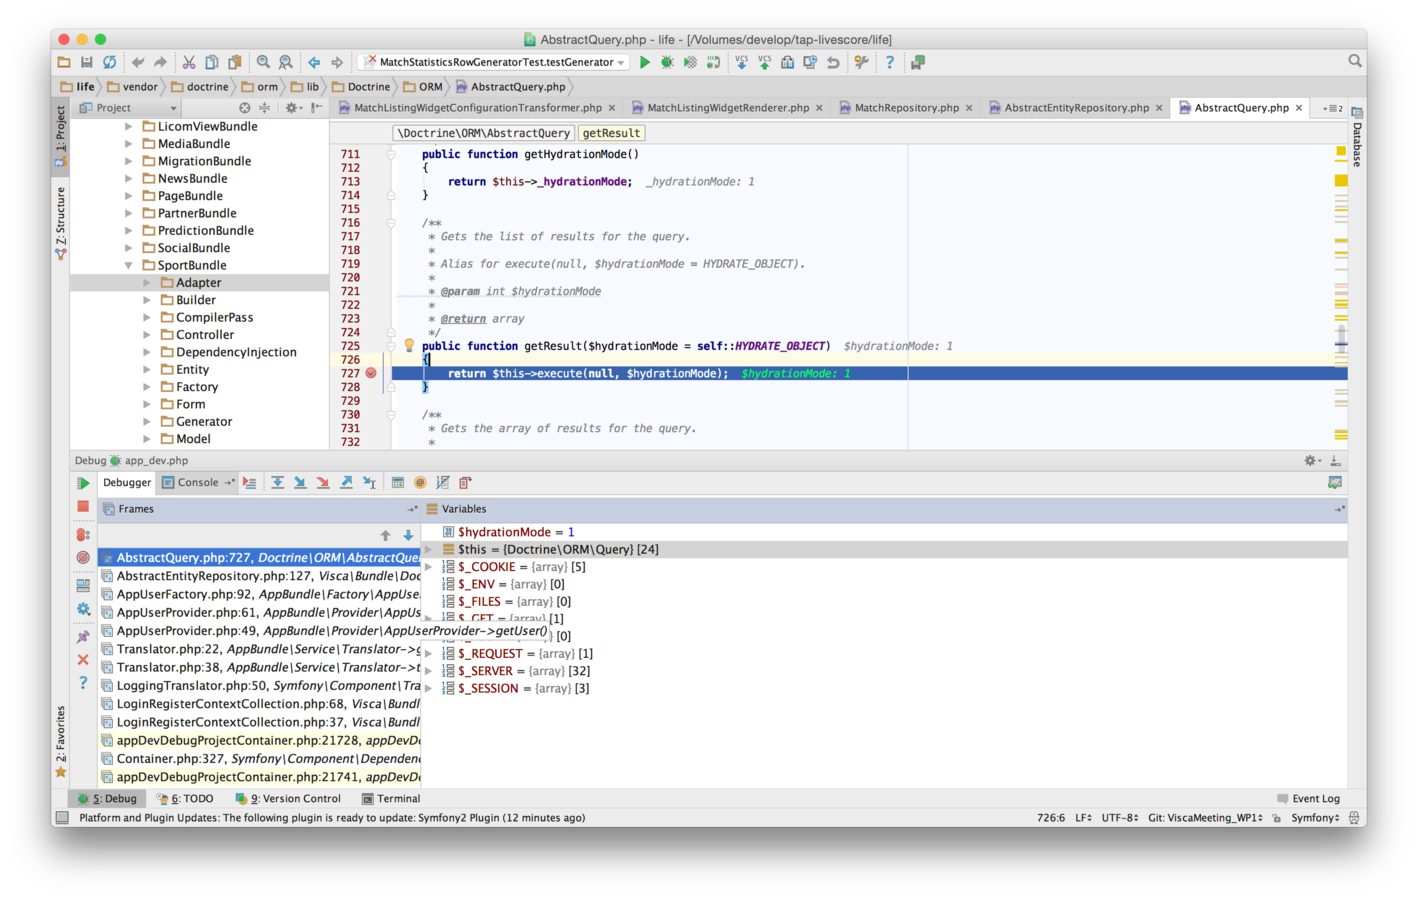
Xdebug + MySQL
#WebPerformances
Holywood Principle

#WebPerformances
Eager / Lazy loading


Eager
loading
Lazy
loading
#WebPerformances
Lazy. vs Eager Loading
<p>
    Team Home:
    {{ match.homeTeam.name }}
    <br/>

    Result:
    {{ match.homeResult.resultText }} -
    {{ match.awayResult.resultText }}
    <br/>

    Team Away:
    {{ match.awayTeam.name }}
</p>
/**
* @return Match[]
*/
public function findMatchesWithCommonData()
{
$matches = $this
->createQueryBuilder('match')
->select('match, ht, at, hr, ar')
->join('match.homeTeam', 'ht')
->join('match.awayTeam', 'at')
->join('match.homeResult', 'hr')
->join('match.awayResult', 'ar')
->getQuery()
->getResult();
return $matches;
}The getters used in Twig (this is just an example) will trigger SQL queries.
This is has a HUGE cost: 4 queries are triggered in this example.
Using joints, we tell Doctrine to load in a single query many information we will always need.
Doctrine will recompose the data and create the proper models/relationships.
#WebPerformances
Stop/Watch
One of the smallest Symfony's component.
Allows you to put some time markers in your code.

<?php
use Symfony\Component\Stopwatch\Stopwatch;

$stopwatch = new Stopwatch();

$stopwatch->start('Loading the matches');
// Running SQL queries, hydrations, etc.. [...]

$stopwatch->lap('Loading the matches');
// Calculating some statistics about matches

$event = $stopwatch->stop('Loading the matches');
// The process has finished.

// Display
print "Events:" . PHP_EOL;
foreach($event->getPeriods() as $index => $period){
        print sprintf(
                "-> Period: %d, duration: %s, memory usage: %s bytes" . PHP_EOL,
                $index,
                $period->getDuration(),
                $period->getMemory()
        );
}
#WebPerformances
Events:
-> Period: 0, duration: 1001, memory usage: 524288 bytes
-> Period: 1, duration: 0, memory usage: 524288 bytes
Stop/Watch
Now, let's couple this component
with your Symfony Application.
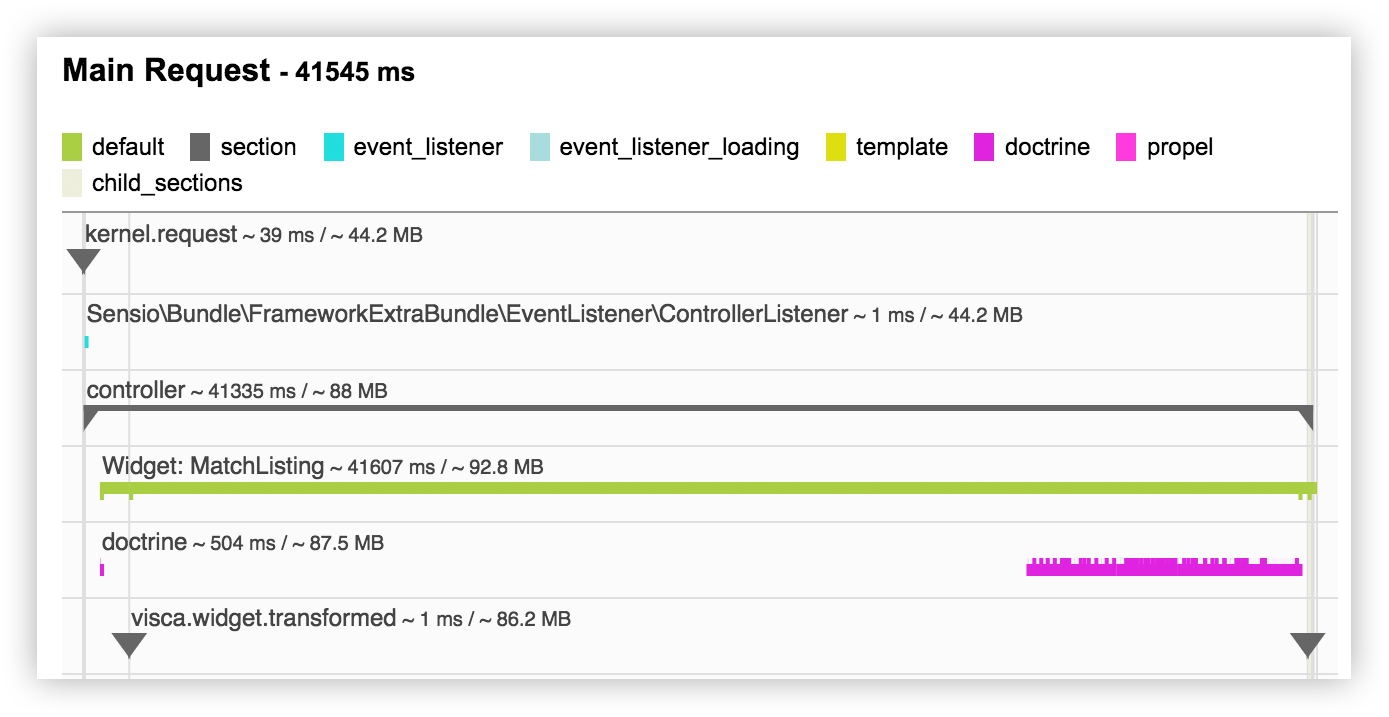
Benefit: the time markers will be
displayed in the Symfony Timeline.

#WebPerformances
Stop/Watch
Declare a new dependency:
Firstly, declare your service:
services:
    my_service:
        class: My\Service
        arguments:
          - @?debug.stopwatch
In production, this service is not available. Therefore, the "?" make this service optional.
class MatchListingWidgetRenderer implements Renderer
{
    /**
     * @param StopWatch $stopWatch StopWatch Component
     */
    public function __construct(Stopwatch $stopWatch = null) {
        $this->stopWatch = $stopWatch;
    }

    /**
     * @return Response
     */
    public function render()
    {
        if ($this->stopWatch) {
            $this->stopWatch->start('Widget: MatchListing');
        }

        $html = '[...]';
        $render = new Response($html);

        if ($this->stopWatch) {
            $this->stopWatch->stop('Widget: MatchListing');
        }

        return $response;
    }
Use the StopWatch component:
#WebPerformances
Stop/Watch
#WebPerformances
#WebPerformances
The perfect toolbox to debug performances
Third part:
Thoughts
Not presented
Links
#WebPerformances
optimisations
-
Sharding, indexes, columns types optimisations, etc.. yes, but not as the main solution.
- Your applications must be WELL designed, with proper cache strategies, and optimisations over the system will come in a second time.

#WebPerformances
Think, think, think!
Writing code is easy, thinking code is hard.
Imagining your code, part by part, and by splitting the responsibilities will help you to organise your code.
Thus, don't be stupid by just writing code, but think about it before, takes notes on what's the part that can be tricky, and then, develop.

#WebPerformances
Memory Leaks
In PHP we usually don't have to care about how to memory is handled. However...
– A bad code can easily create many memory leaks.
– It can end up in 500 errors on production (when using real data and huge databases).

#WebPerformances
Doctrine Cache
The Doctrine cache is super important:
- It can speed up your application a LOT or completely DESTROY it.
- There are many kind of cache (query cache, result cache, metadata cache).
- 80% of time to understand and plan how you will implement it.
- 20% to implement it.
#WebPerformances
More with
BlackFire has some advanced functionalities.
Assertions:
Allow you to write some tests asserting that a code:
- Takes less than X seconds to run.
- Makes less than X SQL queries to run.
- The final size of the response is smaller than X kb.
- etc...
#WebPerformances
function printHello(){ echo "Hello World!"; }

// get the probe main instance
$probe = BlackfireProbe::getMainInstance();

// won't show up in the profile
printHello();

// start the profiling
$probe->enable();

printHello();

// stop the profiling
$probe->close();

// won't show up in the profile
printHello();
Manual Code Instrumentation
By default, BlackFire runs on the whole query.
What if you want to analyse only a specific part of the process?
#WebPerformances
More with
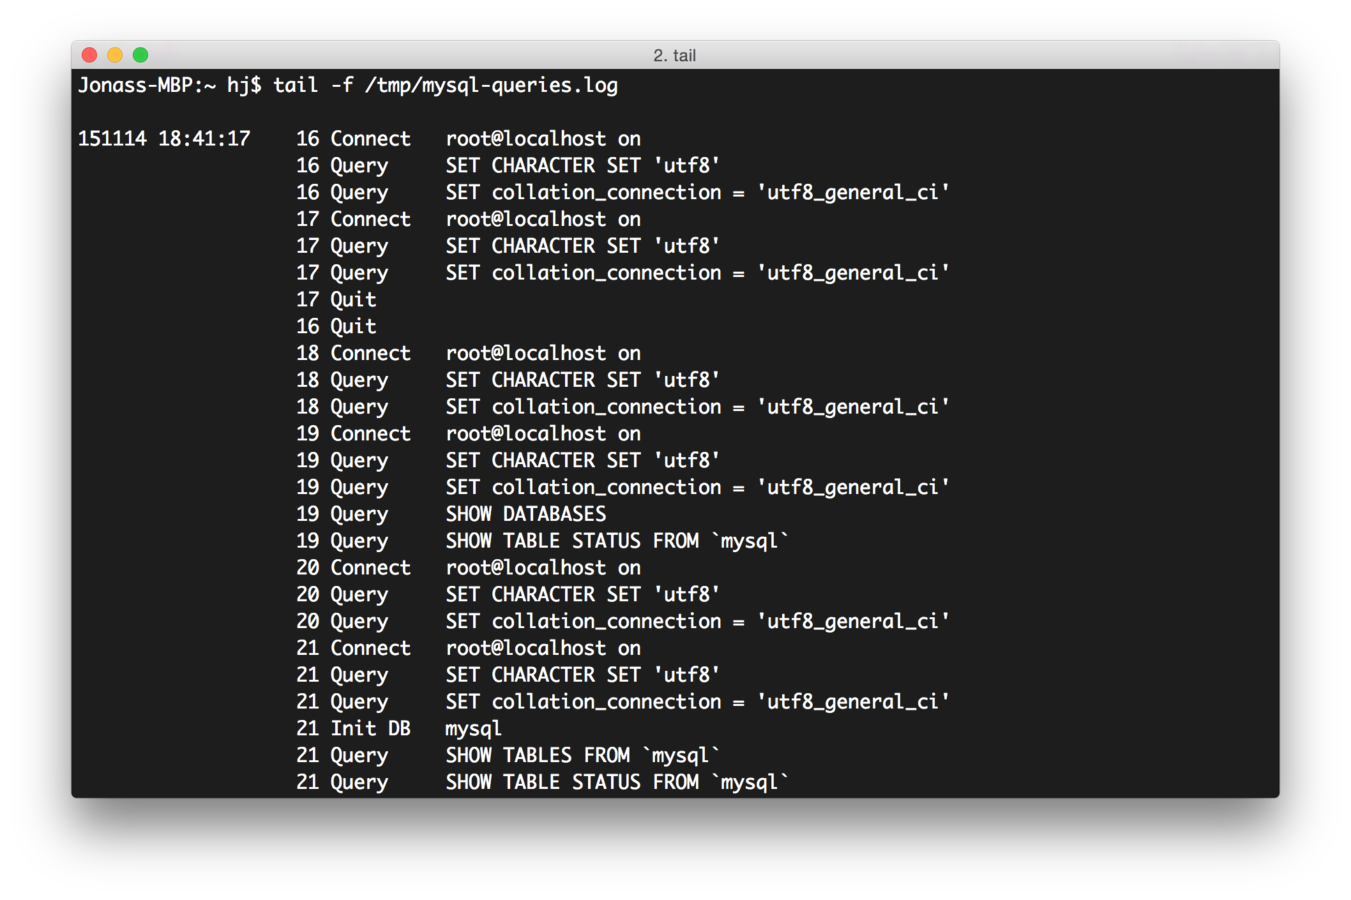
Survey your logs
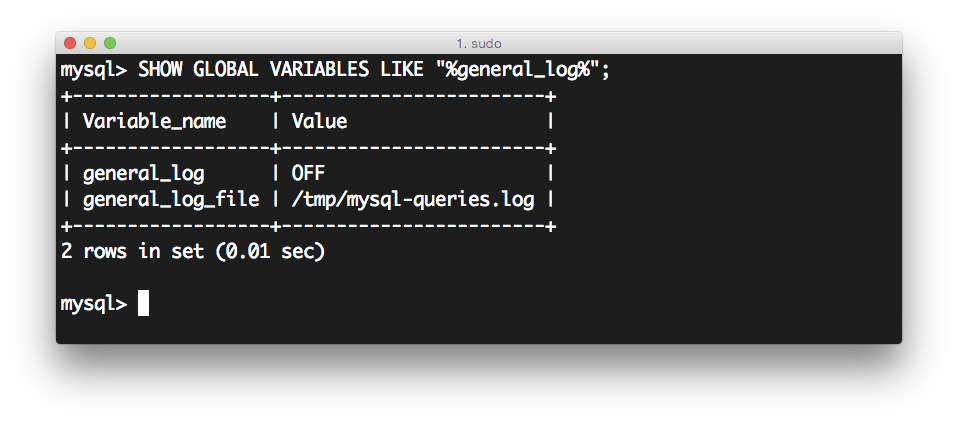
- Logging everything production might not be the best solution. But logging the slow queries might be interesting.
That's where MySQL enter in the game: you can easily and automatically log any query that takes more than X seconds to run.
- Do not hesitate to write your own logs on critical parts and review them, once a week or a month and improve the logic of the application.
#WebPerformances


forthcoming
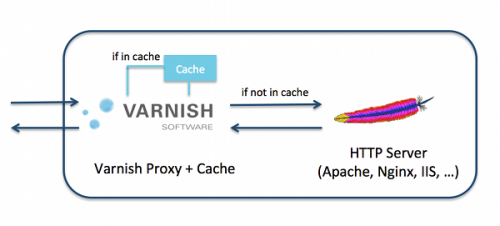
Varnish
"New Relic provides clear visibility into what's happening all day every day.
It makes prioritizing our work and measuring the impact
of our actions visible for the whole team."
forthcoming

#WebPerformances
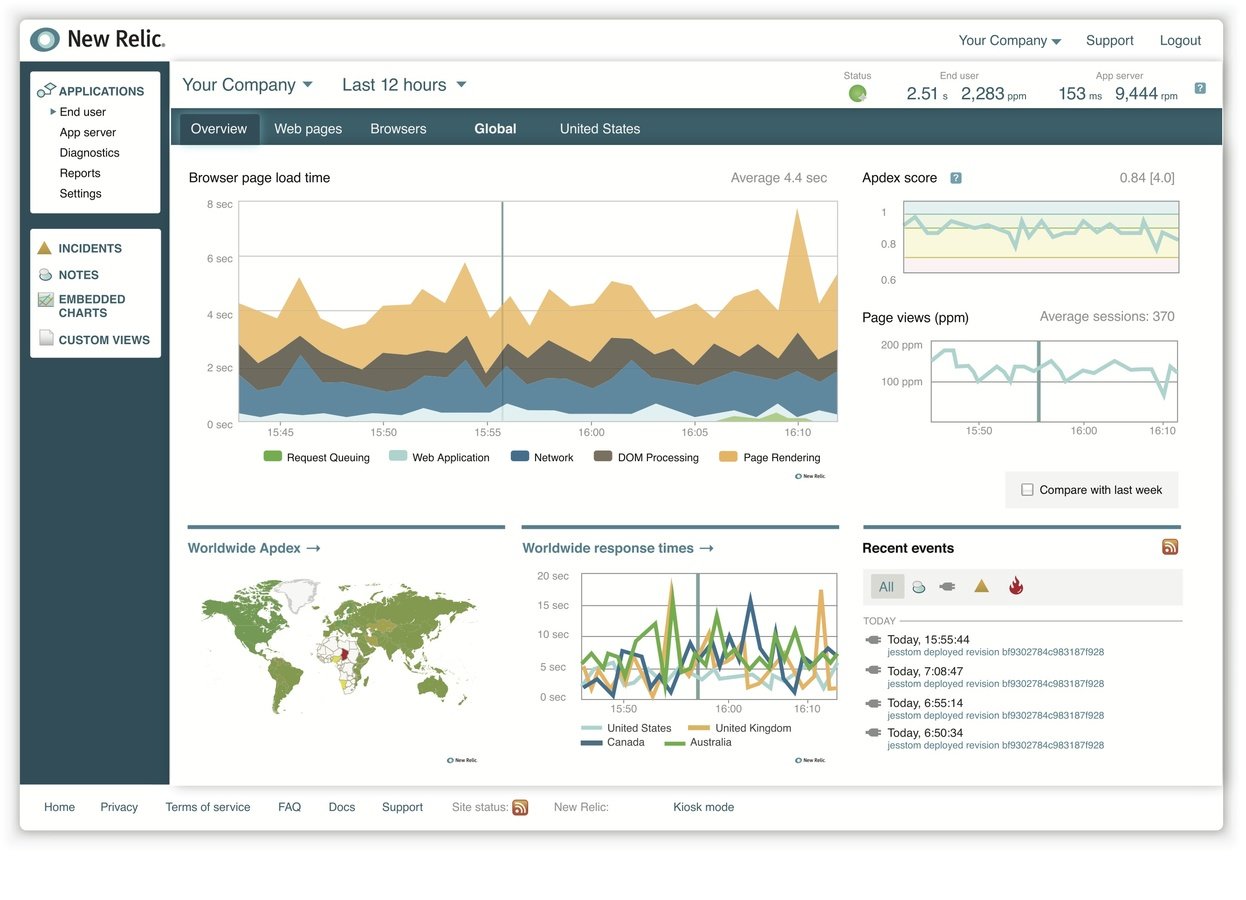
NewRelic
"New Relic provides clear visibility into what's happening all day every day.
It makes prioritizing our work and measuring the impact of our actions visible for the whole team."
forthcoming
#WebPerformances
HTTP 2
HTTP2 is coming with many new features, such as:
- One TCP connection
- Streams are multiplexed
- Streams are prioritized
- Headers compression
#WebPerformances
HTTP2 is coming and might make the whole Internet faster... if we learn how to takes the best from it.
Links (1/3)
"Half of web users expect a site to load in 2 seconds"
https://www.keynote.com/resources/white-papers/best-practices-mobile-website-design
New Symfony toolbar
http://symfony.com/blog/new-in-symfony-2-8-redesigned-web-debug-toolbar
Xdebug – Enabling Xdebug with PHP Storm
https://www.jetbrains.com/phpstorm/help/configuring-xdebug.html
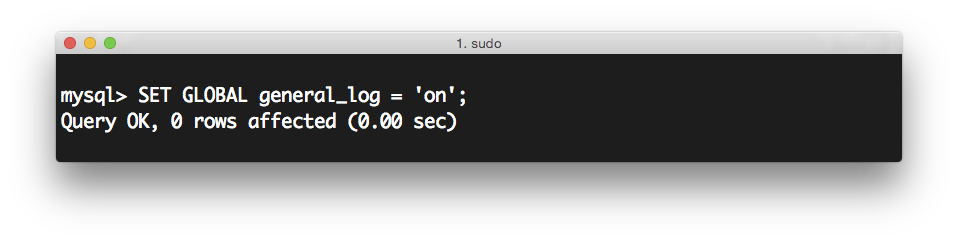
MySQL – Enabling global MySQL log
http://stackoverflow.com/questions/6479107/how-to-enable-mysql-query-log
MySQL – Enabling slow query log
https://rtcamp.com/tutorials/mysql/slow-query-log/
#WebPerformances
Holywood Principle
https://en.wikipedia.org/wiki/Hollywood_principle
Doctrine – Difference between lazy and eager loading
http://stackoverflow.com/questions/26891658/what-is-the-difference-between-fetch-eager-and-fetch-lazy-in-doctrine
BlackFire – Documentation
https://blackfire.io/getting-started
BlackFire – Assertions
http://blog.blackfire.io/performance-tests.html
BlackFire – Manual Code Instrumentation
http://blog.blackfire.io/manual-instrumentation.html
#WebPerformances
Links (2/3)
Symfony Stop Watch Component
http://symfony.com/doc/current/components/stopwatch.html
Varnish – Documentation
https://www.varnish-cache.org/docs
NewRelic
http://newrelic.com/
HTTP2
https://http2.github.io/
#WebPerformances
Links (3/3)
#WebPerformances
The perfect toolbox to debug performances
Nov. 18th 2015 – viscaweb.com/meetings

by
Web Performances - Toolbox - ViscaMeeting 2015-11-20
By ViscaWeb