


Viktor Petukhov
PhD student at the University of Copenhagen
viktor.s.petuhov@ya.ru
BRIC, University of Copenhagen
Khodosevich lab
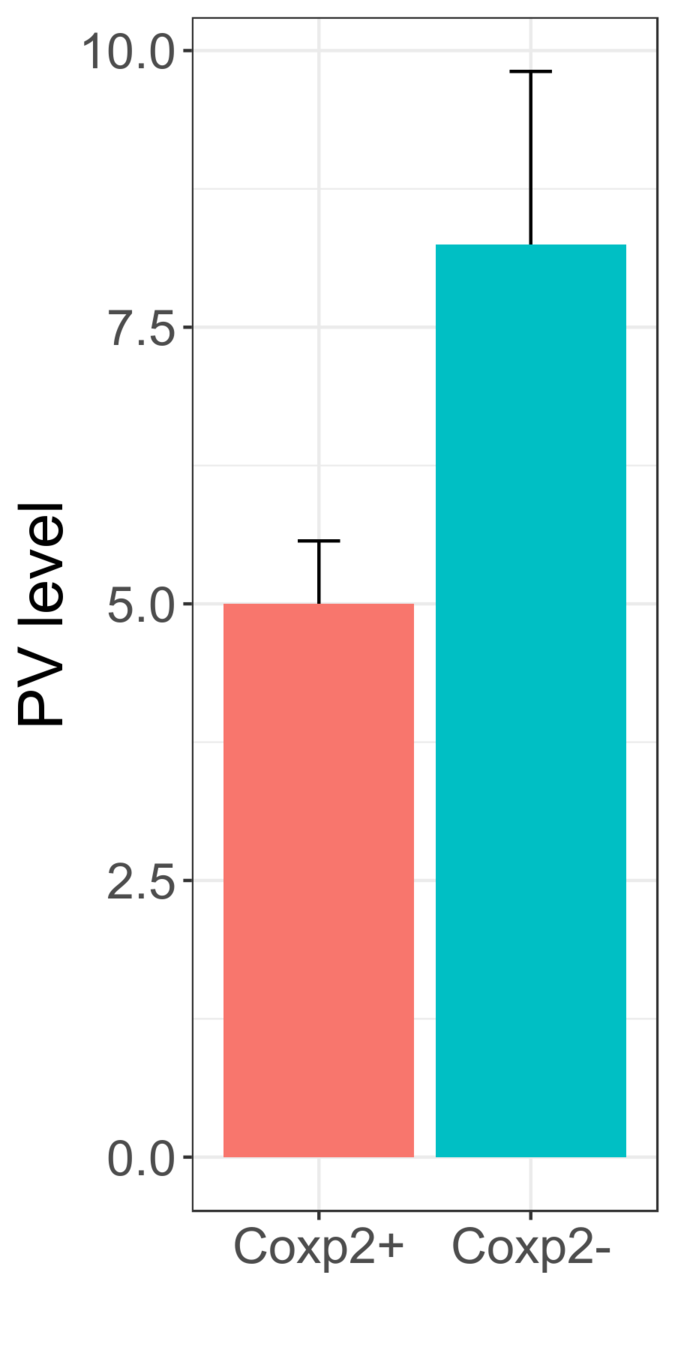
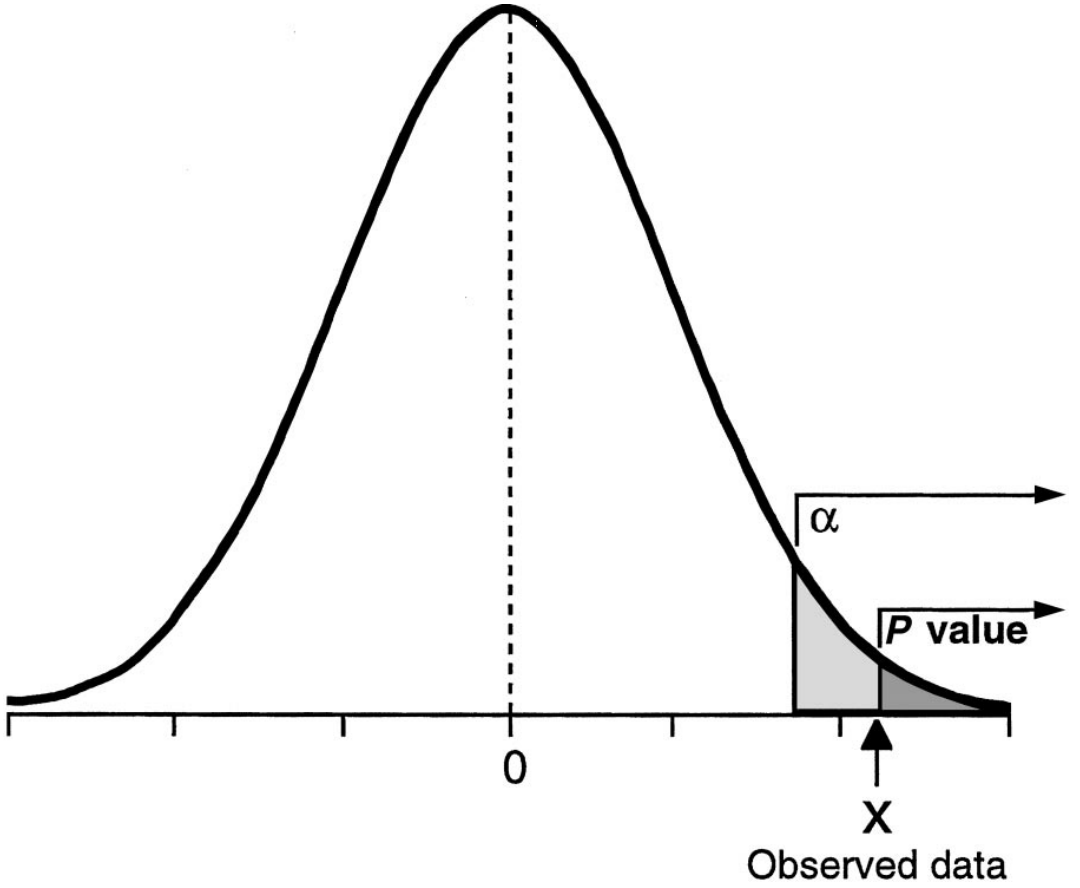
P=0.015
Significant!
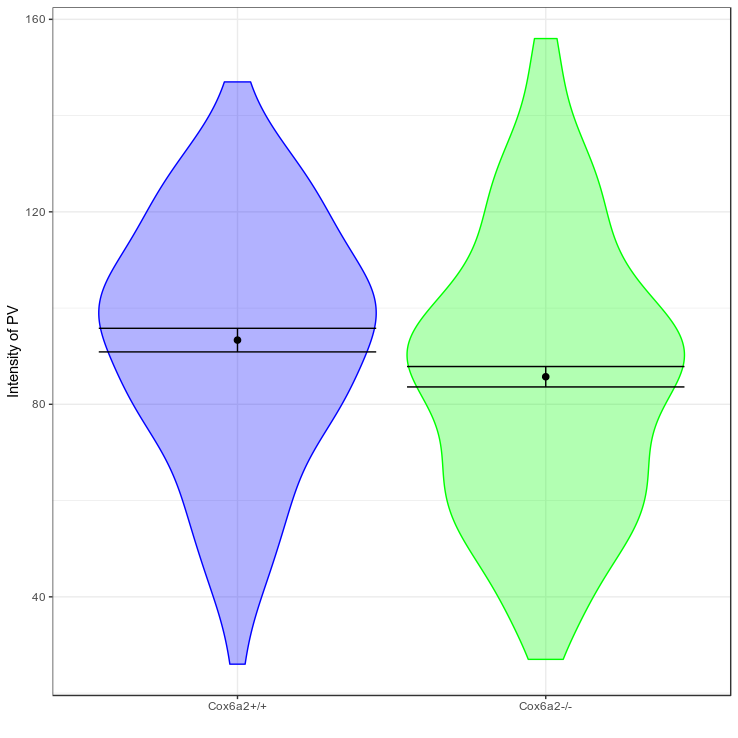
The observed decrease in PV levels and synaptic contacts might indicate impaired maturation of PV+ interneurons.
What's that?
How did we understand?
Data
Statistics
P-value
Conclusion
Mice on drugs
Average weight: 215g
Mice without drugs
Average weight: 205g
Difference: -10g
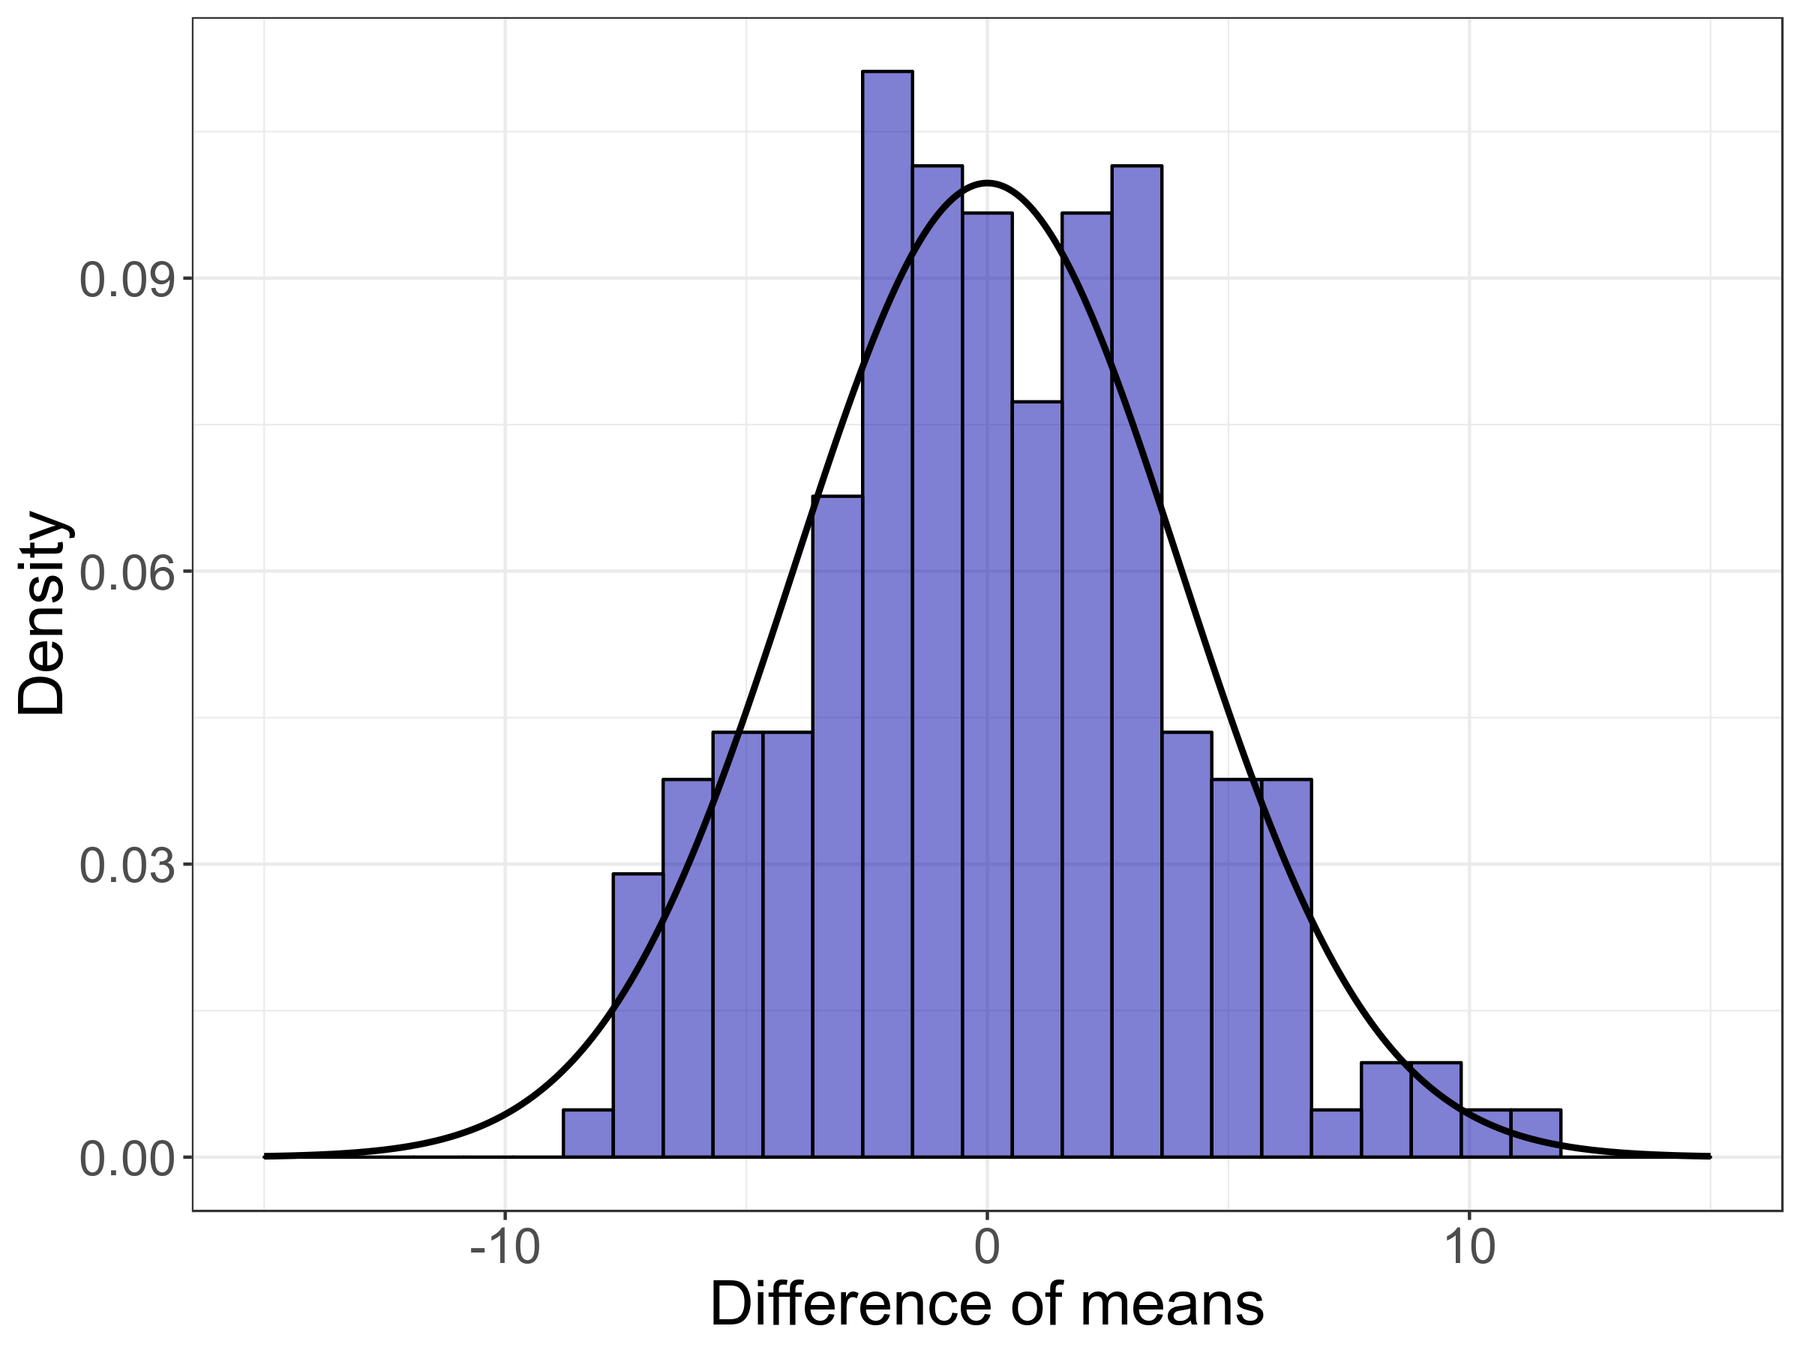
Hypothesis 0: single group, no difference
Hypothesis 0: single group, no difference
Difference: 3g
Hypothesis 0: single group, no difference
Difference: -5g
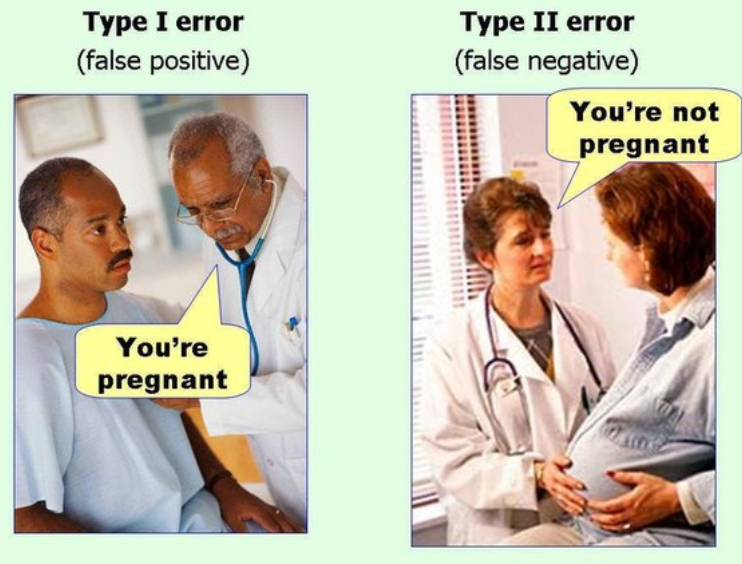
p(difference | H0)
=
False Positive Rate
=
P-value
P=0.015
Significant!
The observed decrease in PV levels and synaptic contacts might indicate impaired maturation of PV+ interneurons.
Data
Statistics
P-value
Conclusion
Long-term strategy
Power of single evidence
*Lehmann E. The Fisher, Neyman-Pearson theories of testing hypotheses: one theory or two? Journal of the American Statistical Association. 1993;88: 1242-9.
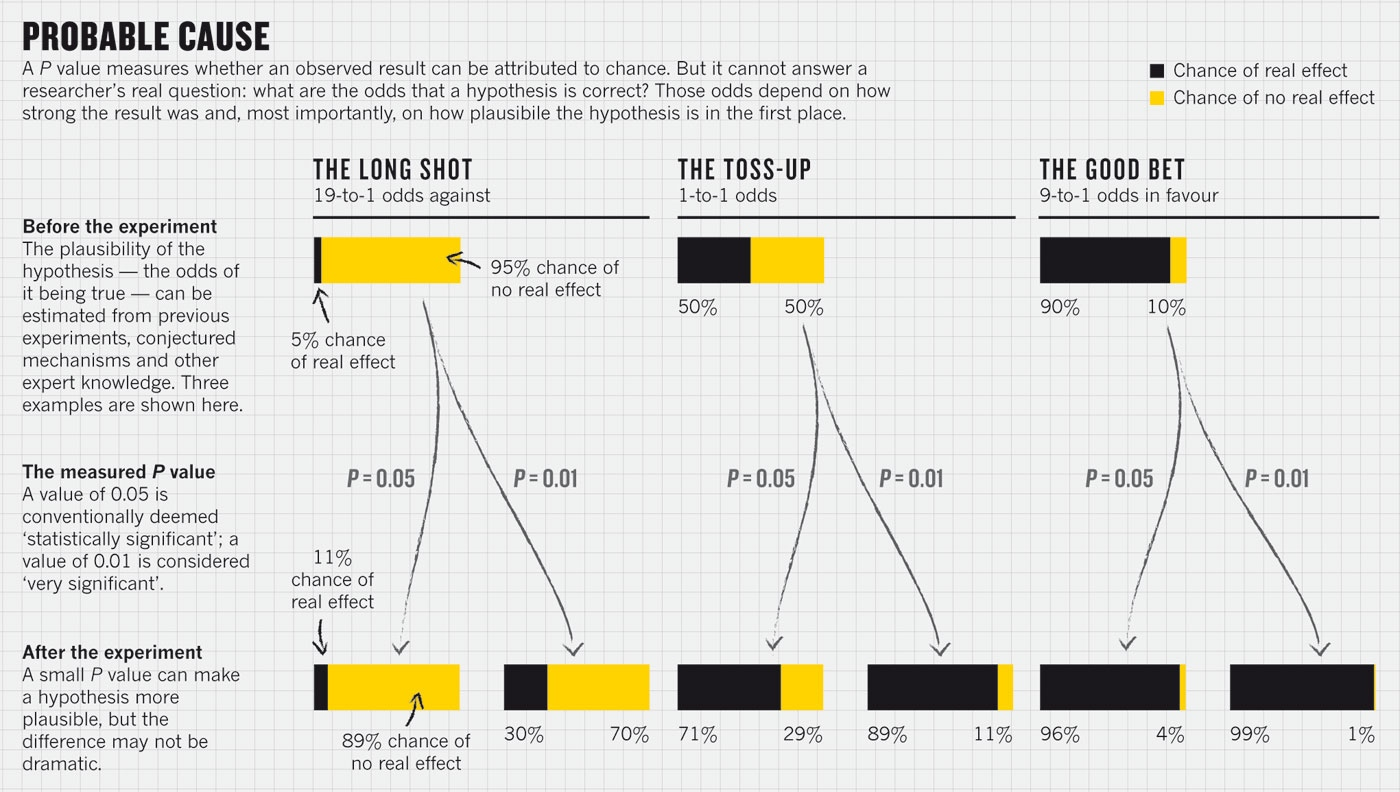
95%
5%
100%
95%
5%
100%
Difference
Difference
Difference
No
Difference
P-value
*Regina Nuzzo. Scientific method: Statistical errors. doi:10.1038/506150a
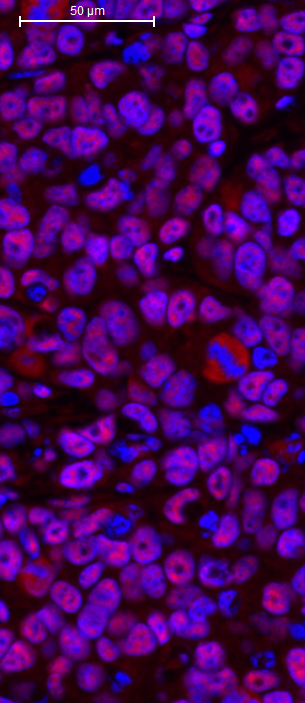
Cells [...] were markedly less bright than [...]. Thus, the MEF2-binding site might set steady-state levels of Cox6a2 expression and E-box fine tunes the specificity.
P-value:
0.015
Significant!
The observed decrease in PV levels and synaptic contacts might indicate impaired maturation of PV+ interneurons.
PNAS, 2013
Study on more than 19,000 people:
those who meet their spouses online are less likely to divorce (p < 0.002) and more likely to have high marital satisfaction (p < 0.001) than those who meet offline
*J. Cacioppo, et. al. Marital satisfaction and break-ups differ across on-line and off-line meeting vensdues. https://doi.org/10.1073/pnas.1222447110
Regina Nuzzo. Scientific method: Statistical errors. doi:10.1038/506150a
Divorce rate:
7.67% vs 5.96%
Happiness:
5.48 vs 5.64
P-value: 0.02
Previous study:
P-value: 0.001
Your study:
Sources:
Evidence
Evidence
Evidence
...
Evidence
Model
Evidence
Evidence
Evidence
...
Evidence
Exploration
_
_
Confirmation
Experiment 1
Experiment 2
Evidence
Evidence
Evidence
...
Evidence
Model
Evidence
Evidence
Evidence
...
Evidence
Exploration
_
_
Confirmation
Experiment 1
Experiment 2
Don't care about significance
Don't use p-values
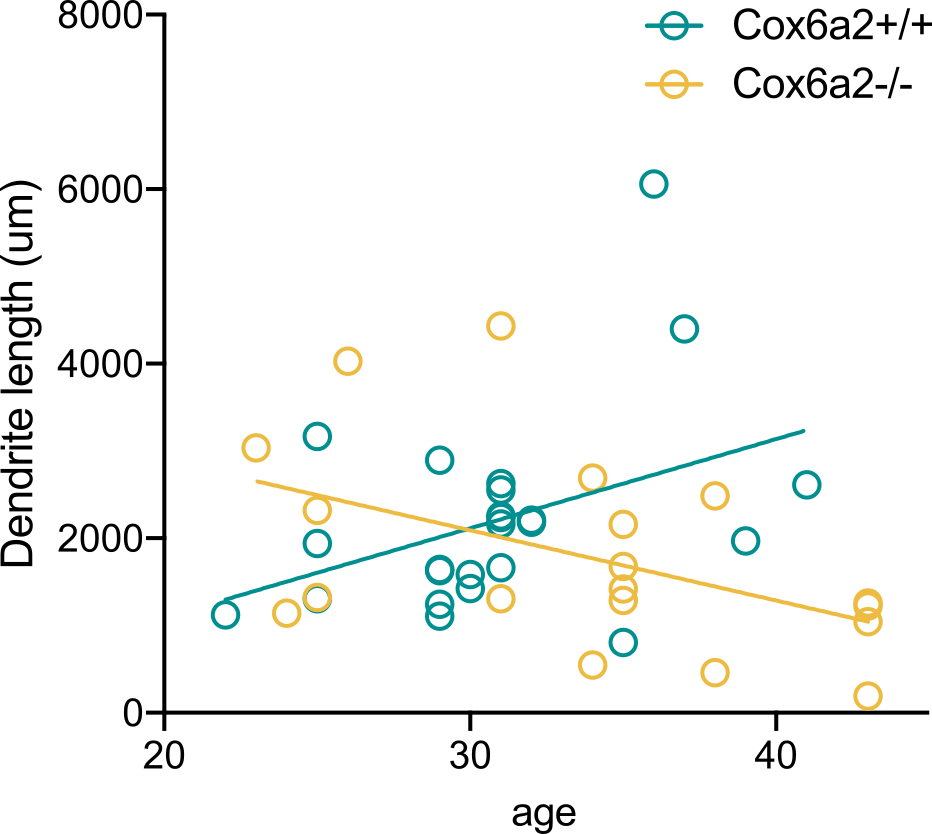
Hypothesis:
Linear regression has non-zero slope
Model:
Dendrite length ~ S * Age + Noise
Noise ~ Normal(mean=0, std=1)
Prior knowledge:
S ~ Normal(mean=0.2, std=0.1)
Model 1:
Length ~ S * Age + Noise
Noise ~ Normal(0, 1)
Prior probability: p0=0.1
Model 2:
Length ~ m + Noise
Noise ~ Normal(0, 1)
Prior probability: p0=0.9
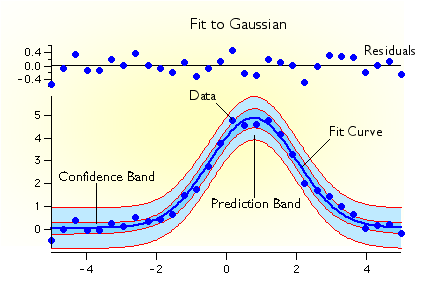
*https://www.wavemetrics.com/products/igorpro/dataanalysis/curvefitting
Residuals and confidence band
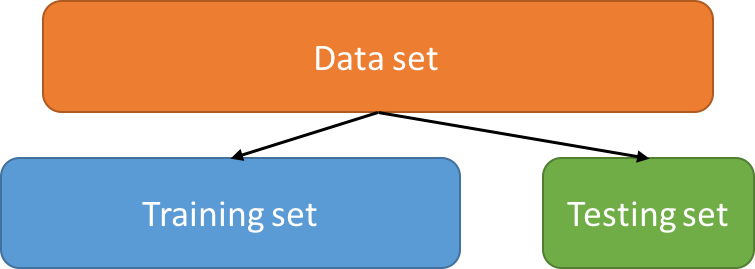
Predictive power
Predictions
Train-test split / Cross-Validation
| P-values | Bayesian |
|---|---|
| No information about effect size | Effect size is fitted by a model |
| No way to aggregate p-values across several studies | Hierarchical models |
| No way to integrate prior knowledge | Prior probabilities |
| No way to estimate error probability | Prior probabilities |
| Mistakenly considered as a 100% proof | Gives "goodness of fit", but not a binary answer |
| Hypotheses, which we test, are weakly connected to real models | Can use very complex models |
| Easy to fool yourself | More transparent system with priors (but still you can do it) |
For normal distribution:
For non-normal distribution:
Confidence intervals
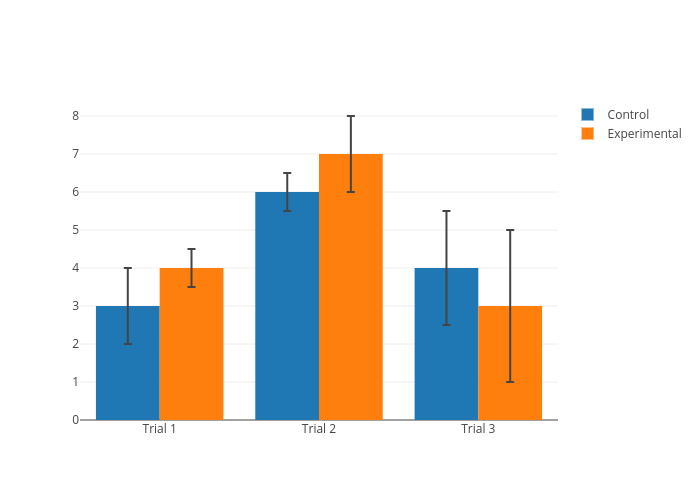
Small data
Big data
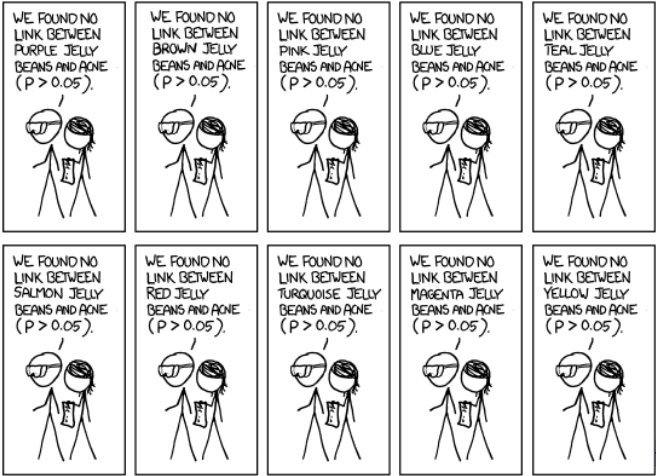
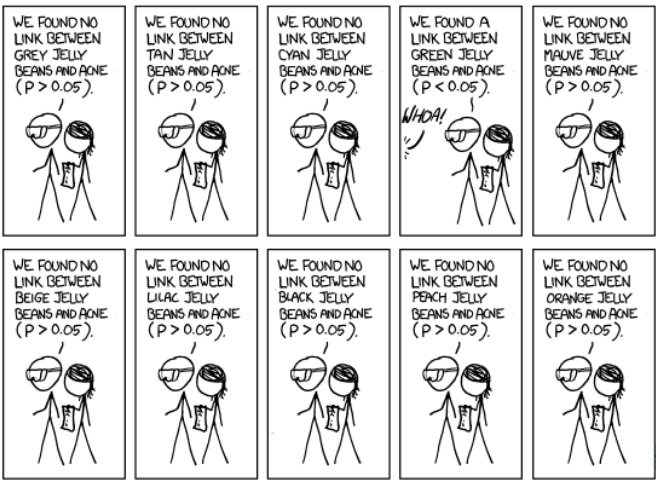
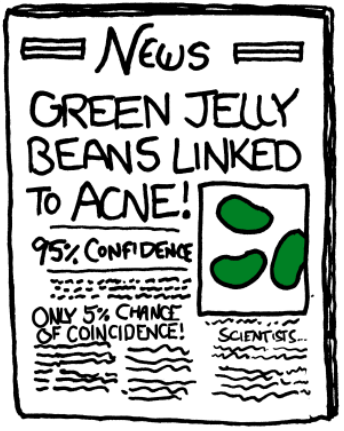
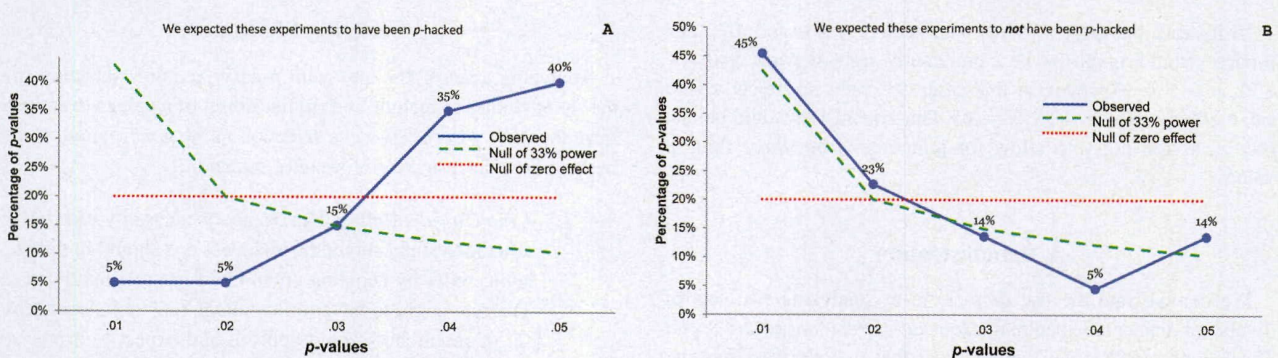
Validation: P-curve
Validation: P-curve
| Problem | Solution |
|---|---|
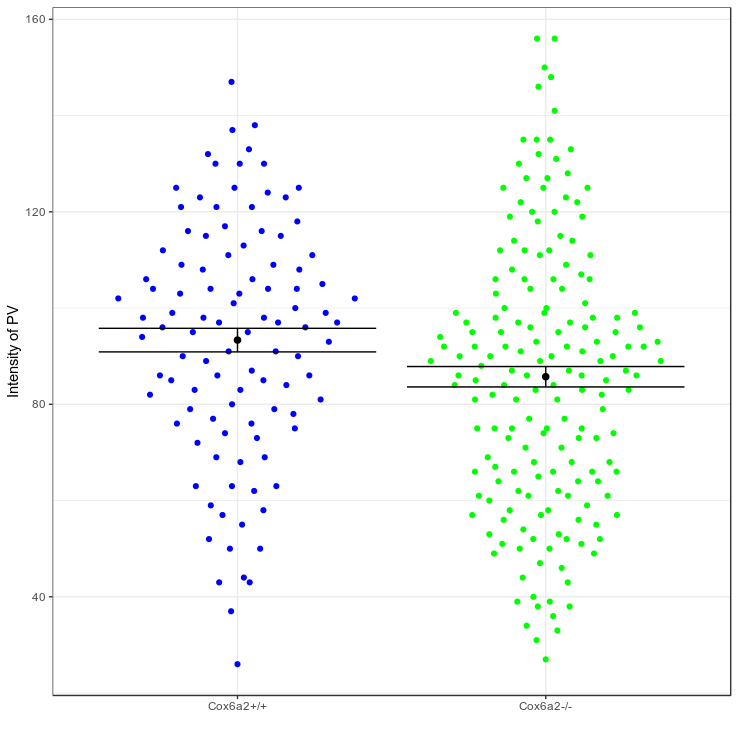
| No information about effect size | Better reporting (e.g. swarmplots with confidence intervals) |
| No way to aggregate p-values across several studies | Adjustment for multiple comparisons |
| No way to integrate prior knowledge | - |
| No way to estimate error probability | - |
| Mistakenly considered as a 100% proof | Keep in mind: p-value is just an evidence. Rely on common sense. |
| Hypotheses, which we test, are weakly connected to real models | Use better hypotheses, learn underlying assumptions |
| Easy to fool yourself | Predetermine rule for publishing and follow it |
University of Copenhagen
Khodosevich lab
viktor.s.petuhov@ya.ru
By Viktor Petukhov


