

Wasi Mohammed Abdullah
An Introvert with exceptions
PYCON DHAKA - 2016
To understand program’s behavior.
identify critical sections of code
Dynamic Analysis of what resources your code uses and how
using built in time module
import time
from math import factorial

def factorial_recursive(n):
    return 1 if n==1 else n * factorial_recursive(n-1)

def factorial_iterative(n):
    value = 1
    for i in range(1, n+1):
        value *= i
    return value

start = time.time()
factorial(100)
print("math.factorial runtime: %.6f"%(time.time() - start))

start = time.time()
factorial_recursive(100)
print("factorial_recursive runtime: %.6f"%(time.time() - start))

start = time.time()
factorial_iterative(100)
print("factorial_iterative runtime: %.6f"%(time.time() - start))
Output
math.factorial runtime: 0.000037
factorial_recursive runtime: 0.000255
factorial_iterative runtime: 0.000080
[Finished in 0.9s]
not all systems provide time with a better precision than 1 second - Python Doc
wasi@Leo:~/PYCON2016$ python3 factorial_timer.py
math.factorial runtime: 0.000010
factorial_recursive runtime: 0.000096
factorial_iterative runtime: 0.000046
wasi@Leo:~/PYCON2016$ python3 factorial_timer.py
math.factorial runtime: 0.000011
factorial_recursive runtime: 0.000131
factorial_iterative runtime: 0.000172
wasi@Leo:~/PYCON2016$ python3 factorial_timer.py
math.factorial runtime: 0.000009
factorial_recursive runtime: 0.000068
factorial_iterative runtime: 0.000028
wasi@Leo:~/PYCON2016$
time.perf_counter()
wasi@Leo:~/PYCON2016$ python3 factorial_timer.py
math.factorial runtime: 0.000010
factorial_recursive runtime: 0.000064
factorial_iterative runtime: 0.000026
wasi@Leo:~/PYCON2016$ python3 factorial_timer.py
math.factorial runtime: 0.000011
factorial_recursive runtime: 0.000084
factorial_iterative runtime: 0.000041
wasi@Leo:~/PYCON2016$ python3 factorial_timer.py
math.factorial runtime: 0.000013
factorial_recursive runtime: 0.000098
factorial_iterative runtime: 0.000043
wasi@Leo:~/PYCON2016$
time.process_time()
def heck_of_an_optimization(n):
    return sum( 16*11*2015*n for i in range(9876543))
def optimize_it(n):
     return sum( n*16*11*2015 for i in range(9876543))
wasi@Leo:~/PYCON2016$ python3 -m cProfile expression_magic.py
         19753095 function calls in 8.717 seconds

   Ordered by: standard name

   ncalls  tottime  percall  cumtime  percall filename:lineno(function)
        1    0.000    0.000    8.717    8.717 expression_magic.py:1(<module>)
        1    0.000    0.000    4.698    4.698 expression_magic.py:1(optimize_it)
  9876544    3.137    0.000    3.137    0.000 expression_magic.py:2(<genexpr>)
        1    0.000    0.000    4.020    4.020 expression_magic.py:5(heck_of_an_optimization)
  9876544    2.248    0.000    2.248    0.000 expression_magic.py:6(<genexpr>)
        1    0.000    0.000    8.717    8.717 {built-in method builtins.exec}
        2    3.333    1.666    8.717    4.359 {built-in method builtins.sum}
        1    0.000    0.000    0.000    0.000 {method 'disable' of '_lsprof.Profiler' objects}

wasi@Leo:~/PYCON2016$ python3 -m cProfile expression_magic.py
         19753095 function calls in 9.855 seconds

   Ordered by: standard name

   ncalls  tottime  percall  cumtime  percall filename:lineno(function)
        1    0.000    0.000    9.855    9.855 expression_magic.py:1(<module>)
        1    0.000    0.000    5.822    5.822 expression_magic.py:1(optimize_it)
  9876544    3.865    0.000    3.865    0.000 expression_magic.py:2(<genexpr>)
        1    0.000    0.000    4.033    4.033 expression_magic.py:5(heck_of_an_optimization)
  9876544    2.251    0.000    2.251    0.000 expression_magic.py:6(<genexpr>)
        1    0.000    0.000    9.855    9.855 {built-in method builtins.exec}
        2    3.739    1.869    9.855    4.928 {built-in method builtins.sum}
        1    0.000    0.000    0.000    0.000 {method 'disable' of '_lsprof.Profiler' objects}

wasi@Leo:~/PYCON2016$ python3 -m cProfile expression_magic.py
         19753095 function calls in 8.938 seconds

   Ordered by: standard name

   ncalls  tottime  percall  cumtime  percall filename:lineno(function)
        1    0.000    0.000    8.938    8.938 expression_magic.py:1(<module>)
        1    0.000    0.000    4.701    4.701 expression_magic.py:1(optimize_it)
  9876544    3.138    0.000    3.138    0.000 expression_magic.py:2(<genexpr>)
        1    0.000    0.000    4.238    4.238 expression_magic.py:5(heck_of_an_optimization)
  9876544    2.368    0.000    2.368    0.000 expression_magic.py:6(<genexpr>)
        1    0.000    0.000    8.938    8.938 {built-in method builtins.exec}
        2    3.433    1.716    8.938    4.469 {built-in method builtins.sum}
        1    0.000    0.000    0.000    0.000 {method 'disable' of '_lsprof.Profiler' objects}

wasi@Leo:~/PYCON2016$
percall - How long each call took (inclusive and exclusive)
ncalls - How many times it was called
cumtime - How long it took (including its other function calls time)
tottime - How long it actually took (excludes the times of other functions) - *
callers - What functions it called
callees - What functions called it
wasi@Leo:~/PYCON2016$ python3 -m timeit "n=343143; n*16*11*2015;"
10000000 loops, best of 3: 0.184 usec per loop
wasi@Leo:~/PYCON2016$ python3 -m timeit "n=343143; n*16*11*2015;"
1000000 loops, best of 3: 0.235 usec per loop
wasi@Leo:~/PYCON2016$ python3 -m timeit "n=343143; n*16*11*2015;"
1000000 loops, best of 3: 0.223 usec per loop
wasi@Leo:~/PYCON2016$ python3 -m timeit "n=343143; 16*11*2015*n;"
10000000 loops, best of 3: 0.074 usec per loop
wasi@Leo:~/PYCON2016$ python3 -m timeit "n=343143; 16*11*2015*n;"
10000000 loops, best of 3: 0.0875 usec per loop
wasi@Leo:~/PYCON2016$ python3 -m timeit "n=343143; 16*11*2015*n;"
10000000 loops, best of 3: 0.0687 usec per loop
wasi@Leo:~/PYCON2016$
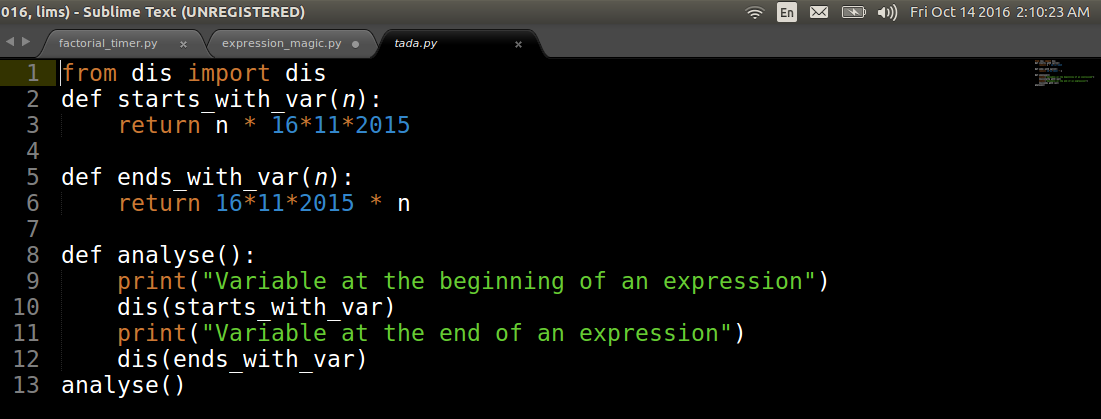
sum( n*16*11*2015 for i in range(9876543)) #optimize_it
sum( 16*11*2015*n for i in range(9876543)) #heck_of_an_optimization
The only difference is the position of n
Variable at the beginning of an expression
  3           0 LOAD_FAST                0 (n)
              3 LOAD_CONST               1 (16)
              6 BINARY_MULTIPLY
              7 LOAD_CONST               2 (11)
             10 BINARY_MULTIPLY
             11 LOAD_CONST               3 (2015)
             14 BINARY_MULTIPLY
             15 RETURN_VALUE
Variable at the end of an expression
  6           0 LOAD_CONST               5 (354640)
              3 LOAD_FAST                0 (n)
              6 BINARY_MULTIPLY
              7 RETURN_VALUE
[Finished in 0.4s]
the disassembly of the expressions
class CustomMul(object):

    def __init__ (self):
        self.val = 1

    def __mul__ (self, other):
        print "doing some other stuff inside mul"
        self.val *= other
        return self

ob = CustomMul()
print(ob*16*11)
Output:
doing some other stuff inside mul
doing some other stuff inside mul
<__main__.CustomMul object at 0x7f33f2fe0190>
[Finished in 0.0s]nums = list()
while True:
try:
num = int(input())
nums.append(num)
except EOFError:
break
print(nums)Naive Buggy Implementation:
wasi@Leo:~/PYCON2016$ cat input.txt | python3 -m cProfile integers.py
         200237 function calls in 0.373 seconds

   Ordered by: standard name

   ncalls  tottime  percall  cumtime  percall filename:lineno(function)
       73    0.000    0.000    0.000    0.000 codecs.py:318(decode)
        1    0.099    0.099    0.373    0.373 integers.py:1(<module>)
       73    0.000    0.000    0.000    0.000 {built-in method _codecs.utf_8_decode}
        1    0.000    0.000    0.373    0.373 {built-in method builtins.exec}
   100044    0.175    0.000    0.176    0.000 {built-in method builtins.input}
        1    0.086    0.086    0.086    0.086 {built-in method builtins.print}
   100043    0.012    0.000    0.012    0.000 {method 'append' of 'list' objects}
        1    0.000    0.000    0.000    0.000 {method 'disable' of '_lsprof.Profiler' objects}
Post Analysis Note:
from sys import stdin
nums = list()

for line in stdin.readlines():
    num = int(line)
    nums.append(num)
print(num)
Naive Improved Implementation:
wasi@Leo:~/PYCON2016$ cat input.txt | python3 -m cProfile integers.py
     100198 function calls in 0.247 seconds

   Ordered by: standard name

   ncalls  tottime  percall  cumtime  percall filename:lineno(function)
        1    0.000    0.000    0.000    0.000 <frozen importlib._bootstrap>:996(_handle_fromlist)
       74    0.000    0.000    0.001    0.000 codecs.py:318(decode)
        1    0.071    0.071    0.247    0.247 integers.py:1(<module>)
       74    0.000    0.000    0.000    0.000 {built-in method _codecs.utf_8_decode}
        1    0.000    0.000    0.247    0.247 {built-in method builtins.exec}
        1    0.000    0.000    0.000    0.000 {built-in method builtins.hasattr}
        1    0.152    0.152    0.152    0.152 {built-in method builtins.print}
   100043    0.008    0.000    0.008    0.000 {method 'append' of 'list' objects}
        1    0.000    0.000    0.000    0.000 {method 'disable' of '_lsprof.Profiler' objects}
        1    0.015    0.015    0.016    0.016 {method 'readlines' of '_io._IOBase' objects}
Post Analysis Note:
from sys import stdin
nums = list(int(line) for line in stdin.readlines())
print(nums)
Improve even more!
wasi@Leo:~/PYCON2016$ cat input.txt | python3 -m cProfile integers.py
    100199 function calls in 0.198 seconds

   Ordered by: standard name

   ncalls  tottime  percall  cumtime  percall filename:lineno(function)
        1    0.000    0.000    0.000    0.000 <frozen importlib._bootstrap>:996(_handle_fromlist)
       74    0.000    0.000    0.000    0.000 codecs.py:318(decode)
        1    0.015    0.015    0.198    0.198 integers.py:1(<module>)
   100044    0.044    0.000    0.044    0.000 integers.py:2(<genexpr>)
       74    0.000    0.000    0.000    0.000 {built-in method _codecs.utf_8_decode}
        1    0.000    0.000    0.198    0.198 {built-in method builtins.exec}
        1    0.000    0.000    0.000    0.000 {built-in method builtins.hasattr}
        1    0.124    0.124    0.124    0.124 {built-in method builtins.print}
        1    0.000    0.000    0.000    0.000 {method 'disable' of '_lsprof.Profiler' objects}
        1    0.014    0.014    0.015    0.015 {method 'readlines' of '_io._IOBase' objects}
Post Analysis Note:
from sys import stdin
nums = list(map(int, stdin.readlines()))
print(nums)
Further Improvement Using map instead of gene_exp!
wasi@Leo:~/PYCON2016$ cat input.txt | python3 -m cProfile integers.py
    155 function calls in 0.134 seconds

   Ordered by: standard name

   ncalls  tottime  percall  cumtime  percall filename:lineno(function)
        1    0.000    0.000    0.000    0.000 <frozen importlib._bootstrap>:996(_handle_fromlist)
       74    0.000    0.000    0.000    0.000 codecs.py:318(decode)
        1    0.030    0.030    0.134    0.134 integers.py:1(<module>)
       74    0.000    0.000    0.000    0.000 {built-in method _codecs.utf_8_decode}
        1    0.000    0.000    0.134    0.134 {built-in method builtins.exec}
        1    0.000    0.000    0.000    0.000 {built-in method builtins.hasattr}
        1    0.089    0.089    0.089    0.089 {built-in method builtins.print}
        1    0.000    0.000    0.000    0.000 {method 'disable' of '_lsprof.Profiler' objects}
        1    0.014    0.014    0.015    0.015 {method 'readlines' of '_io._IOBase' objects}
Post Analysis Note:
Simplicity is the best"
By Wasi Mohammed Abdullah
PYCON DHAKA - 2016