What Streamlit
Can and Can't
(or Shouldn't)
Do

Hi👋

Yuichiro Tachibana


@whitphx
- Pythonista
- OSS enthusiast
- ML Developer Advocate at Hugging Face
- Streamlit Creator
Agenda
-
What's Streamlit
- How to use it
-
What Streamlit can and can't (or shouldn't) do
- Is it suitable for XX?
Streamlit is...
- Python framework
- to create Web UI
- only in Python
Its target users are...
- Any Python programmers
who want Web UI
but don't want to write JavaScript - Data scientists
- Machine learning engineers

Hello Streamlit
$ pip install streamlit
$ code app.py
Hello Streamlit
import streamlit as st

st.title("Hello PyConFR :rainbow[2024]!")

st.markdown("This is our **first** [Streamlit](https://streamlit.io/) app :balloon:")
$ streamlit run app.py

  You can now view your Streamlit app in your browser.

  Local URL: http://localhost:8501
  Network URL: http://192.168.1.1:8501
Pure-Python Web UI framework
Write only Python, get a web app
import streamlit as st

st.title("Hello PyConFR :rainbow[2024]!")

st.markdown("This is our **first** [Streamlit](https://streamlit.io/) app :balloon:")

Display contents as you write
import streamlit as st
st.title('Awesome Streamlit app')
st.header("Data Visualizations")
st.markdown("Streamlit is a great tool to create visualizations")
st.subheader("Plotting")
st.area_chart({'data': [1, 5, 2, 6, 2, 1], 'data2': [10, 15, 12, 16, 12, 11]})
st.subheader("Maps")
st.map({"lat": [37.7749295, 35.6895, 34.052235], "lon": [-122.4194155, -139.6917, -118.243683]})
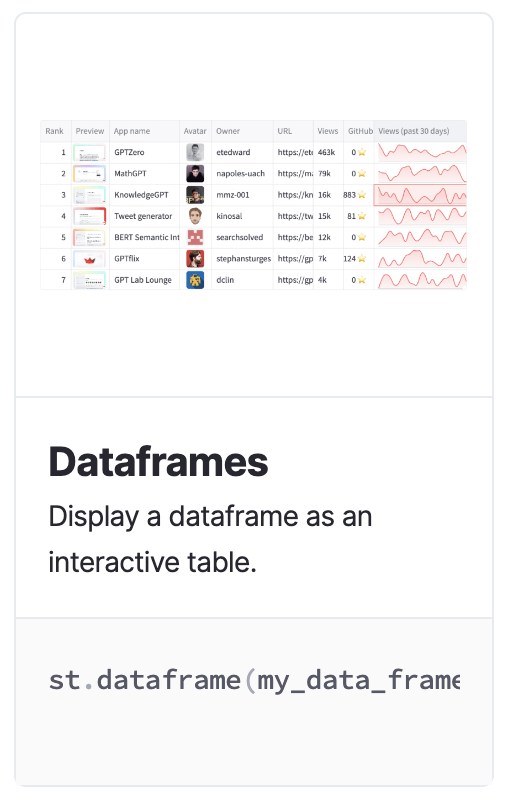
st.header("Dataframes")
st.write('Here is a simple dataframe')
st.dataframe({'A': [random.randint(0, 100) for _ in range(10)], 'B': [random.randint(0, 100) for _ in range(10)], 'C': [random.randint(0, 100) for _ in range(10)]})
st.header("Images")
st.image(image, caption='Random image from picsum.photos', use_column_width=True)


Lots of built-in components
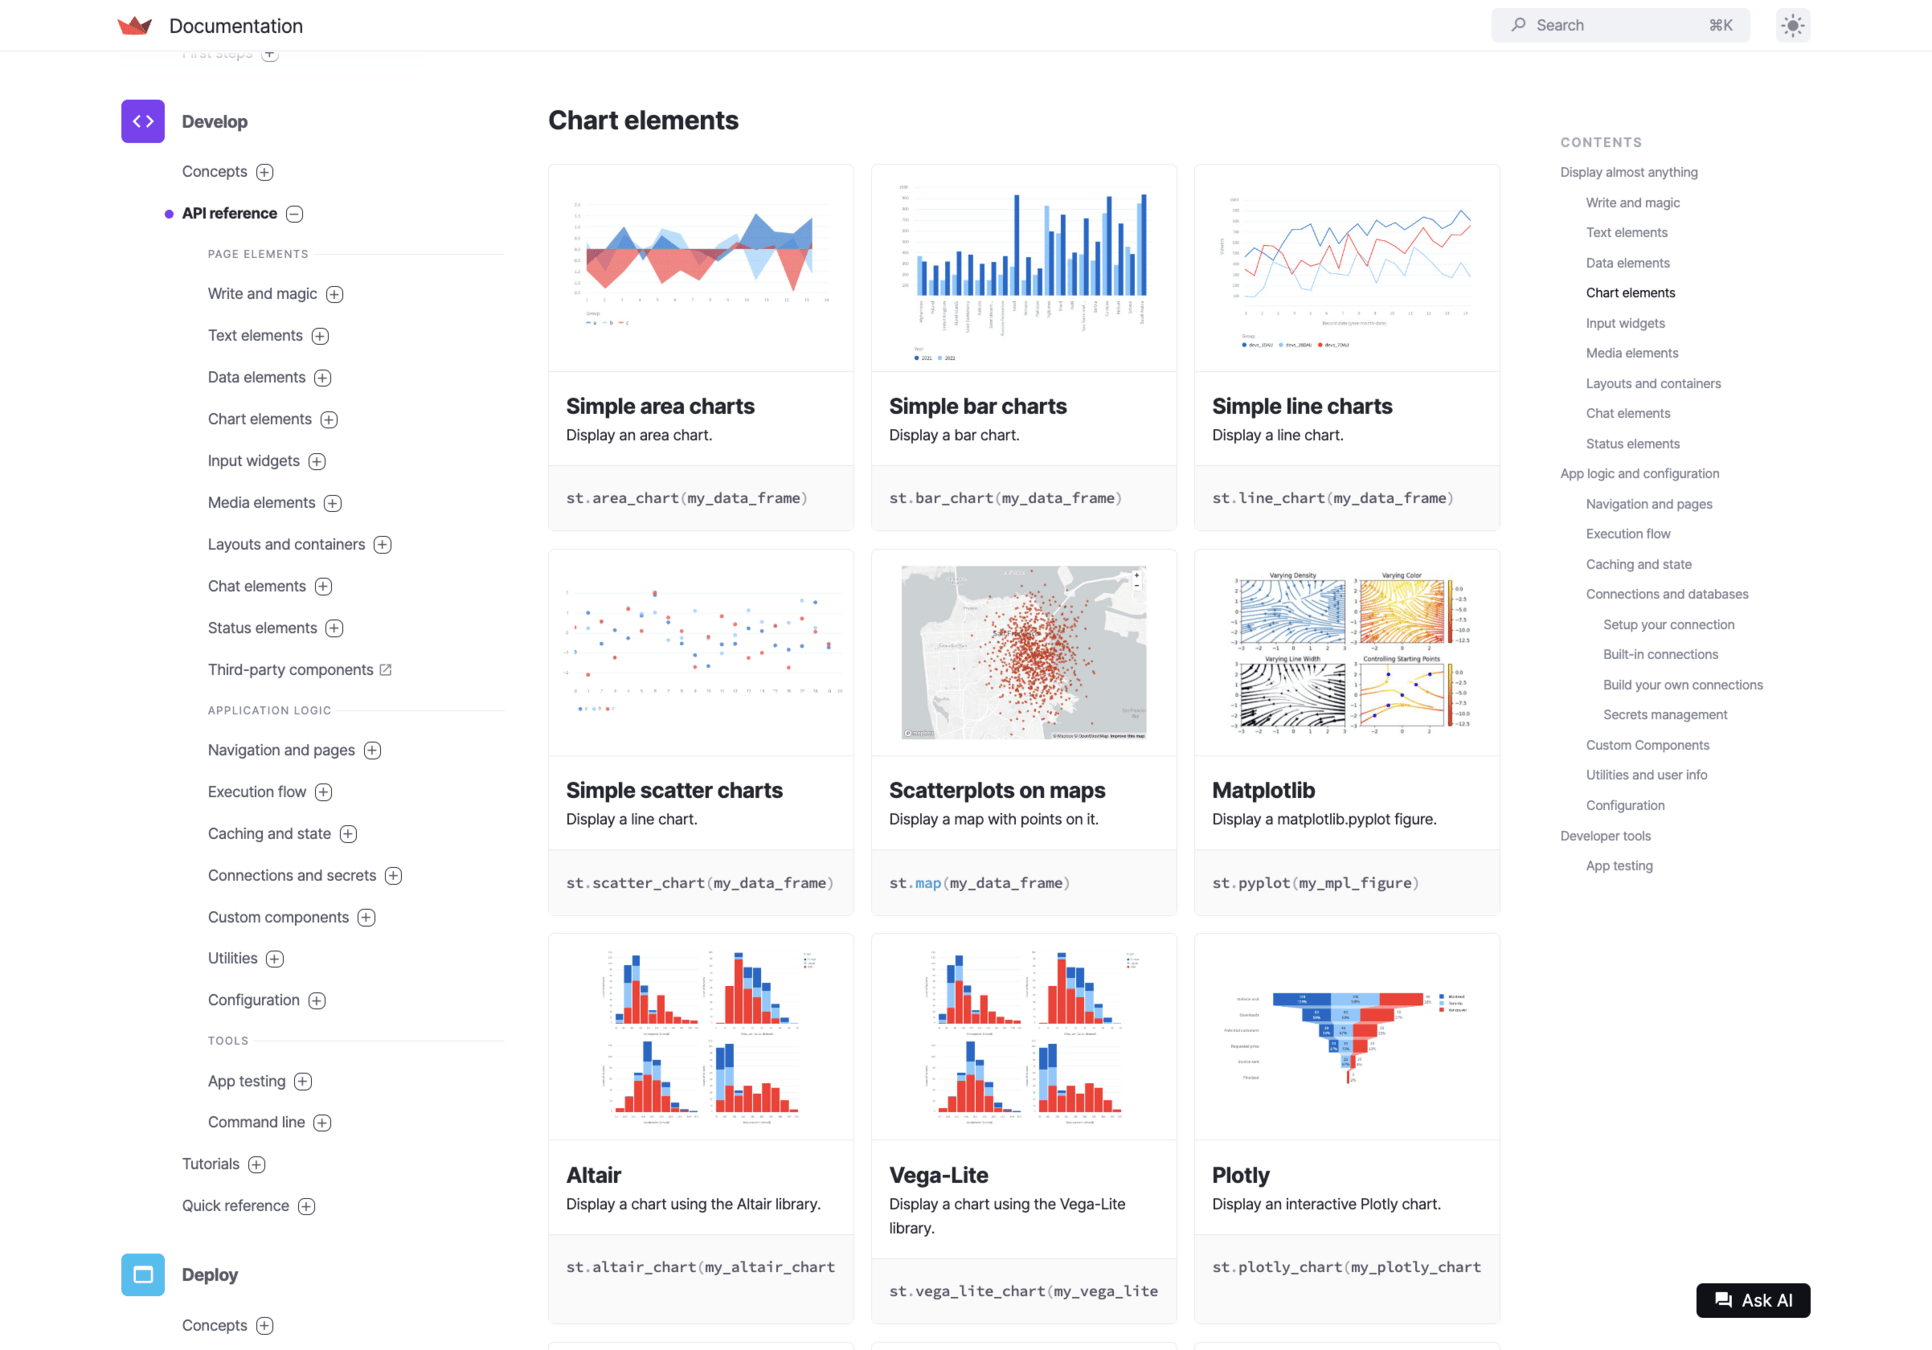
st.line_chart()st.table()st.title()st.text()st.scatter_chart()st.plotly_chart()st.button()st.selectbox()st.date_input()st.camera_input()st.column()st.chat_input()st.navigation()st.secret()st.dialog()st.fragment()st.connection()st.bokeh_chart()st.area_chart()st.bar_chart()st.alteir_chart()st.markdown()Interactive UI
Interactive apps
import streamlit as st

toggle_value = st.toggle("Click me!")

if toggle_value:
    st.markdown(":large_green_circle: ON")
else:
    st.markdown(":large_red_square: OFF")
Interactive apps
import streamlit as st

toggle_value = st.toggle("Click me!")

if toggle_value:
    st.markdown(":large_green_circle: ON")
else:
    st.markdown(":large_red_square: OFF")
$ streamlit run app.py
$ streamlit run app.py📜
app.py
Web browser
Python runtime

Streamlit
Server
Script runner
Static files

Web server
React
SPA

React SPA
JavaScript runtime

$ streamlit run app.py📜
app.py
Web browser
Python runtime
Streamlit
Server
Script runner
Static files
Web server
React
SPA
React SPA
JavaScript runtime
User input triggers re-run
Frontend
import streamlit as st

toggle_value = st.toggle("Click me!")

if toggle_value:
    st.markdown(":large_green_circle: ON")
else:
    st.markdown(":large_red_square: OFF")
Python code
# TrueTrigger re-run
Update UI


User input triggers re-run
Frontend
import streamlit as st

toggle_value = st.toggle("Click me!")

if toggle_value:
    st.markdown(":large_green_circle: ON")
else:
    st.markdown(":large_red_square: OFF")
Python code
# FalseTrigger re-run
Update UI

Top-to-Bottom execution
makes it possible to build interactive UI without callbacks.
import streamlit as st

toggle_value = st.toggle("Click me!")

if toggle_value:
    st.markdown("ON")
else:
    st.markdown("OFF")
import some_framework as sf

def callback(toggle_value):
    text_field = sf.get_element(id="value")
    if toggle_value:
        text_field.text = "ON"
    else:
        text_field.text = "OFF"

sf.toggle("Click me!", callback=callback)

sf.text(id="value", text="ON")
✅
🚨
Aside: is it like React?
- Declarative UI
- Colocated logic and view
import streamlit as st

toggle_state = st.toggle("Toggle me!")

if toggle_state:
    st.write("The toggle is ON!")
else:
    st.write("The toggle is OFF.")
import React, { useState } from "react";

function ToggleButton() {
  const [toggleState, setToggleState] = useState(false);

  const handleToggle = () => {
    setToggleState((prevState) => !prevState);
  };

  return (
    <div>
      <button onClick={handleToggle}>
        {toggleState ? "ON" : "OFF"}
      </button>
      <p>The toggle is {toggleState ? "ON!" : "OFF."}</p>
    </div>
  );
}

export default ToggleButton;
Imperative escape hatch
Next example: ToDo app
ToDo app code?
import streamlit as st

tasks = []

new_task_name = st.text_input("Task Name")
if new_task_name:
    tasks.append(new_task_name)

st.write("## Tasks")
for task in tasks:
    st.write(task)
🤔
Session State
import streamlit as st

# tasks = []   # ⚠️ Doesn't work.
if "tasks" not in st.session_state:
    st.session_state.tasks = []
tasks = st.session_state.tasks

new_task_name = st.text_input("Task Name")
if new_task_name:
    tasks.append(new_task_name)

st.write("## Tasks")
for task in tasks:
    st.write(task)
👍
ToDo app
State persisted over reruns
Frontend
import streamlit as st

if "tasks" not in st.session_state:
    st.session_state.tasks = []
tasks = st.session_state.tasks

new_task_name = st.text_input("Task Name")
if new_task_name:
    tasks.append(new_task_name)

st.write("## Tasks")
for task in tasks:
    st.write(task)
Python code


# []# ["Yuichiro"]# ["Yuichiro",
"Alice"]Session State
Use
for data that persists between multiple runs.
st.session_state[key]Revisit: React
Streamlit shares some concepts with React (inspired by React?)
- Unlike React,
components hide the state management. - Like React,
state management outside of the components is explicit.
Wrap-up: Top-to-Bottom exec
Subtitle
Pros ✅
Cons 🚨
- Text
Layout/Design
Auto layout alignment
import streamlit as st

st.title('Awesome Streamlit app')

st.header("Data Visualizations")
st.markdown("Streamlit is a great tool to create visualizations")

st.subheader("Plotting")

st.area_chart({'data': [1, 5, 2, 6, 2, 1], 'data2': [10, 15, 12, 16, 12, 11]})

st.subheader("Maps")

st.map({"lat": [37.7749295, 35.6895, 34.052235], "lon": [-122.4194155, -139.6917, -118.243683]})

st.header("Dataframes")

st.write('Here is a simple dataframe')
st.dataframe({'A': [random.randint(0, 100) for _ in range(10)], 'B': [random.randint(0, 100) for _ in range(10)], 'C': [random.randint(0, 100) for _ in range(10)]})

st.header("Images")

st.image(image, caption='Random image from picsum.photos', use_column_width=True)
Theming

Sidebar
Main column
Unified Streamlit-ish look
Theming
Sidebar
Main column
Unified Streamlit-ish look
textColor, font
primaryColor
secondaryBackgroundColor
backgroundColor
Flexibility vs Simplicity
st.logo


You just have these options. Streamlit does the rest.

Restrictions make things simpler
You can get a nice look 'n' feel interactive app like this:
...just by writing Python code
calling components,
and configuring the theme if needed.
st.*()@st.cache_data
def get_UN_data():
AWS_BUCKET_URL = "https://streamlit-demo-data.s3-us-west-2.amazonaws.com"
df = pd.read_csv(AWS_BUCKET_URL + "/agri.csv.gz")
return df.set_index("Region")
try:
df = get_UN_data()
countries = st.multiselect(
"Choose countries", list(df.index), ["China", "United States of America"]
)
if not countries:
st.error("Please select at least one country.")
else:
data = df.loc[countries]
data /= 1000000.0
st.write("### Gross Agricultural Production ($B)", data.sort_index())
data = data.T.reset_index()
data = pd.melt(data, id_vars=["index"]).rename(
columns={"index": "year", "value": "Gross Agricultural Product ($B)"}
)
chart = (
alt.Chart(data)
.mark_area(opacity=0.3)
.encode(
x="year:T",
y=alt.Y("Gross Agricultural Product ($B):Q", stack=None),
color="Region:N",
)
)
st.altair_chart(chart, use_container_width=True)
except URLError as e:
st.error(
"""
**This demo requires internet access.**
Connection error: %s
"""
% e.reason
)You just write Python. Streamlit does the rest.
Escape hatches for custom design
Custom CSS
So why you should use Streamlit?
So why we should use Streamlit?
- Fast and Easy development of
- Interactive Web apps
- Only in Python
- Callback-less code with the top-to-bottom execution model
- Pre-defined theming/layout


Web UI frameworks
Server-side web frameworks

Among many frameworks...
Comparison
Streamlit
(Web UI Frameworks)
Serverside Web Frameworks
+ Frontend dev
All-in-one
Pick what you need
Python only
Tech stack
Languages
Python + JS
+ Data serializer (JSON/Protobuf/...)
Design
Low-flexibility/Easy
Full flexiblity
Logic/Modeling
Declarative
Up to you
Declarative vs Imperative
Jupyter-embeddable vs not
Flexible layout vs Easy design
Web UI frameworks
Server-side web frameworks
Comparison
Streamlit
Other Web UI Frameworks
All-in-one
All-in-one
Python only
Tech stack
Languages
Python only
Design
Low-flexibility/Easy
Per-framework
Logic/Modeling
Declarative
Per-framework
Use cases
Revisit: Todo app
import streamlit as st

if "tasks" not in st.session_state:
    st.session_state.tasks = []
tasks = st.session_state.tasks

new_task_name = st.text_input("Task Name")
if new_task_name:
    tasks.append(new_task_name)

st.write("## Tasks")
for task in tasks:
    st.write(task)
Dynamic contents
relying on data/states
- Dynamic number of fields
- Multi-step wizards
- Data visualization
- Conditional UI
Budget Allocator

Budget Allocator
Budget Allocator
Data dependencies⚡️
Budget Allocator
import streamlit as st

st.title("Budget Allocator")

# Set total budget and number of categories
total_budget = st.number_input("Total Budget ($)", min_value=1000, value=5000, step=500)
num_categories = st.number_input("Number of Categories", min_value=1, value=3)

# Generate sliders for each category
allocations = [
    st.slider(f"Category {i+1} Allocation", min_value=0, max_value=total_budget, value=total_budget // num_categories)
    for i in range(num_categories)
]

# Calculate allocated and remaining budget
total_allocated = sum(allocations)
remaining_budget = total_budget - total_allocated

# Display budget summary
st.write("### Allocation Summary")
st.write(f"Total Allocated: ${total_allocated}")
st.write(f"Remaining Budget: ${remaining_budget}")

# Provide feedback based on budget status
if total_allocated > total_budget:
    st.error("You have exceeded the total budget!")
elif remaining_budget < total_budget * 0.1:
    st.warning("Warning: You are nearing your total budget.")
else:
    st.success("You are within the budget.")
import dash
from dash import dcc, html
from dash.dependencies import Input, Output, State, ALL

# Initialize the Dash app
app = dash.Dash(__name__, suppress_callback_exceptions=True)

# App layout
app.layout = html.Div([
    html.H1("Budget Allocator"),

    # Input for total budget
    html.Label("Total Budget ($):"),
    dcc.Input(id="total-budget", type="number", value=5000, min=1000, step=500, style={"margin-bottom": "20px"}),

    # Input for number of categories
    html.Label("Number of Categories:"),
    dcc.Input(id="num-categories", type="number", value=3, min=1, style={"margin-bottom": "20px"}),

    # Placeholder for dynamically generated sliders
    html.Div(id="sliders-container", style={"margin-bottom": "20px"}),

    # Summary of allocation
    html.H3("Allocation Summary"),
    html.Div(id="summary-output"),
])

# Callback to generate sliders dynamically based on the number of categories
@app.callback(
    Output("sliders-container", "children"),
    [Input("num-categories", "value"), Input("total-budget", "value")]
)
def create_sliders(num_categories, total_budget):
    sliders = []
    for i in range(num_categories):
        slider = html.Div([
            html.Label(f"Category {i + 1} Allocation"),
            dcc.Slider(
                id={'type': 'category-slider', 'index': i},
                min=0, max=total_budget, value=total_budget // num_categories,
                marks={0: "0", total_budget: str(total_budget)}
            )
        ], style={"margin-bottom": "20px"})
        sliders.append(slider)
    return sliders

# Callback to update allocation summary based on slider values
@app.callback(
    Output("summary-output", "children"),
    Input("total-budget", "value"),
    Input({'type': 'category-slider', 'index': ALL}, 'value')
)
def update_summary(total_budget, allocations):
    total_allocated = sum(allocations)
    remaining_budget = total_budget - total_allocated

    summary = [
        html.P(f"Total Allocated: ${total_allocated}"),
        html.P(f"Remaining Budget: ${remaining_budget}")
    ]

    if total_allocated > total_budget:
        summary.append(html.Div("You have exceeded the total budget!", style={"color": "red"}))
    elif remaining_budget < total_budget * 0.1:
        summary.append(html.Div("Warning: You are nearing your total budget.", style={"color": "orange"}))
    else:
        summary.append(html.Div("You are within the budget.", style={"color": "green"}))

    return summary

# Run the app
if __name__ == "__main__":
    app.run_server(debug=True)
Example case: Dash

- ✅ Dynamic UI relying on data/states
- ✅ Complex data dependencies
Data uploader and visualizer
Data uploader and visualizer
import streamlit as st
import pandas as pd

st.title("Upload and Visualize CSV Data with Streamlit")

# File uploader for CSV
uploaded_file = st.file_uploader("Choose a CSV file", type="csv")

# Display the visualization if the file is uploaded
if uploaded_file:
    data = pd.read_csv(uploaded_file)
    st.write("Data Preview:")
    st.write(data.head())

    st.line_chart(data, x="Date", y="Stock Price")
- Reactive: Update the chart reacting the input data
- Conditional: show the chart only when the file has been uploaded
without callbacks/imperative code!
Example case: Dash
import dash
from dash import dcc, html
from dash.dependencies import Input, Output, State
import pandas as pd
import base64
import io

# Initialize the Dash app
app = dash.Dash(__name__)

app.layout = html.Div([
    html.H1("Upload and Visualize CSV Data with Dash"),

    # File upload component that accepts only CSV files
    dcc.Upload(
        id='upload-data',
        children=html.Button('Upload CSV'),
        accept='.csv',  # Accept only CSV files
        multiple=False
    ),

    # Placeholders for the data preview and chart
    html.Div(id='output-data-upload'),
    dcc.Graph(id='data-graph')
])

# Callback to parse the uploaded CSV and update the output
@app.callback(
    [Output('output-data-upload', 'children'), Output('data-graph', 'figure')],
    [Input('upload-data', 'contents')],
    [State('upload-data', 'filename')]
)
def update_output(contents, filename):
    if contents is None:
        return None, {}

    # Decode and parse the file
    content_type, content_string = contents.split(',')
    decoded = base64.b64decode(content_string)
    df = pd.read_csv(io.StringIO(decoded.decode('utf-8')))

    # Ensure the columns for Date and Stock Price exist
    if 'Date' not in df.columns or 'Stock Price' not in df.columns:
        return html.Div(["Error: CSV must contain 'Date' and 'Stock Price' columns."]), {}

    # Convert Date column to datetime for accurate plotting
    df['Date'] = pd.to_datetime(df['Date'])

    # Data preview
    preview = html.Div([
        html.H5(f"Uploaded File: {filename}"),
        html.P("Data Preview:"),
        html.Table([
            html.Tr([html.Th(col) for col in df.columns])] +
            [html.Tr([html.Td(df.iloc[i][col]) for col in df.columns]) for i in range(min(len(df), 5))])
    ])

    # Define the figure with specified columns
    fig = {
        'data': [{
            'x': df['Date'],
            'y': df['Stock Price'],
            'type': 'line',
            'name': 'Stock Price'
        }],
        'layout': {
            'title': 'Uploaded Data Visualization',
            'xaxis': {'title': 'Date'},
            'yaxis': {'title': 'Stock Price'}
        }
    }

    return preview, fig

# Run the app
if __name__ == '__main__':
    app.run_server(debug=True)

- ✅ Conditional UI
-
✅ Data visualization: No need to take care of
- Visualization framework
- Data transportation (JSON/Protobuf/...)
Dashboard
Dashboard
# Get data# Call line_chart()# Loopimport streamlit as st
import time
from collections import deque
from data_source import get_stock_data
st.title("Data Streaming Dashboard")
max_rows = 100
stock_data = deque(maxlen=max_rows)
chart = st.empty()
while True:
timestamp, price = get_stock_data()
stock_data.append((timestamp, price))
timestamps, prices = zip(*stock_data)
chart.line_chart({"timestamp": timestamps, "price": prices}, x="timestamp", y="price")
time.sleep(0.01)
Large-scale dashboard
Large-scale dashboard
# For each chart,# Get data and
# call line_chart()# Loopimport streamlit as st
import time
from collections import deque
from data_source import get_stock_data
...
st.title(f"Data Streaming Dashboard ({NUM_ROWS}x{NUM_COLUMNS})")
tickers = [f'TICKER{i+1}' for i in range(MAX_TICKERS)]
stock_data = {ticker: deque(maxlen=MAX_ROWS) for ticker in tickers}
rows = [st.columns(NUM_COLUMNS) for _ in range(NUM_ROWS)]
charts = {}
for i, ticker in enumerate(tickers):
row = i // NUM_COLUMNS
col = i % NUM_COLUMNS
charts[ticker] = rows[row][col].empty()
while True:
for ticker in tickers:
timestamp, price = get_stock_data(ticker)
stock_data[ticker].append((timestamp, price))
timestamps, prices = zip(*stock_data[ticker])
charts[ticker].line_chart({"timestamp": timestamps, "price": prices}, x="timestamp", y="price")
time.sleep(0.01)
Large-scale dashboard
Performance 🤔
And...
Polling vs Event-driven
✅Easy
🚨Inefficient, not precise
✅Efficient, precise
🚨Complex
while True:
    data = get_data()
    show_data(data)
def on_update(data):
show_data(data)
data_source.subscribe(on_update)Event-driven dashboards
Event listener👍
Queue()🤔Can't get rid of the loop😭
import streamlit as st
from collections import deque
from queue import Queue
from event_dispatcher import data_source

st.title("Data Streaming Dashboard (Event-driven)")

max_rows = 100
stock_data = deque(maxlen=max_rows)

chart = st.empty()

q = Queue()

def on_update(timestamp, price):
    q.put((timestamp, price))

data_source.subscribe(on_update)

while True:
    timestamp, price = q.get()

    stock_data.append((timestamp, price))

    timestamps, prices = zip(*stock_data)

    chart.line_chart({"timestamp": timestamps, "price": prices}, x="timestamp", y="price")
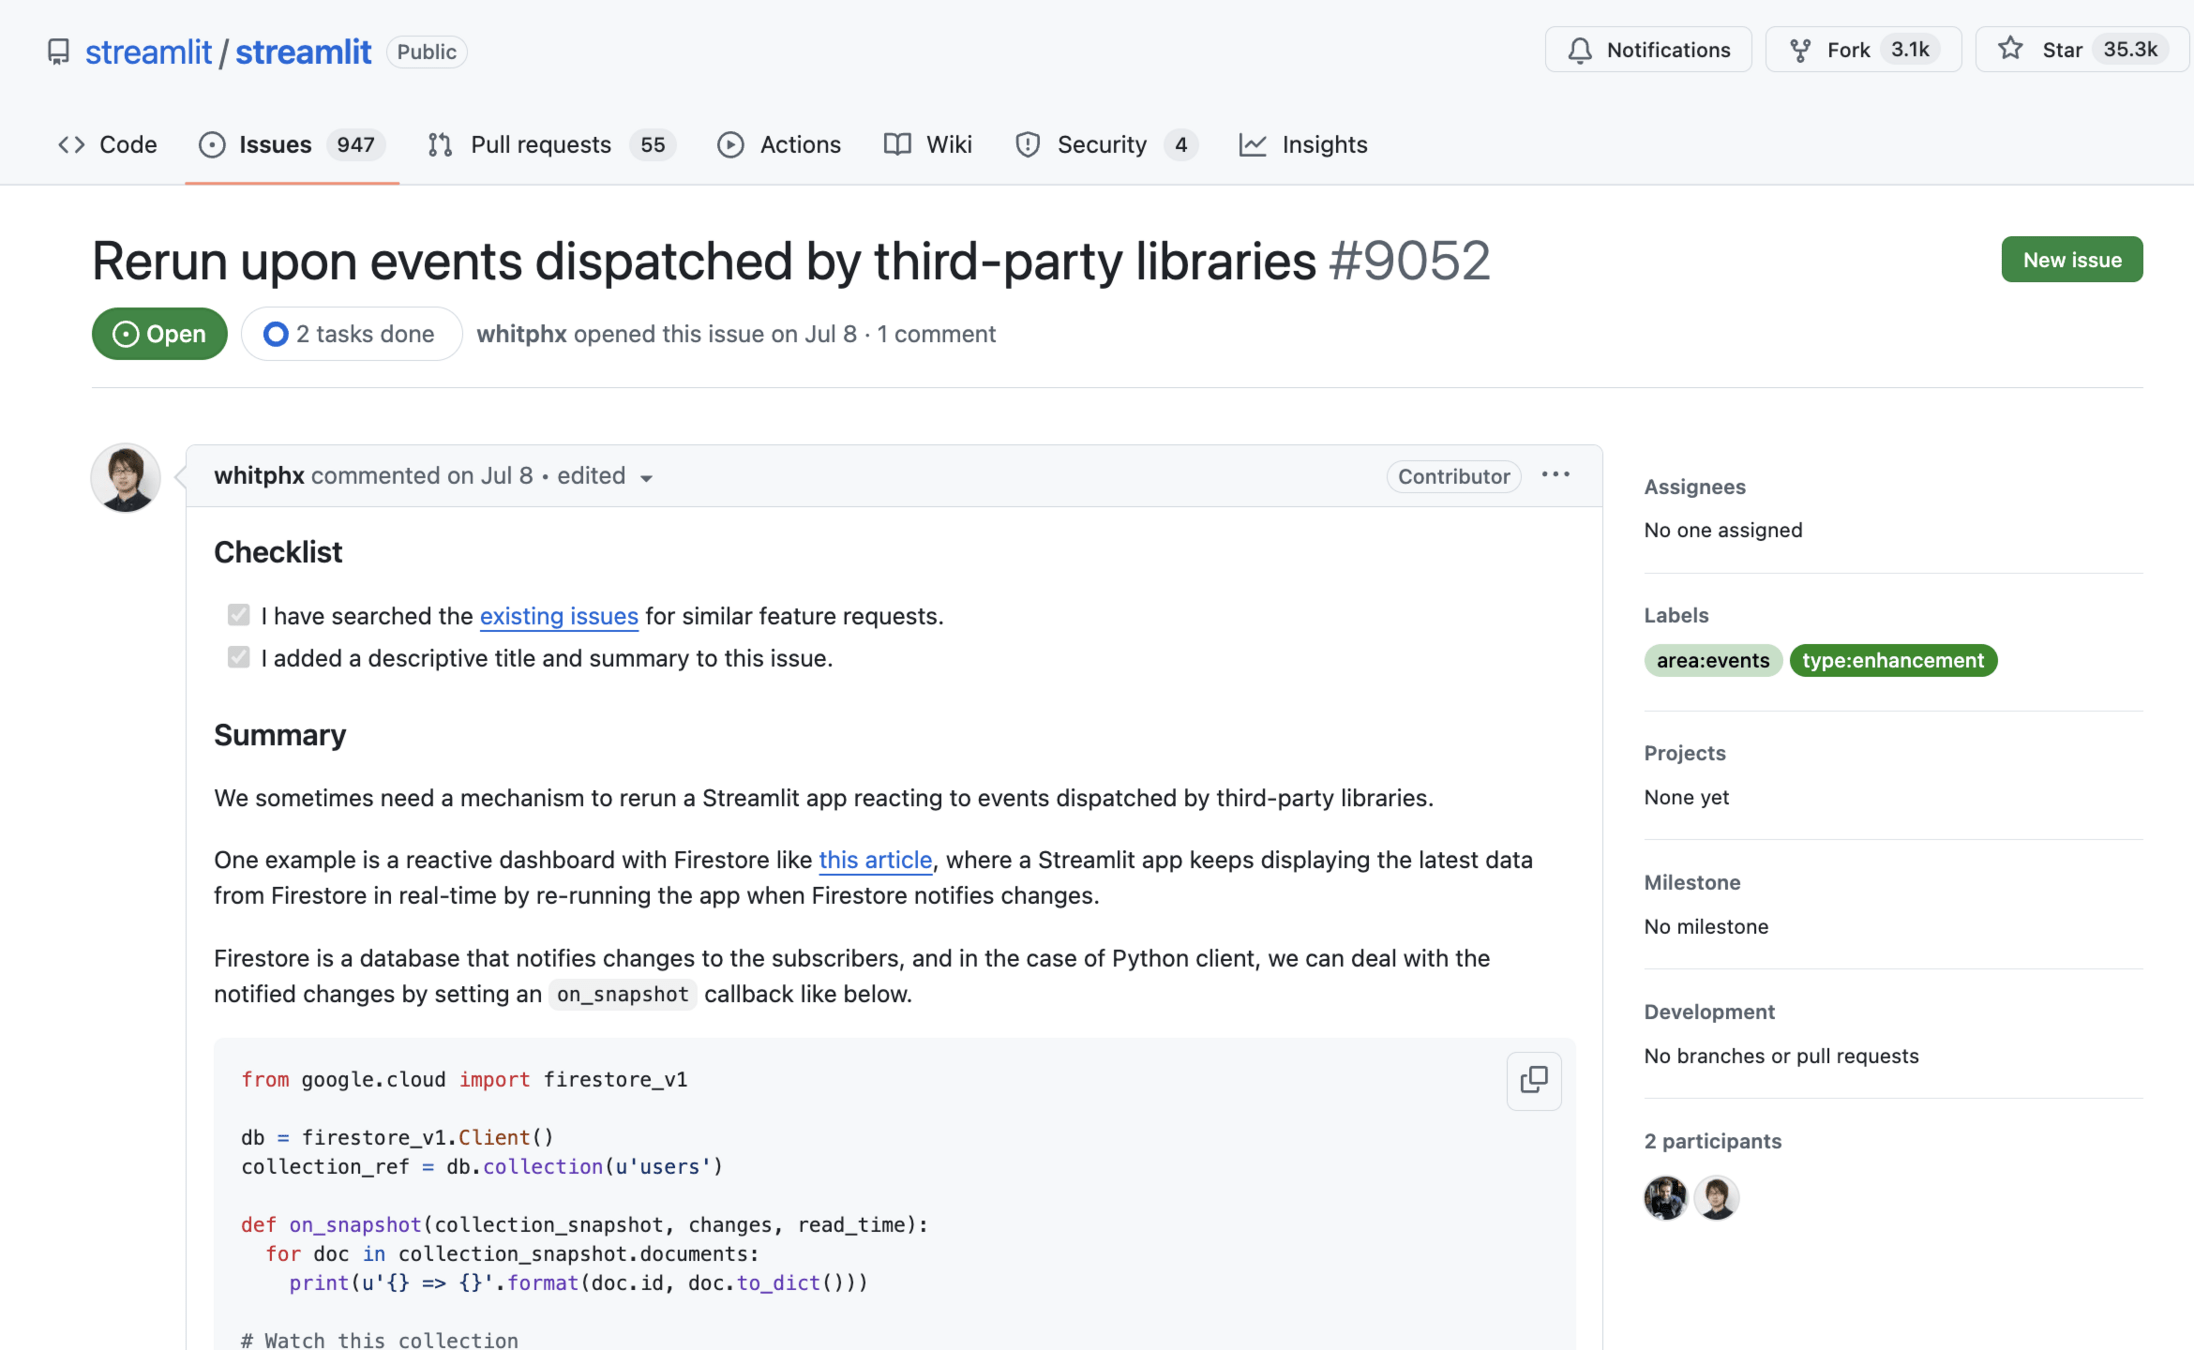
Streamlit is not intuitive when event-driven
def on_update(new_data):
    ...
    st.line_chart(data_to_display)

data_source.subscribe(on_update)
Streamlit can't do this🚨
Revisit:
Top-to-Bottom execution
import streamlit as st
from event_dispatcher import data_source

st.title("Data Streaming Dashboard")

def on_update(new_data):
    data_to_display = ...
    st.line_chart(data_to_display)

data_source.subscribe(on_update)
The callback function is
called in another thread that is outside of Streamlit's control.
- ✅ Live-updated UI
- 🚨 High-frequency updates
- 🚨 Event-driven code
More examples:
Tailor-made Frontend


Function-centric apps
e.g. AI/ML demos
def your_awesome_logic(arg1, arg2, ...):
    # your awesome logic here
    return res1, res2, ...
When you want the WebUI to use a function...
Function-centric apps
e.g. AI/ML demos
Streamlit fits perfectly,
but another might give a better abstraction.
import gradio as gr

# Core logic function
def process_data(number, text):
    transformed_number = number * 2
    uppercased_text = text.upper()
    return transformed_number, uppercased_text

# Create and launch Gradio Interface
demo = gr.Interface(
    fn=process_data,
    inputs=[
        gr.Number(label="Enter a number"),
        gr.Textbox(label="Enter some text"),
    ],
    outputs=[
        gr.Textbox(label="Transformed Number"),
        gr.Textbox(label="Uppercased Text")
    ],
    title="Data Processor",
)

demo.launch()
import streamlit as st

# Core logic function
def process_data(number, text):
    transformed_number = number * 2
    uppercased_text = text.upper()
    return transformed_number, uppercased_text

# Streamlit UI setup
st.title("Data Processor")

# Input fields
number = st.number_input("Enter a number:", value=1)
text = st.text_input("Enter some text:")

# Button to execute the function
if st.button("Process"):
    # Call the core function with user inputs
    transformed_number, uppercased_text = process_data(number, text)

    # Display the outputs
    st.write("Transformed Number:", transformed_number)
    st.write("Uppercased Text:", uppercased_text)
Function-centric apps
e.g. AI/ML demos


Streamlit fits perfectly,
but another might give a better abstraction.
Cross-user Interaction
Session
Session
Session
Isolated
Isolated
e.g. multi-user chat
💥
💥
Scaling up/out
Streamlit's server is difficult to scale up/out
Thread
Per-user WebSocket connection
→Difficult to load balancing/scale-out
No option to use multi cores
→Difficult to scale-up
Thread
Thread
High traffic apps
Subtitle
Wrap-up
Streamlit is a very good WebUI framework,
but it's not the silver bullet.
- It simplifies the development of interactive web UI based on Python logic,
with its unique execution model and pre-built components and themes. - It may not be suitable in some cases;
large systems, event-driven data source, high traffic apps, etc. - Different technologies may be more appropriate for your case.
Choose the right one based on a clear understanding of these tech stacks.
Happy Streamlit-ing!

Bonus: LLM-friendliness
Streamlit
- has stable API
- has large amount of user code
What Streamlit can and can't (or shouldn't) do
By whitphx


