
The thing about D3 is...
It isn't a visualisation library
What is it?
- One-way data binding
- Excels at transition states
- Provides lots of helpers for visualisations
How to use it
var figures = [
  { "name": "Triangle", "numPoints": 3, "perimeterRatio": 4.55 },
  { "name": "Square", "numPoints": 4, "perimeterRatio": 4 },
  { "name": "Pentagon", "numPoints": 5, "perimeterRatio": 3.81 },
  { "name": "Hexagon", "numPoints": 6, "perimeterRatio": 3.72 }
];
<!DOCTYPE html>
<html>
<head>
<meta charset="utf-8">
<title>JS Bin</title>
</head>
<body>
<script src="http://d3js.org/d3.v3.min.js"></script>
<div id="chart"></div>
</body>
</html>d3.select("#chart")
.selectAll("div")
.data(figures)
.enter()
.append("div")
.text(function(d) { return d.name; })
.style('background', 'red')
.style('width', function(d) { return (20*d.numPoints)+ "px" });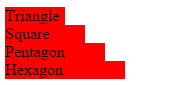
D3
By xwipeoutx