Profiling

Profiling
Concerns
-
Tracking Memory Leaks
-
Improve Application Performance
Profiling
Begin with an Object
object [ key ] = value ;
String only
Any variable type
Profiling
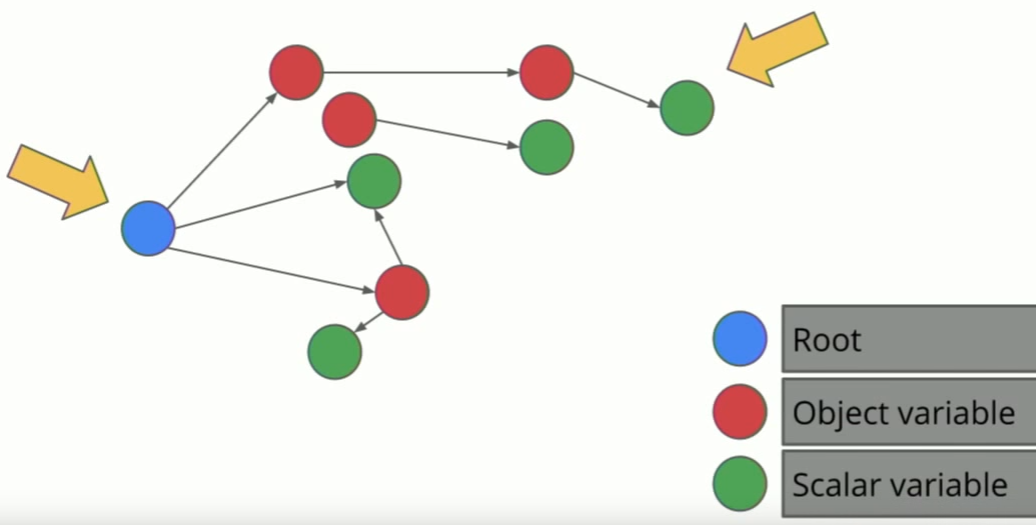
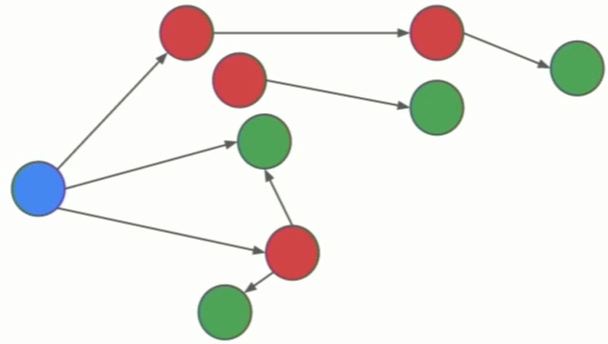
The Object Graph
Profiling
An Object's size
-
Shallow
Two sizes
-
The Object itself
-
Usually a small constant footprint
-
Retained
-
The sum of shallow size of all decendents
Profiling
An Object's retaining tree
Profiling
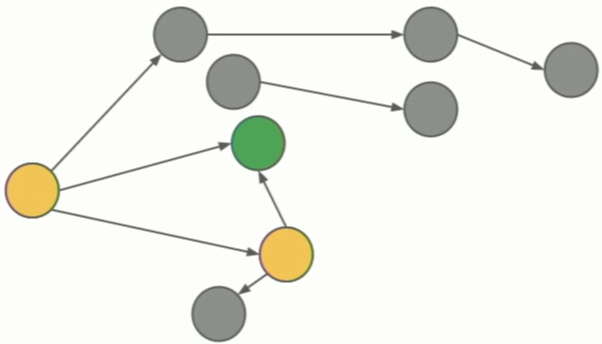
What is considered as Garbage?
All variables which cannot be reached from the root node
Profiling
Garbage Collection
-
Find all garbage
-
Return memory used by garbage variables to the system
Mark & Sweep
Profiling
The cost of allocating memory
-
Scoops memory from the "young" memory pool
-
This is cheap & fast until this pool runs out of memory
- Runtime then forced to perform a garbage collection
which can lead to clunky performance...
Every call to new
Be careful with creating new objects.
-
Mind new objects creation patterns
-
Mind how long you hold on to them
Profiling
Managed Memory - Summary
Allocations are cheap & fast until
the "young" pool runs out of memory
All variables are part of the object graph
Objects have two sizes
-
Shallow (self)
-
Retained (self+descendents)
All variables that cannot be reached from the root are garbage
Runtime is then forced to perform a garbage collection
which can lead to clunky performance...
Profiling
Memory Profiling Tools

Profiling
Comercial Tools


Free during development for debugging
License is required to run in production
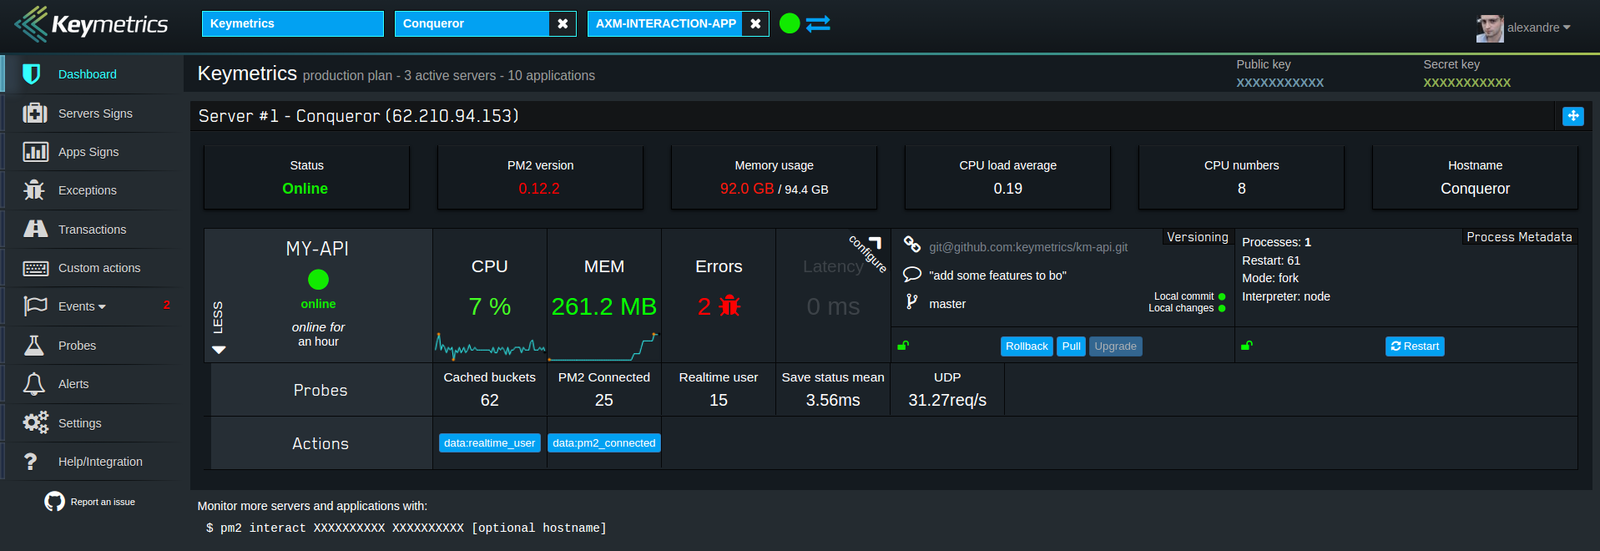
Profiling
Comercial Tools
Free open source PM2 package
License is required for dashboards

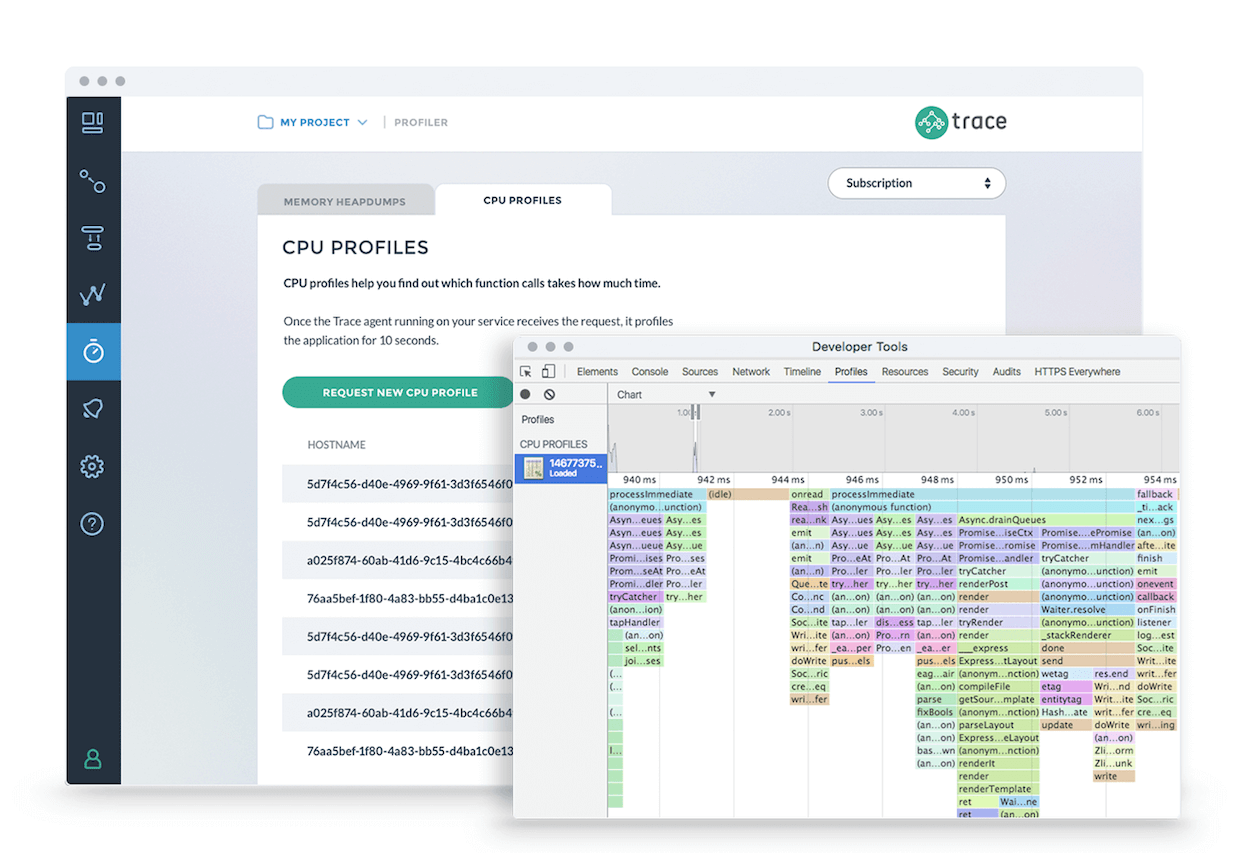
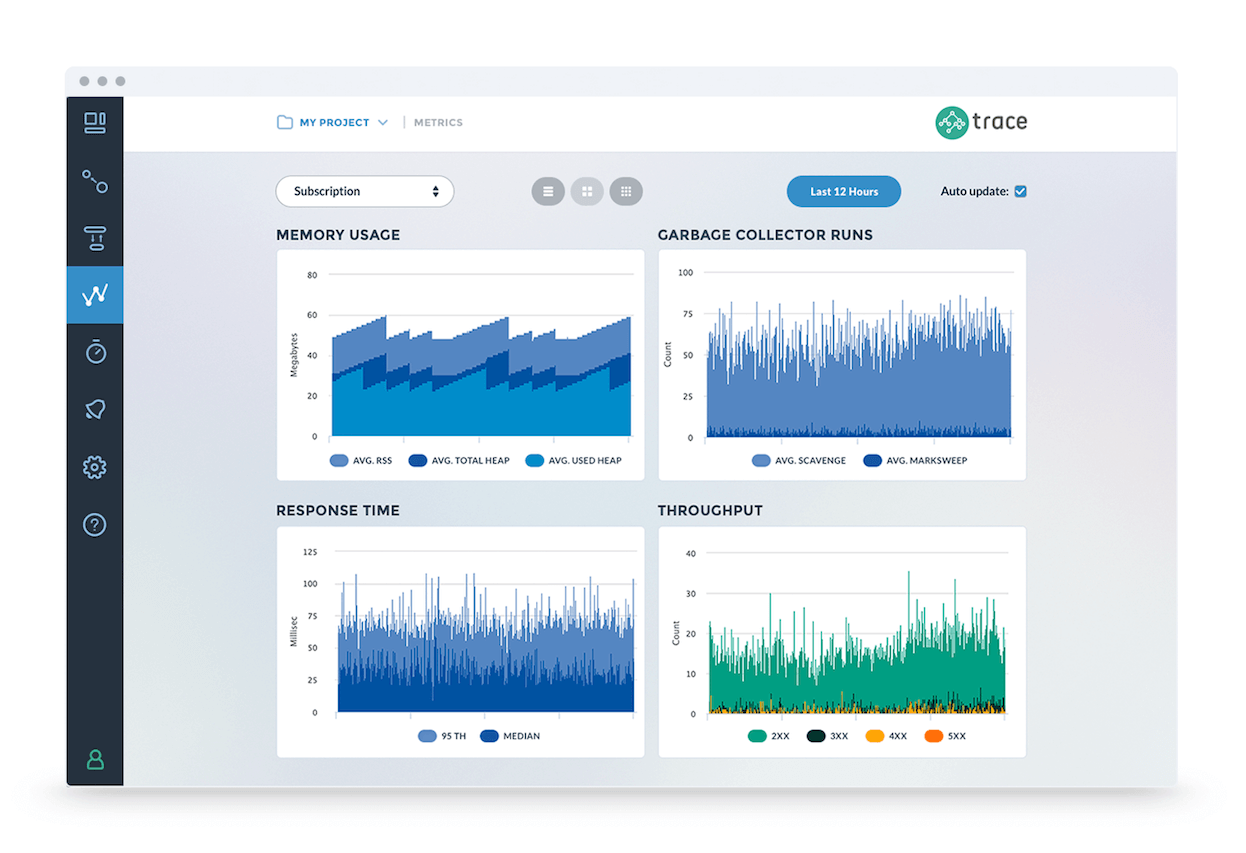
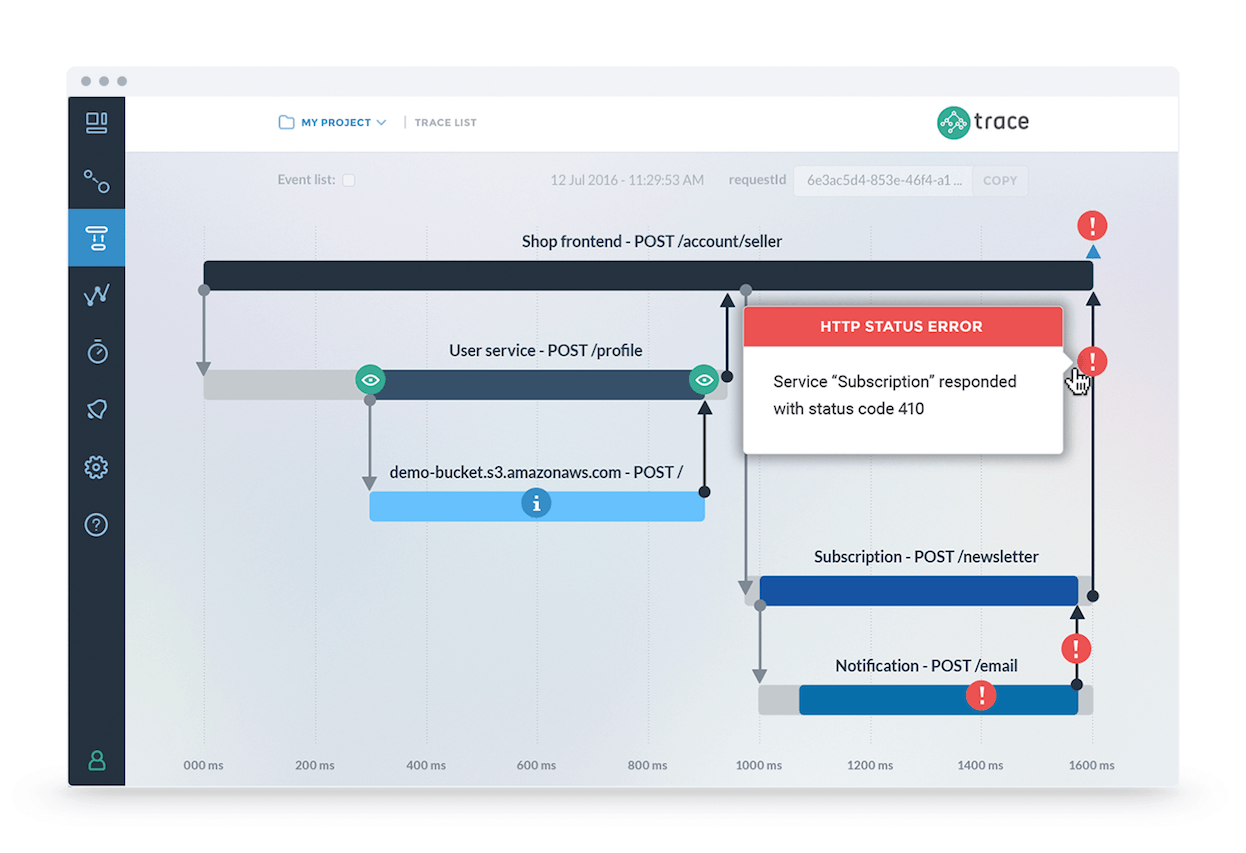
Profiling
Comercial Tools
by Rising stack
Has a free tier

Profiling
Time Api requests
Available as built-in or 3rd-party middleware


Profiling
Bash command tools
- Linux perf events
- node --prof flag
- Apache Benchmark - ab
- Dtrace
- Flame Graphs
- Joyent mdb
- gcore - generates core dumps in production
Watch this for further information
Runtime Performance Workflow
- Sample stack traces via perf
- Visualize code distribution with CPU flame graphs
- Identify performance issues...
Profiling
Use Chrome Devtools
All tabs available including: Sources / Timeline / Profiling

A debugger interface for Node.js applications
uses the Blink Developer Tools (formerly WebKit Web Inspector). sponsored by IBM StrongLoop.
Profiling
Use Chrome Devtools
All tabs available including: Sources / Timeline / Profiling
Runs Node.js programs inside Chrome DevTools
(using Electron to blend Node.js and Chromium features).
Read this blog post
Comparison to node-inspector


Profiling
Devtools profiling workflow
- Make assumptions regarding suspicious actions in your code that may be causing memory leaks
-
Inspect and validate those suspicions in the memory timeline tab
-
Capture two or more Heap snapshots
-
The snapshots capture objects graph
-
Don’t capture scalar values in the object graph
- Compare two or more snapshots to find leaks
-
Use both Summery & Comparison views of the profiles tab
Profiling
Devtools profiling tips
-
Ignore parentheses
-
Ignore dimmed
-
Garbage is collected before each snapshot is taken
-
Test using incognito mode
to avoid extensions code included in your snapshots... -
Focus on the signal
Profiling
Closures memory leaks example
Help the GC out by assigning null to closure variables.
 let closureVar = {};

 doWork(function callback() {

    let data = closureVar.usefulData;

    // Do a bunch of work...
    // Do a bunch of work...
    // Do a bunch of work...

    data = null;

 });
Profiling
What is wrong with this code?
let theThing = null;

let replaceThing = function () {

  let originalThing = theThing;

  let unused = function () {
    if (originalThing)
      console.log("hi");
  };

  theThing = {
    longStr: new Array(1000000).join('*'),
    someMethod: function () {
      console.log('someMessage...');
    }
  };
};

setInterval(replaceThing, 1000);
Profiling
let theThing = null;

let replaceThing = function () {
  let originalThing = theThing;

  // Define a closure that references originalThing but doesn't ever actually
  // get called. But because this closure exists, originalThing will be in the
  // lexical environment for all closures defined in replaceThing, instead of
  // being optimized out of it. If you remove this function, there is no leak.
  let unused = function () {
    if (originalThing)
      console.log("hi");
  };
  theThing = {
    longStr: new Array(1000000).join('*'),

    // While originalThing is theoretically accessible by this function, it
    // obviously doesn't use it. But because originalThing is part of the
    // lexical environment, someMethod will hold a reference to originalThing,
    // and so even though we are replacing theThing with something that has no
    // effective way to reference the old value of theThing, the old value
    // will never get cleaned up!
    someMethod: function () {
      console.log('someMessage...');
    }
  };
  // If you add `originalThing = null` here, there is no leak.
};
setInterval(replaceThing, 1000);
Profiling JavaScript Applications
By Yariv Gilad


