Frontend Performance
- Why
- What
- How
- Speedcurve demo
Frontend Performance
Why
- User Experience
- SEO
- Conversion Rate
- 100ms longer to load -> 1% decline in revenue
- 500ms longer to load -> 20% less traffic
- 100ms longer to load -> 7% decline in CR
- Bounce Rate
- 160kb more data -> 12% higher BR
- 40% of users bounc if loading time longer than 3s
Frontend Performance
Why
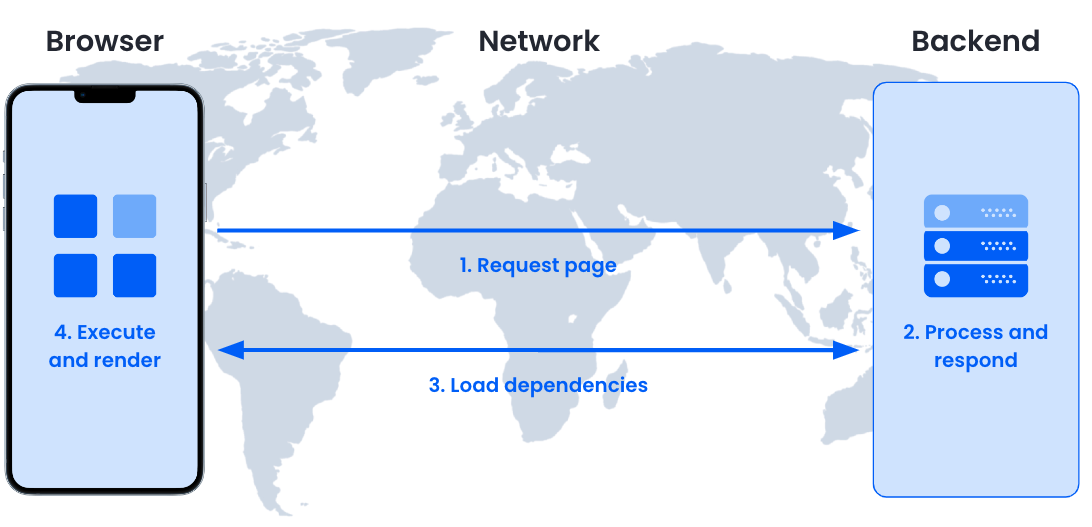
Frontend Performance
What
Frontend Performance
What
Frontend Performance
How
Frontend Performance
How
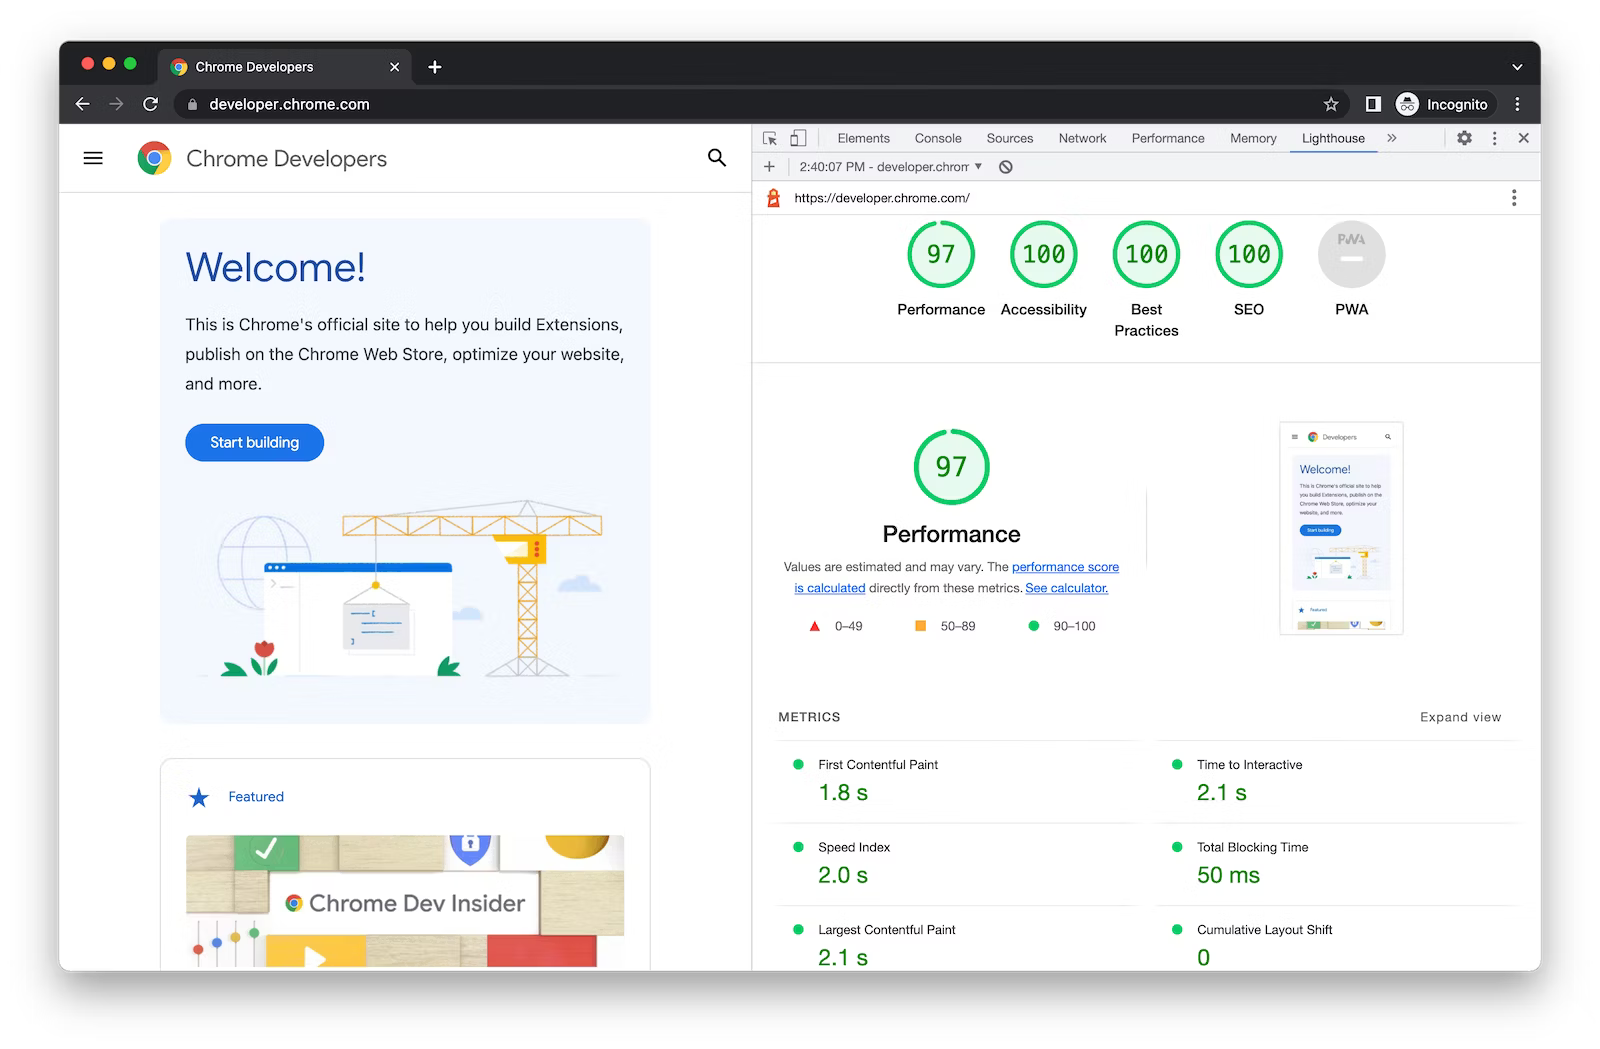
Lighthouse
Frontend Performance
How
Lighthouse
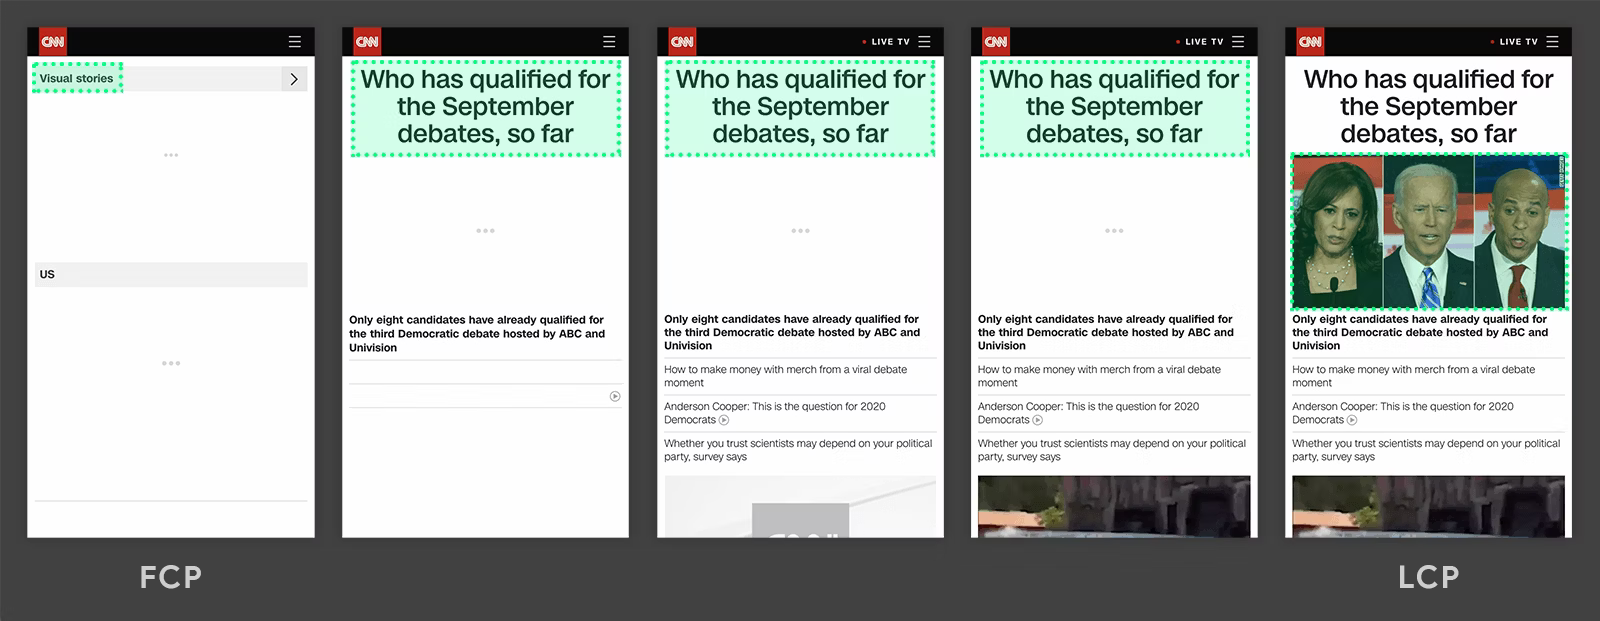
- LCP: Largest Contentful Paint
- CLS: Cumulative Layout Shift
- TBT: Total Blocking Time
- FCP: First Contentful Paint
- TTI: Time To Interactive
- SI: Speedindex
Frontend Performance
How
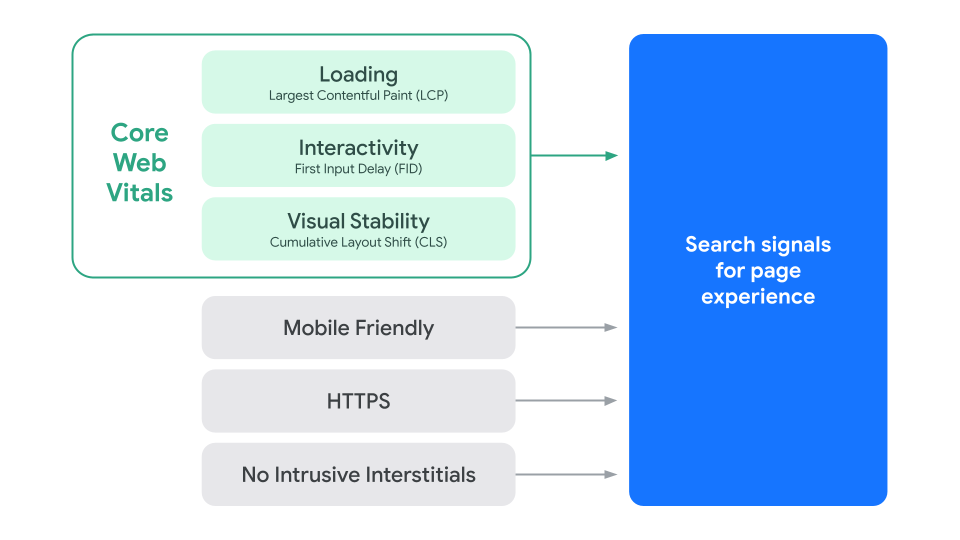
Core Web Vitals
- LCP: Largest Contentful Paint
- CLS: Cumulative Layout Shift
- FID: First Input Delay ( < 2024 )
- [INP: Interaction To Next Paint ( > 2024 )]
Frontend Performance
How
LCP < 2.5s
Frontend Performance
How
CLS < 0.1
Frontend Performance
How
FID < 100ms

Frontend Performance
How
Frontend Performance
How
Test
- Lighthouse: Browser
- Vitals: https://pagespeed.web.dev/
- CrUX Exploration: https://treo.sh/sitespeed
Frontend Performance
Speedcurve
Frontend Performance
Speedcurve
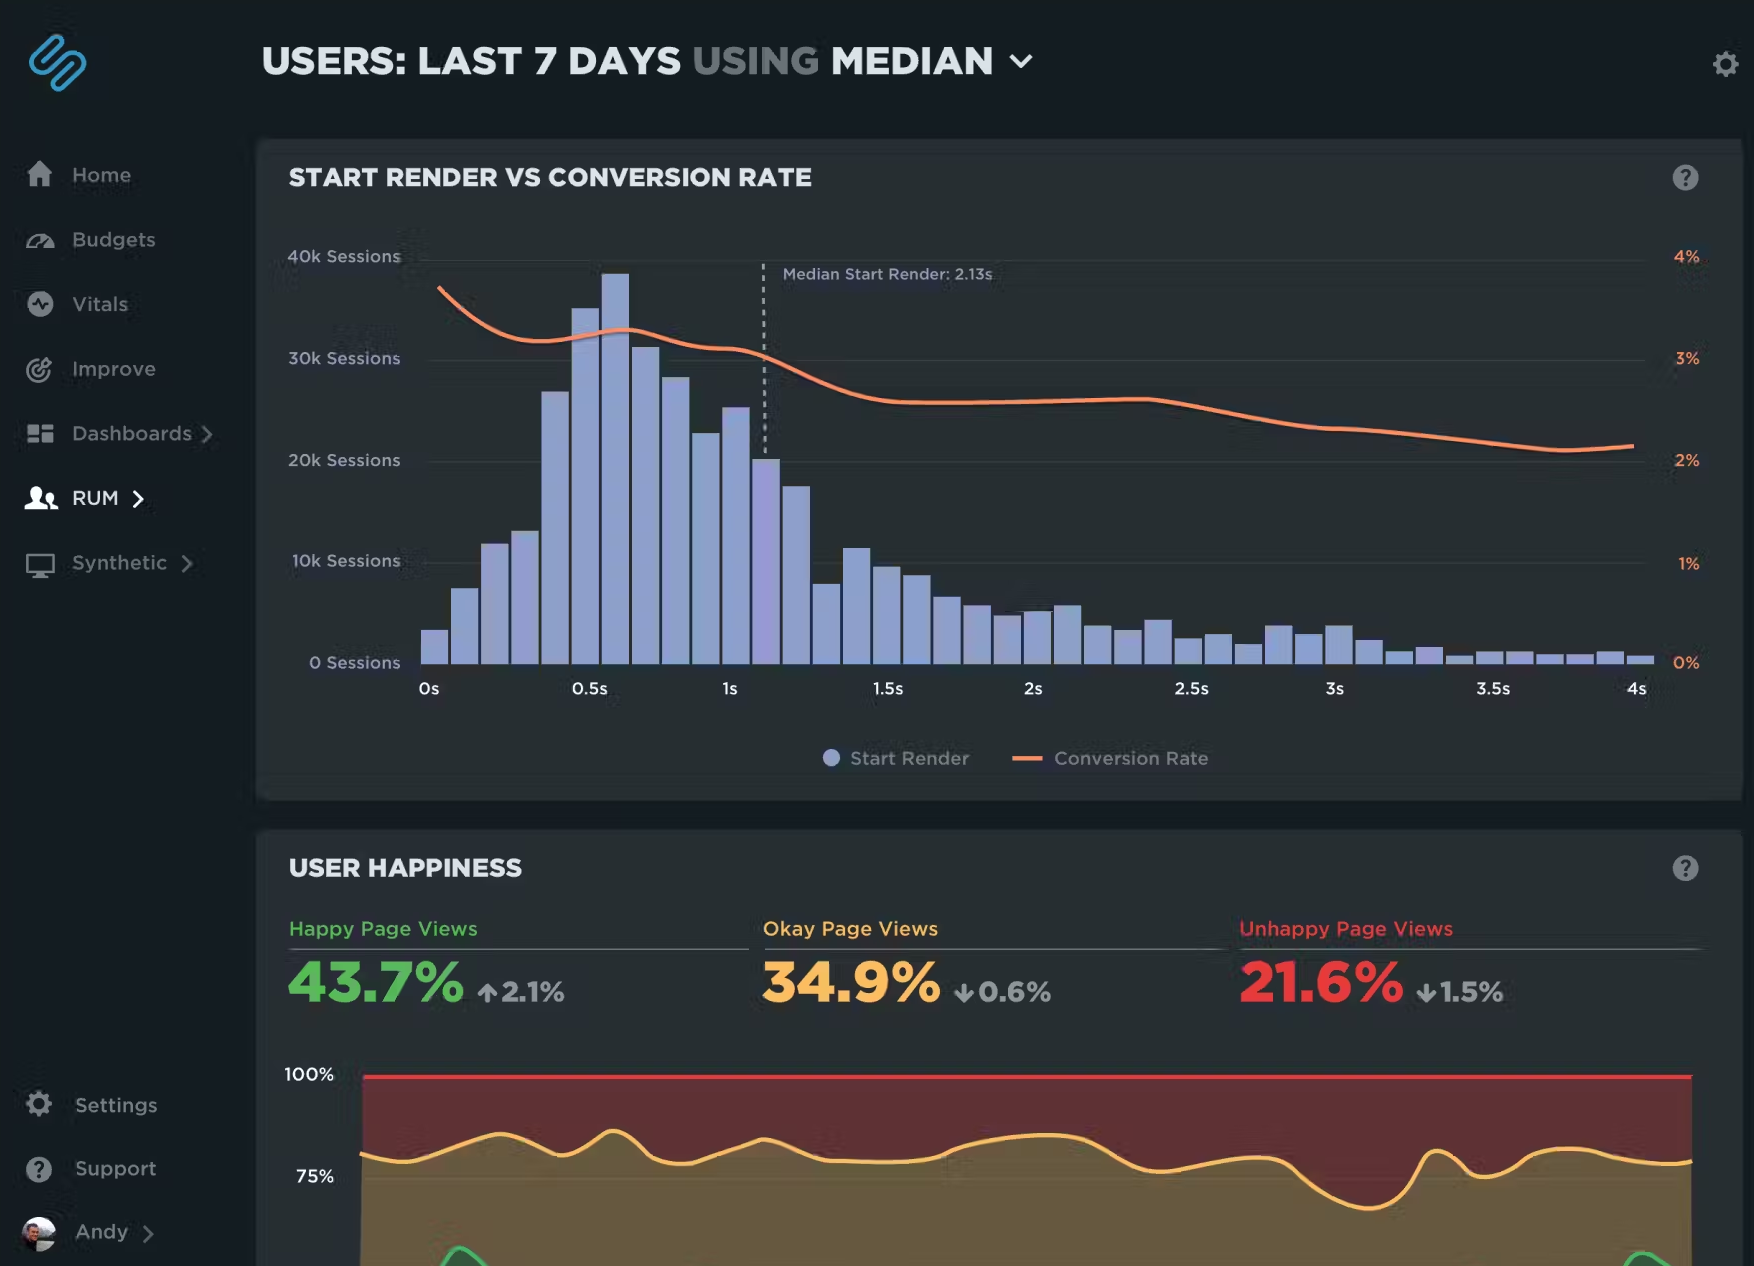
Frontend Performance
Speedcurve
- Measure & Monitor
- Synthetic Test
- RUM
- Visualisations
- Alerts
- Custom Metrics
- ...
Frontend Performance
What's next
Frontend Performance
What's next
- Improve -> Implement -> Measure
- Performance Budgets
- Custom Metrics
- RUM
Frontend Performance
By Yves Tscherry


