Adatvizualizáció
Matlabban
Plot + Linespec
http://www.mathworks.com/help/matlab/ref/linespec.html
- függvény grafikus képe: plot(x, y)
- grafikus tulajdonságok - egy sztringgel:
- görbe típusa: -, --, :, -.
- marker típusa: ., o, *, d, s, + stb.
- szín: r, g, b stb.
- példa: plot(x, y, '-or')
- grafikus tulajdonságok tulajdonságok/property-k segítségével megadva:
- LineWidth
- MarkerEdgeColor
- MarkerFaceColor
- MarkerSize
- példák:
- plot(x, y, '-ro', 'markerfacecolor', 'red')
- plot(x, y, '-ro', 'markerfacecolor', [1, 0.5, 1])
- h = plot (x, y, '-ro'); set(h, 'markerfacecolor', 'blue')
- axis - a tengelyekre vonatkozó tulajdonságok
- auto
- equal
- tight
- box
- on vagy off
- box/axes vonalvastagsága:
- set(gca, 'LineWidth', 2)
x = [0:0.5:20];
y = rand(1:length(x));
plot(x, y, '-or');
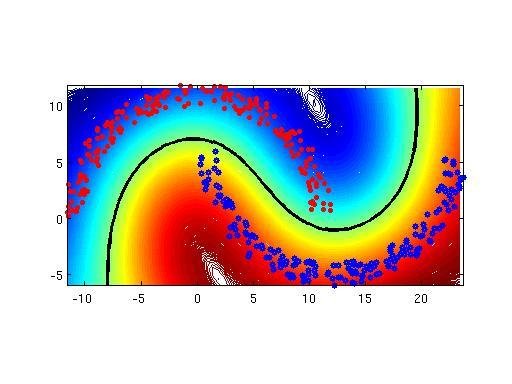
contour
- meshgrid
- pl.:
[X1,Y1] = meshgrid(xmin:d:xmax, ymin:d:ymax);
- pl.:
- reshape
- contour
- pl.:
contour(X1, Y1, reshape(f, size(X1)), 1000); - pl.2.:
contour(X1, Y1, reshape(f, size(X1)), [0 0], 'linewidth', 3, 'linecolor', [0,0,0]);
- pl.:
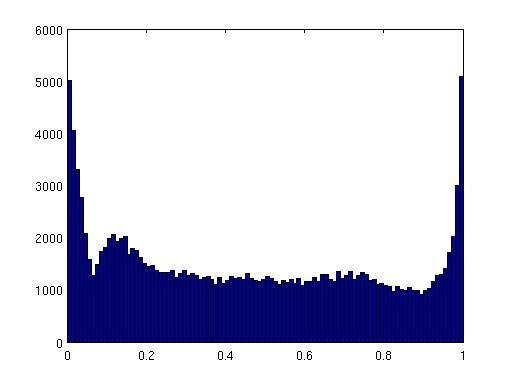
hist
- hisztogramok megjelenítése
- hist parancs:
- hist(x)
- hist(x, n)
- [counts, centers] = hist(x)
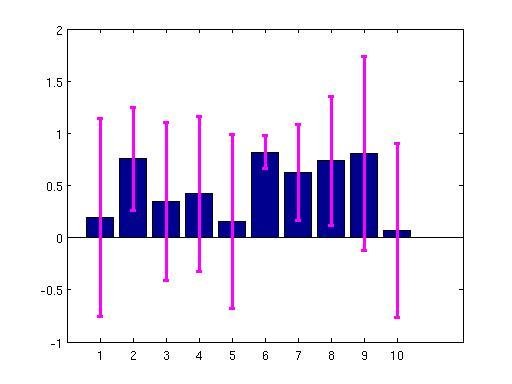
errorbar
- bar
- bar(x)
- errorbar
- errorbar(x, y)
- x - átlag
- y - szórás
- pl.: errorbar(X, Y, 'linestyle', 'none','linewidth', 3, 'color', [1 0 1]);
- errorbar(x, y)
- beállítások:
- oszlopszélesség:
h = bar(x); set(h, 'barwidth', 0.5);
- oszlopszélesség:
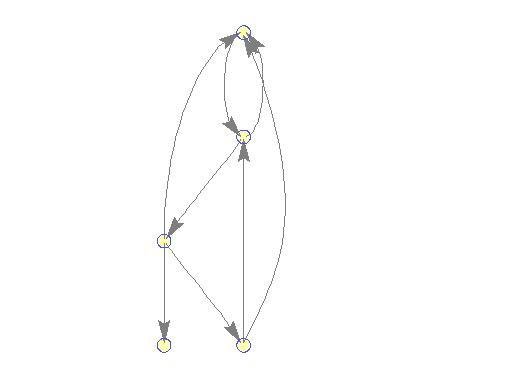
biograph
http://www.mathworks.com/help/bioinfo/ref/biographobject.html
- Bioinformatics Toolbox: biograph
- objektum létrehozása:
bg = biograph(A); %A - szomszédsági mátrix - megjelenítés: h = view(bg);
- megjelentési tulajdonságok beállítása:
- bg objektum: set(bg, 'tulajd', ertek)
- csomópont: set(h.Nodes, 'tulajd', ertek)
- él: set(h.Edges, 'tulajd', ertek)
- algoritmusok is futtathatók a létrehozott objektumon
Vége
AdatvizualizációMatlabban
By Zalan Bodo