Ryan Cooper | @maptastik
Sr. Systems Analyst/Programmer
City of Raleigh | Parks, Recreation and Cultural Resources
Analyzing Network Service Areas to Improve Park Access
Slides: bit.ly/ncaug2017
Presentation Structure
- Experience-Based Park Access Model
- Neighborhood & Community Connections
- Challenges and opportunities
How well does Raleigh's park system serve its population?
Measuring Level of Service
The conventional way
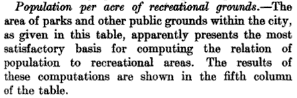
\sum Population / \sum Acres of Parks
1 mi
2 mi
3 mi...
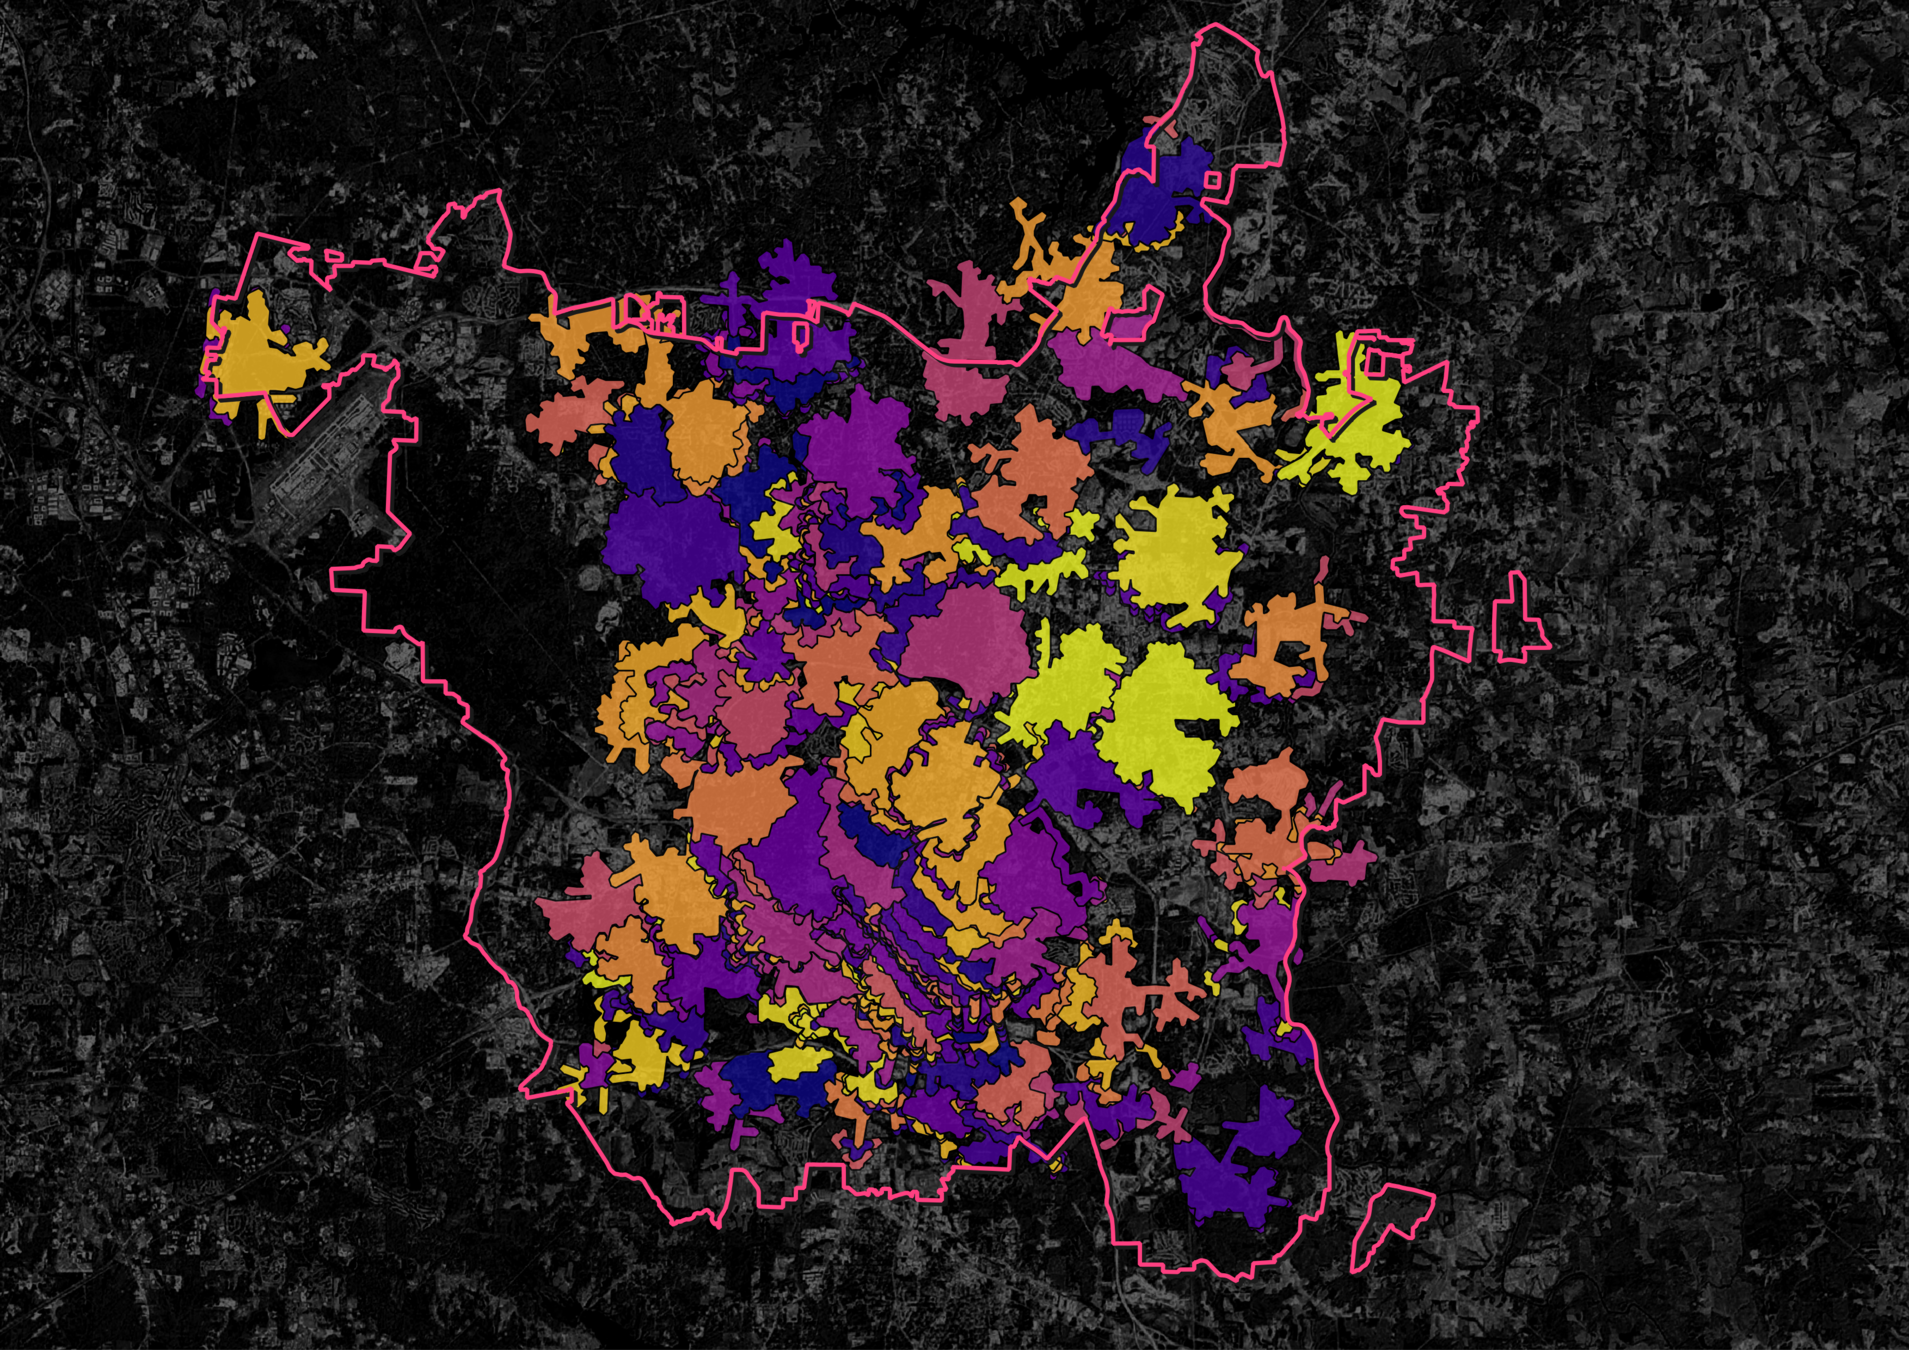
Euclidean Park Service Areas


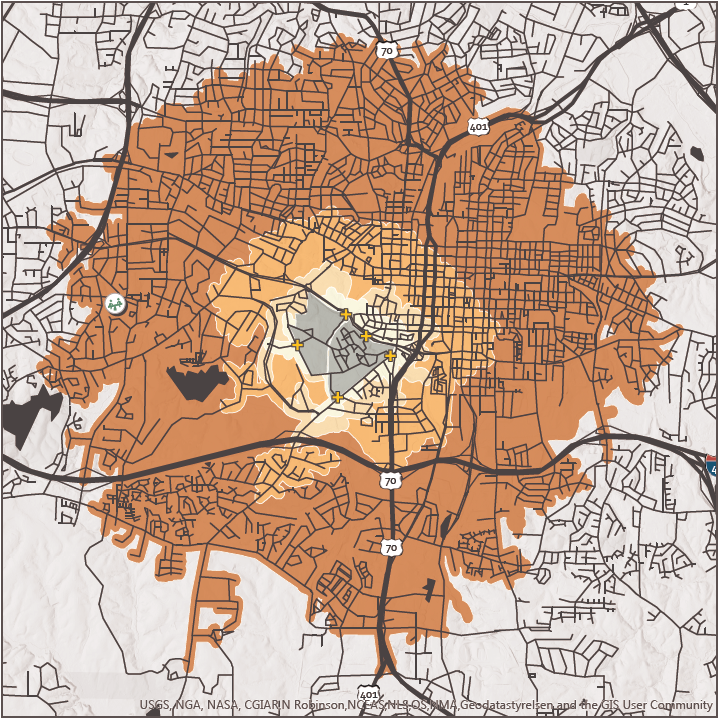
Network Park Service Areas
Experience-Based Park Access Model
Bringing people to parks
and
parks to people.
Experience
Access
Level of Service should consider:
- Experience
- Does the location provide a core experience?
- Opportunities for socializing
- Playground
- Open play
- Walking or riding a bike
- Does the location provide a core experience?
- Access
- How far are citizens from core experiences and how can they access them?
- Network access
- Local variations in access to park experiences
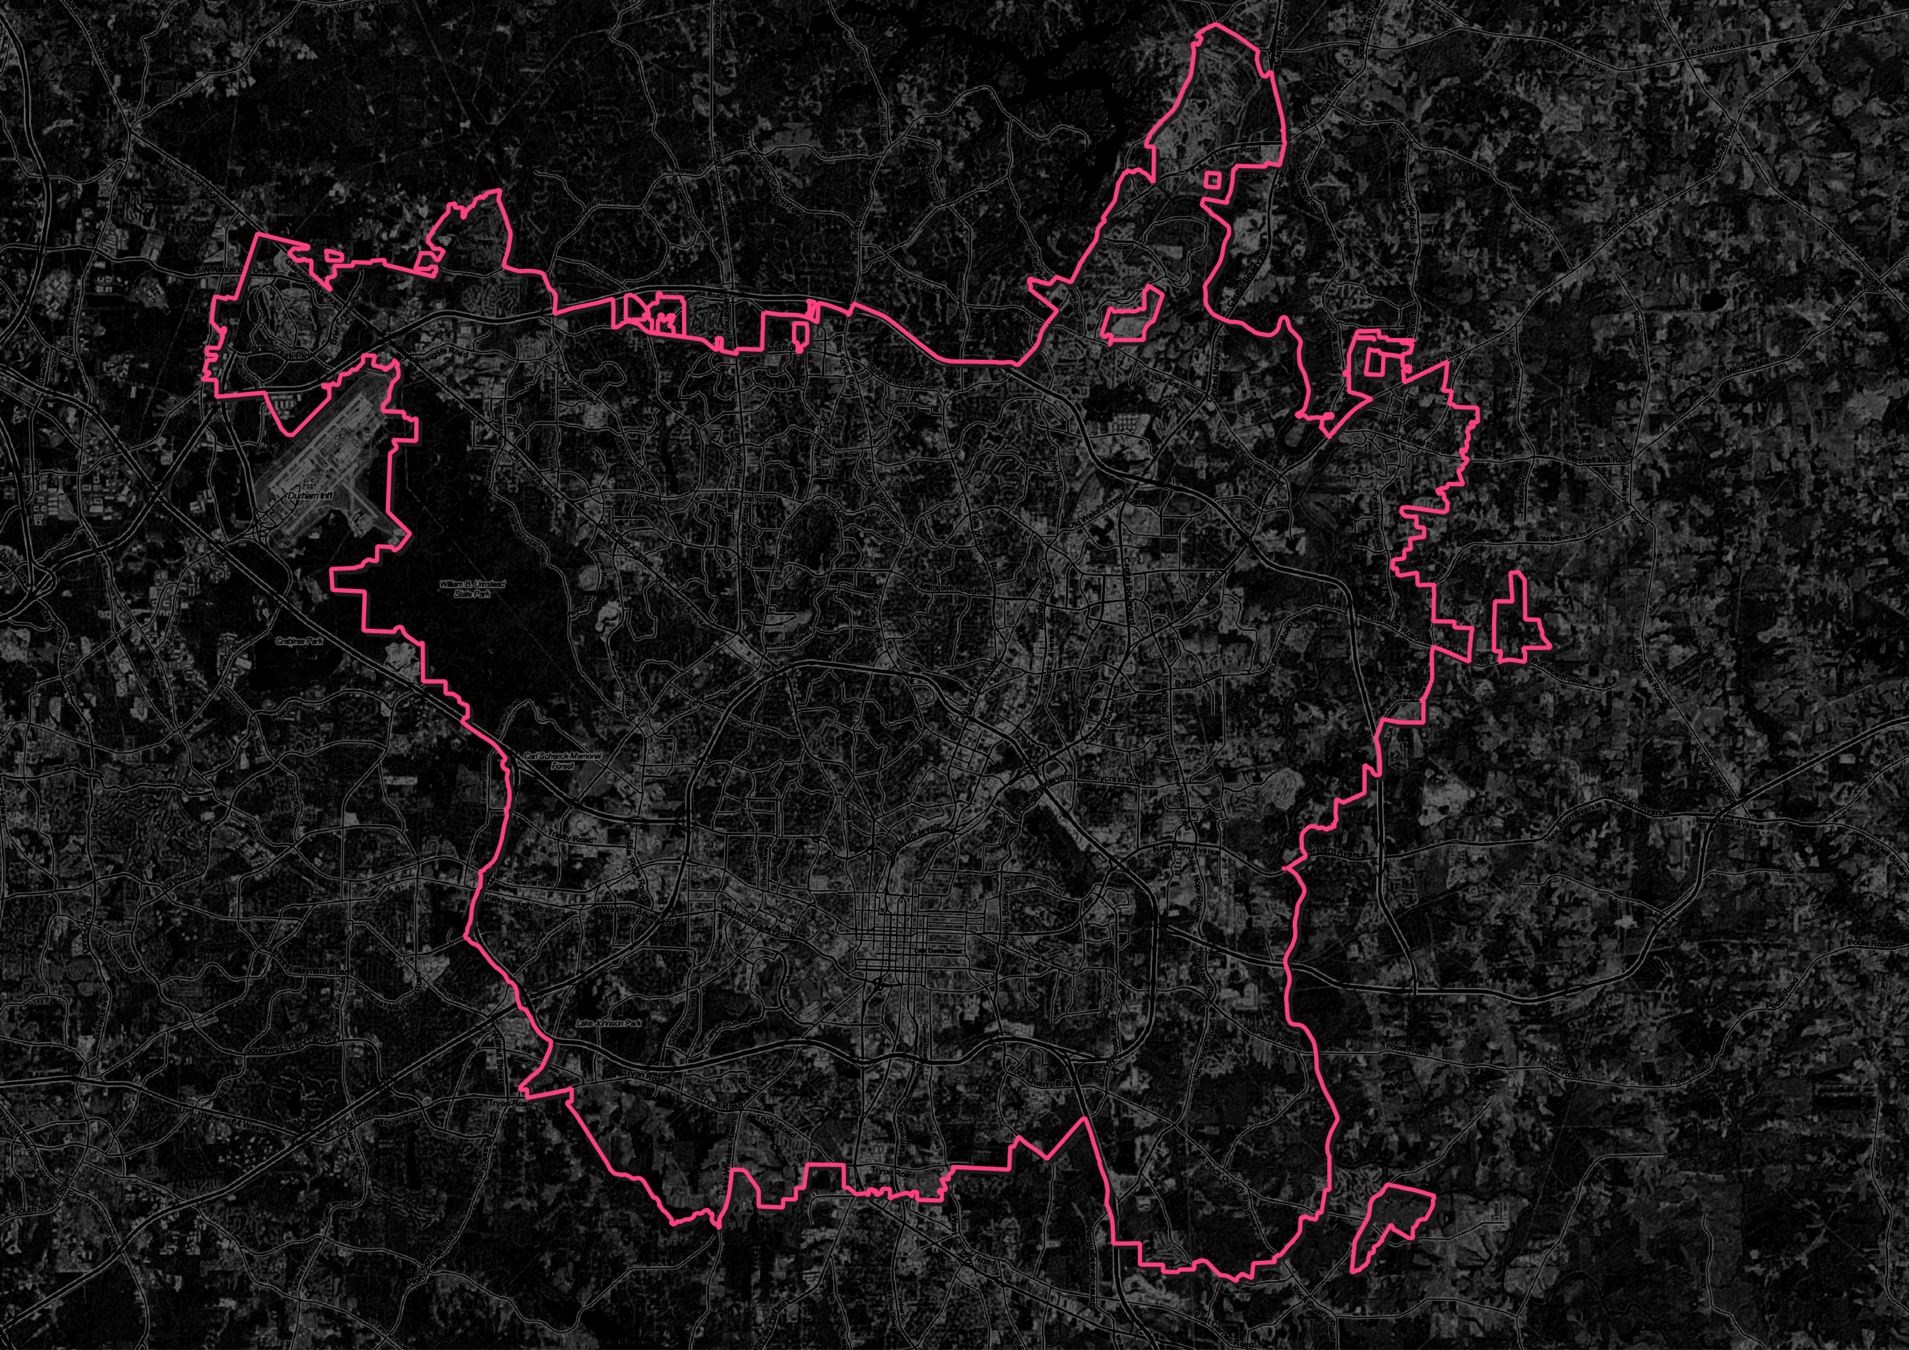
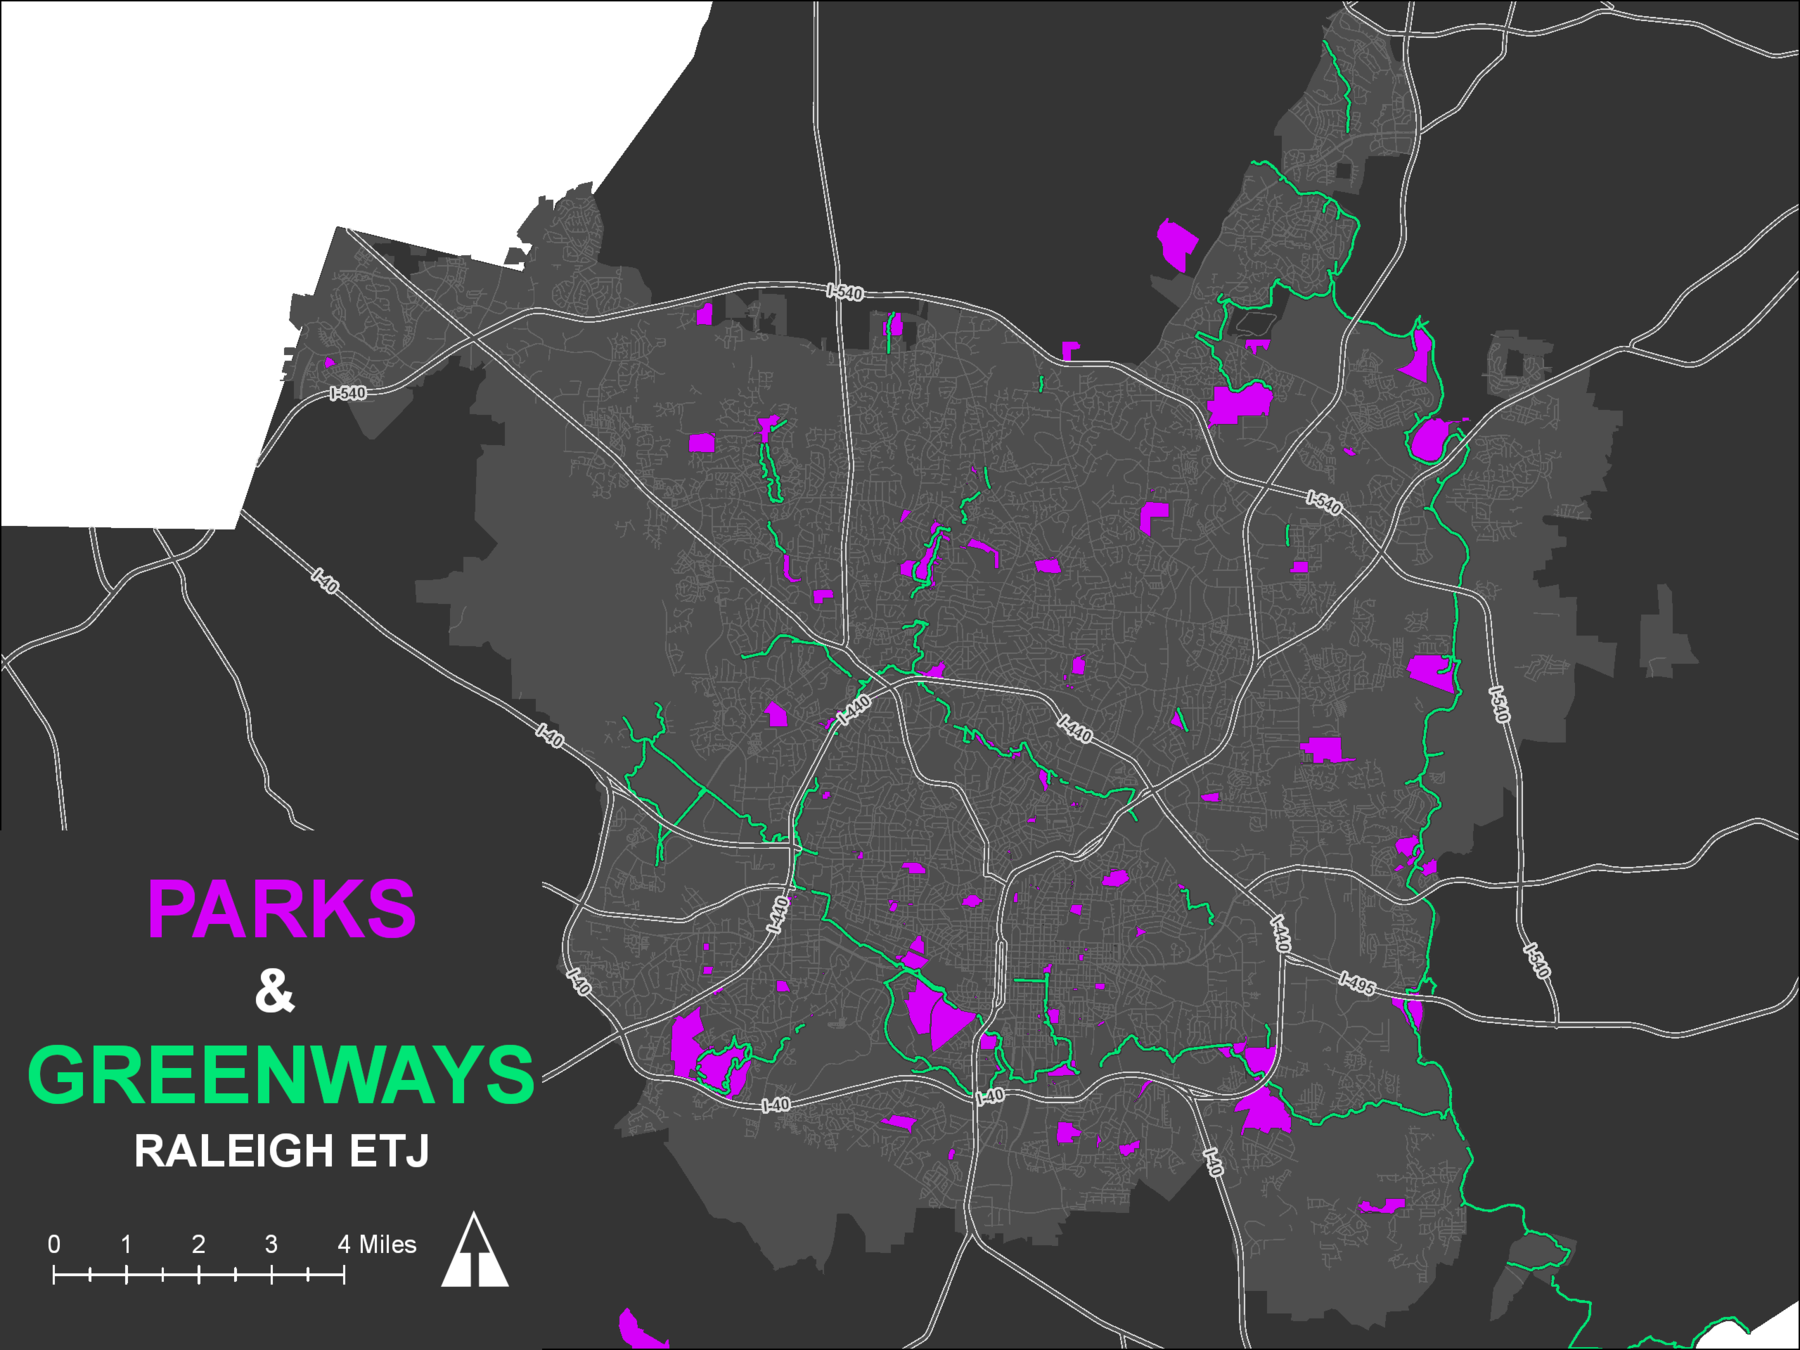
Modeling the Park System
Core Experience
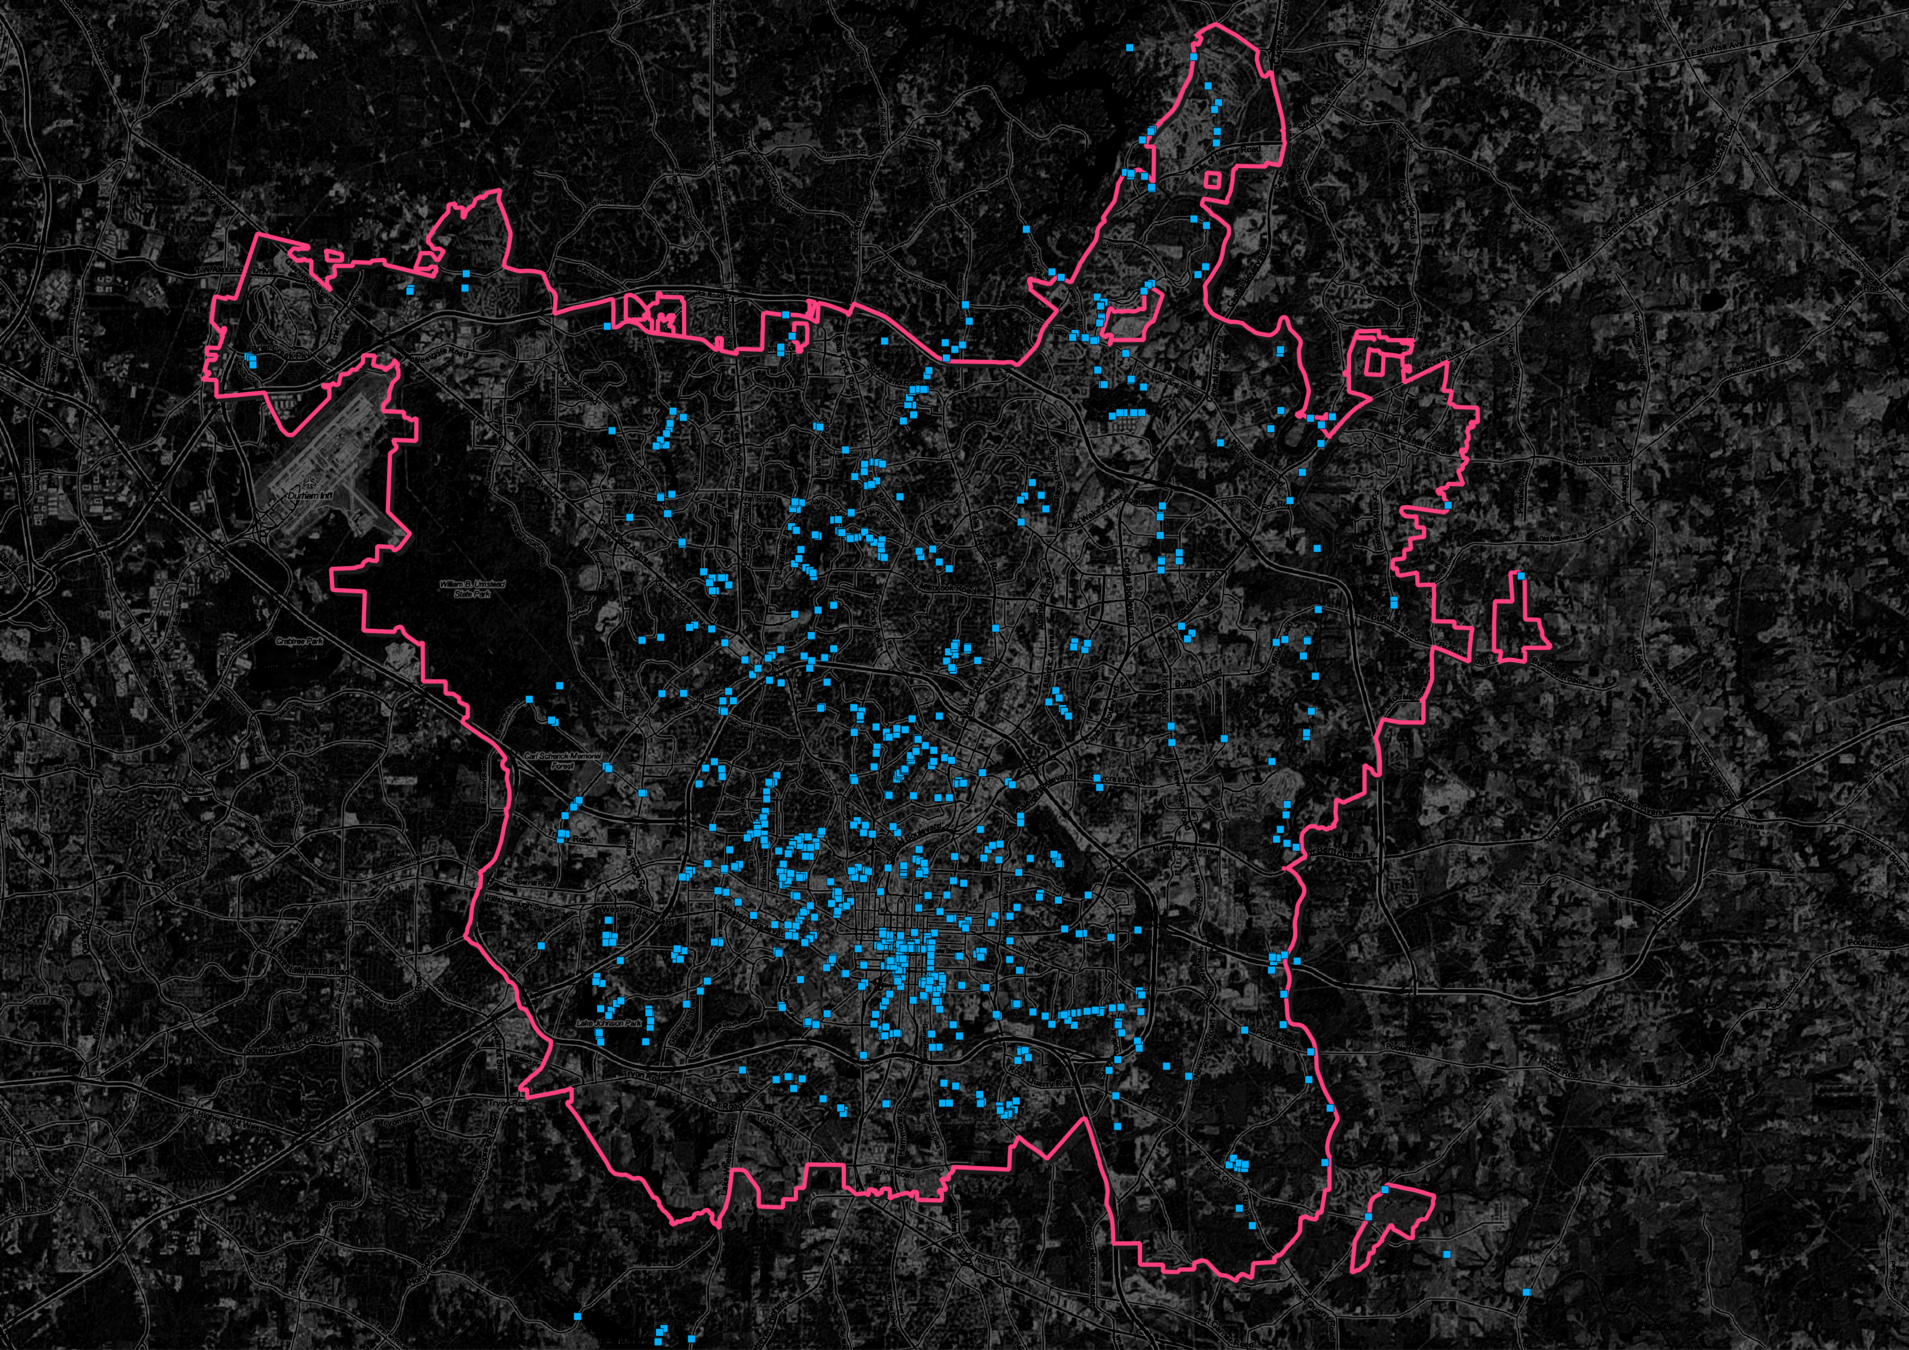
Park Access Points
Raleigh Population
Census Blocks
Route Access
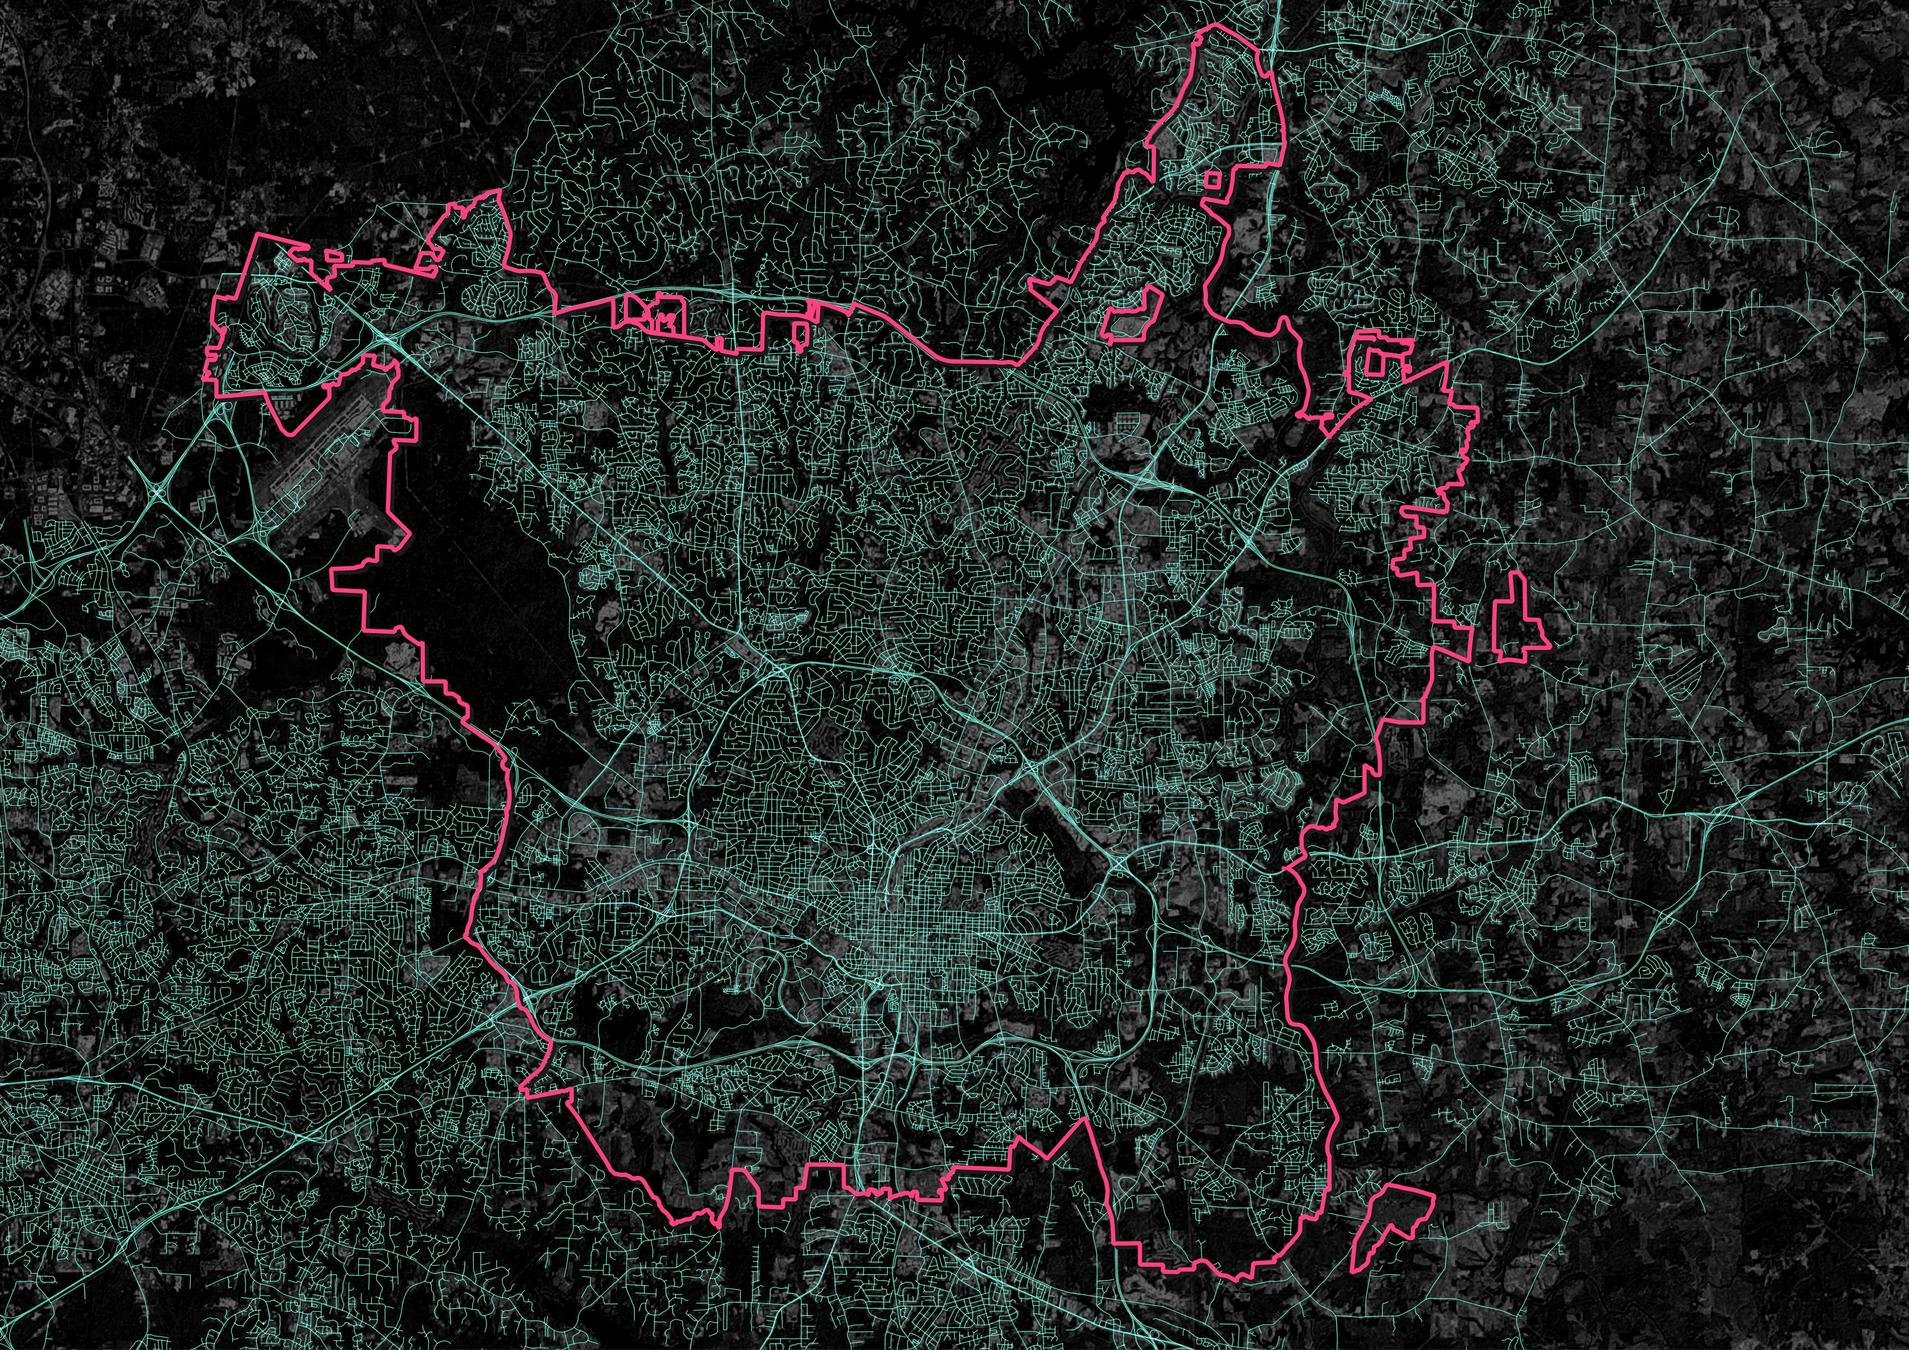
Transportation Network
Level of Service Metrics
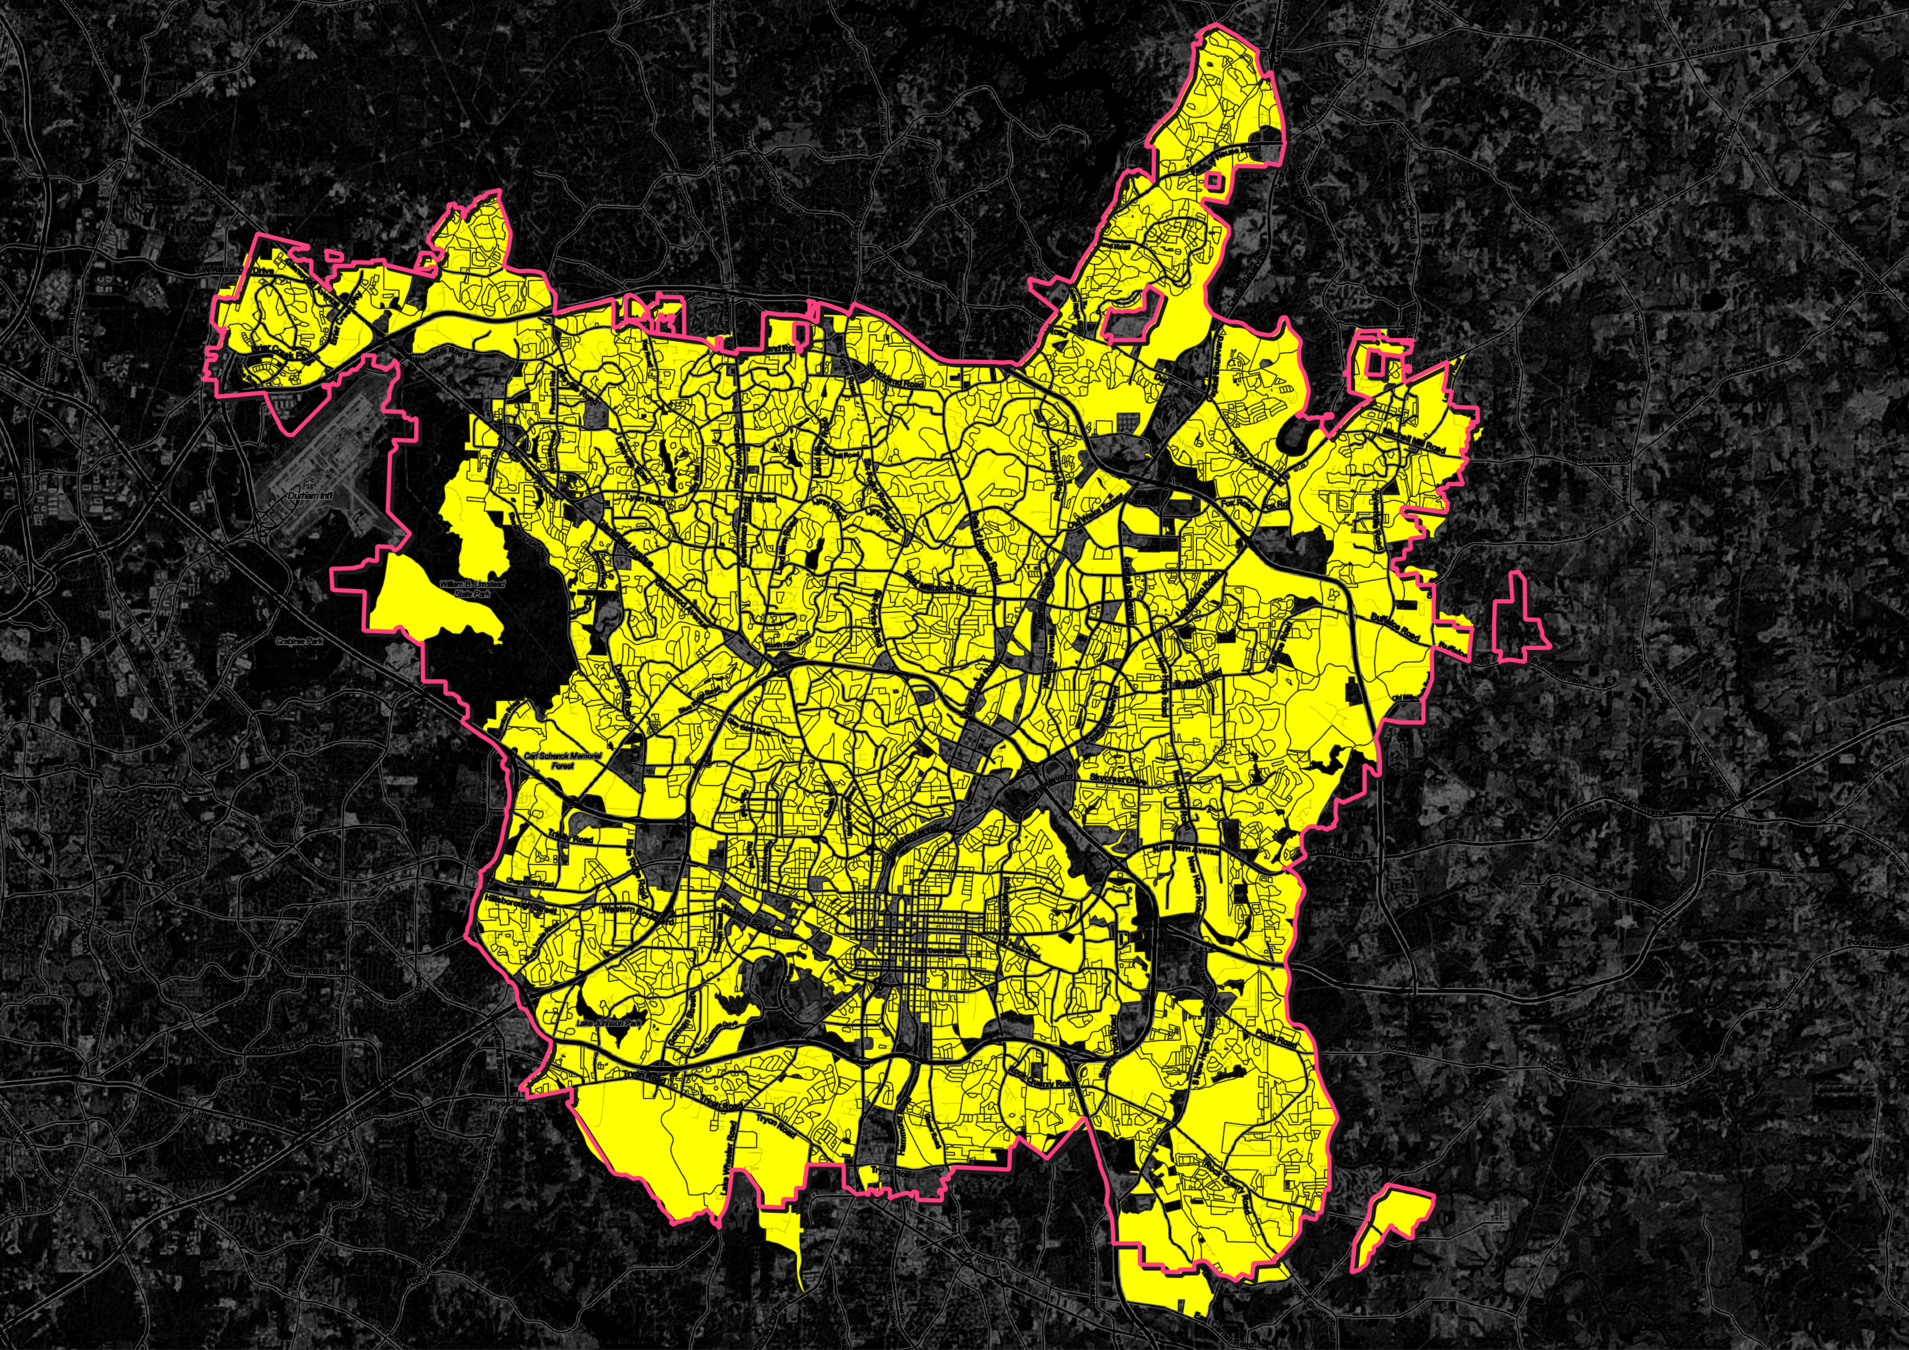
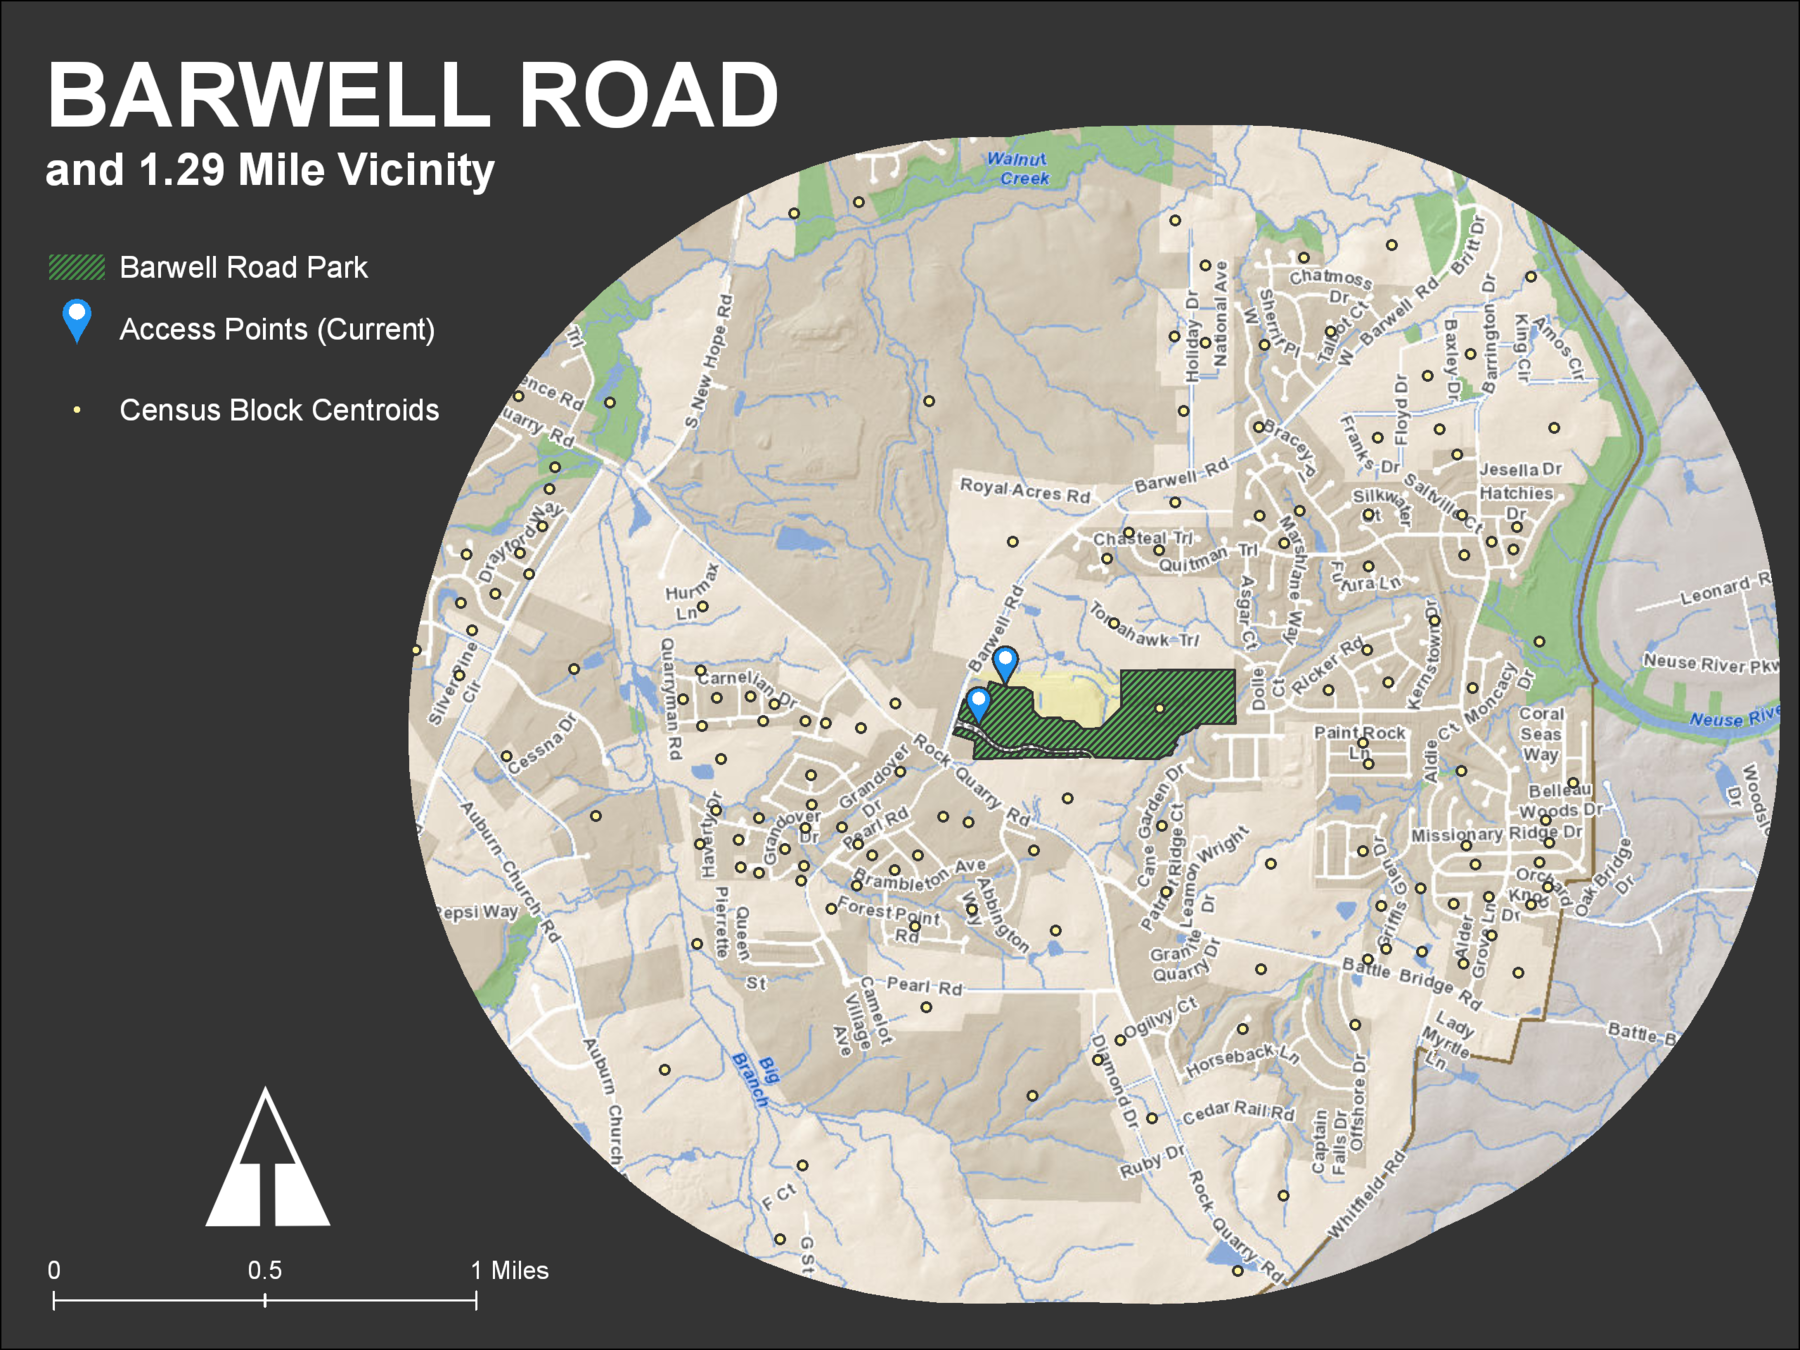
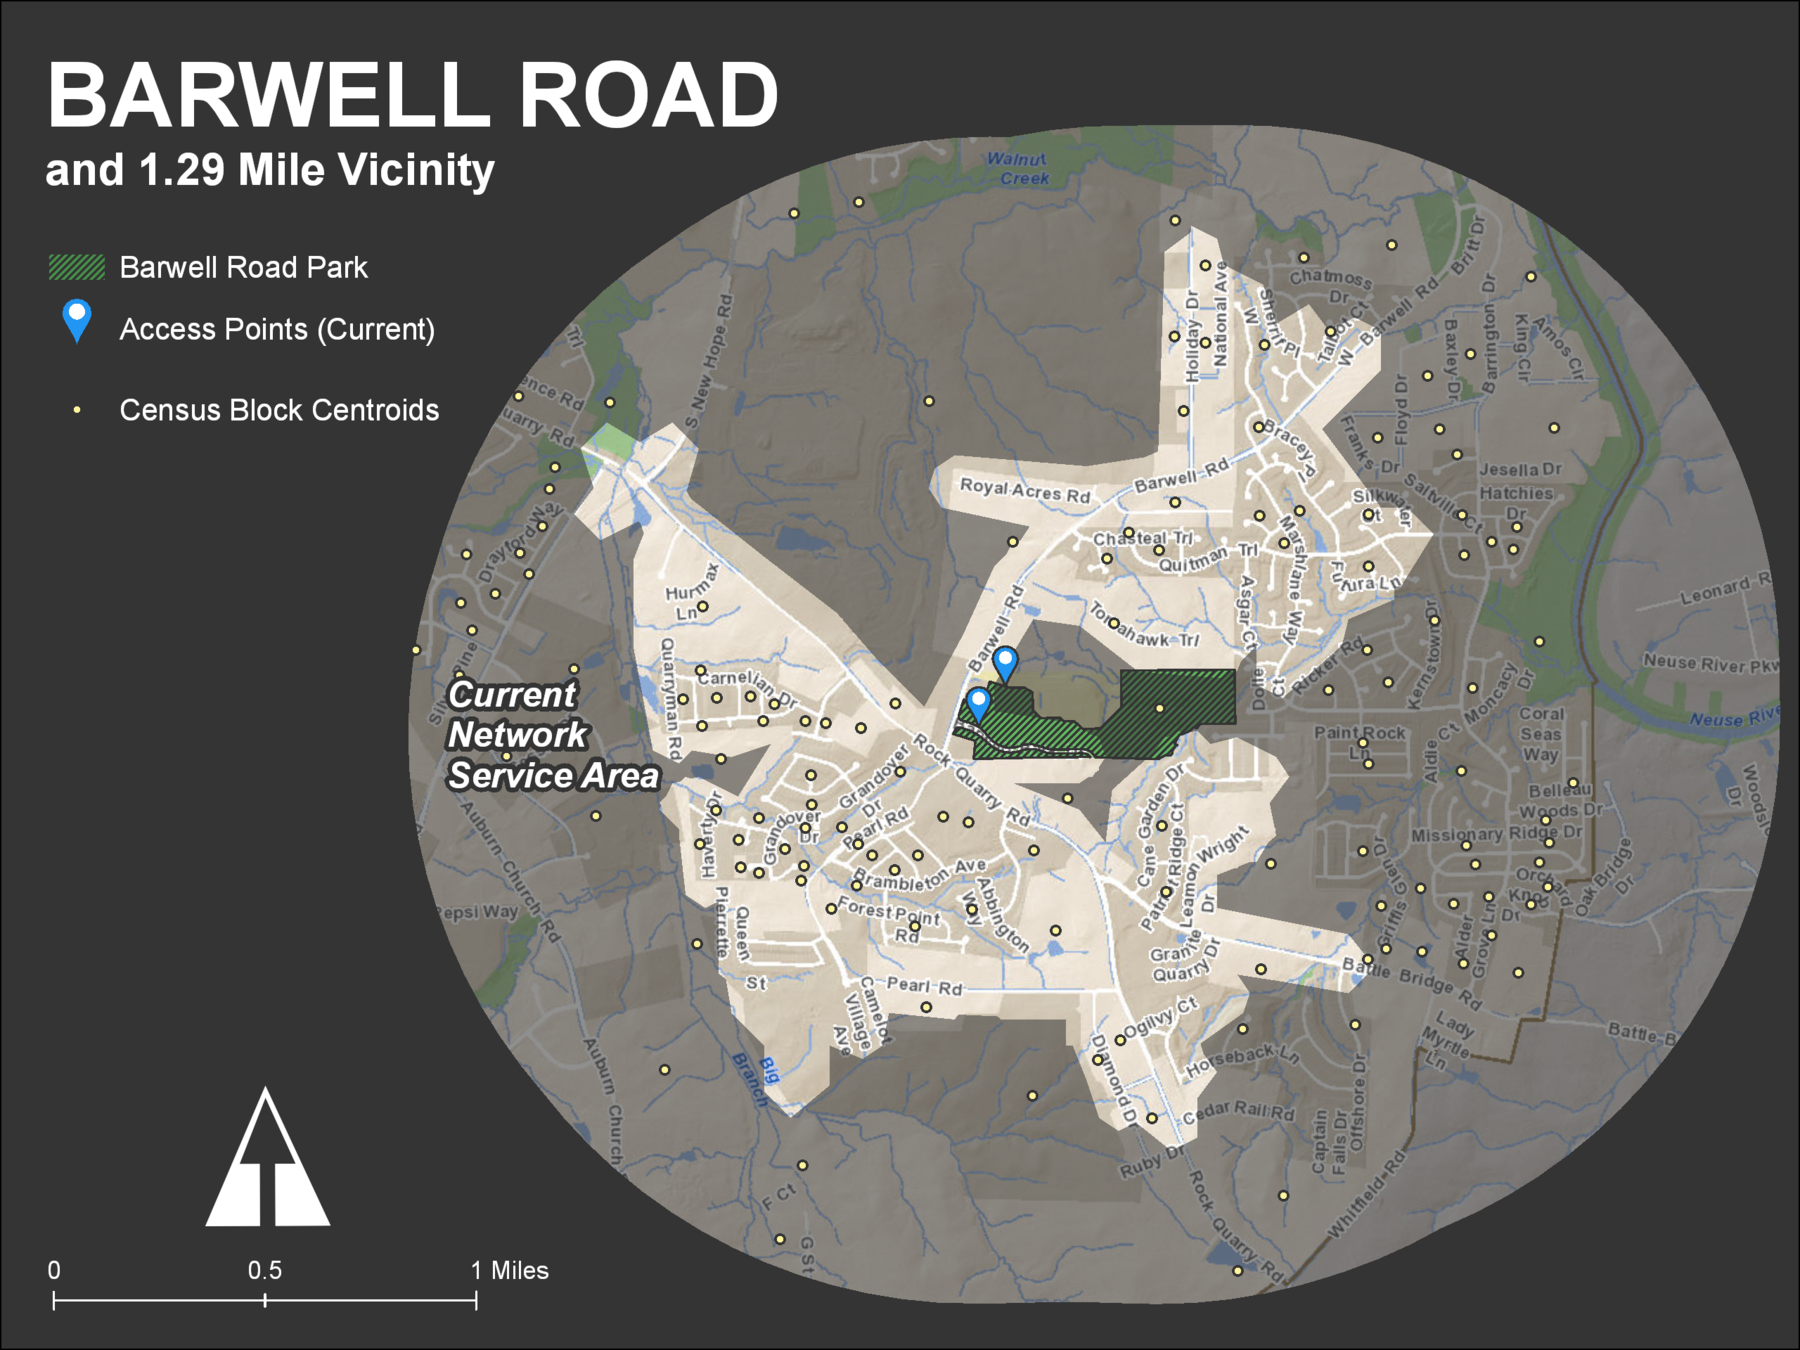
Accessibility
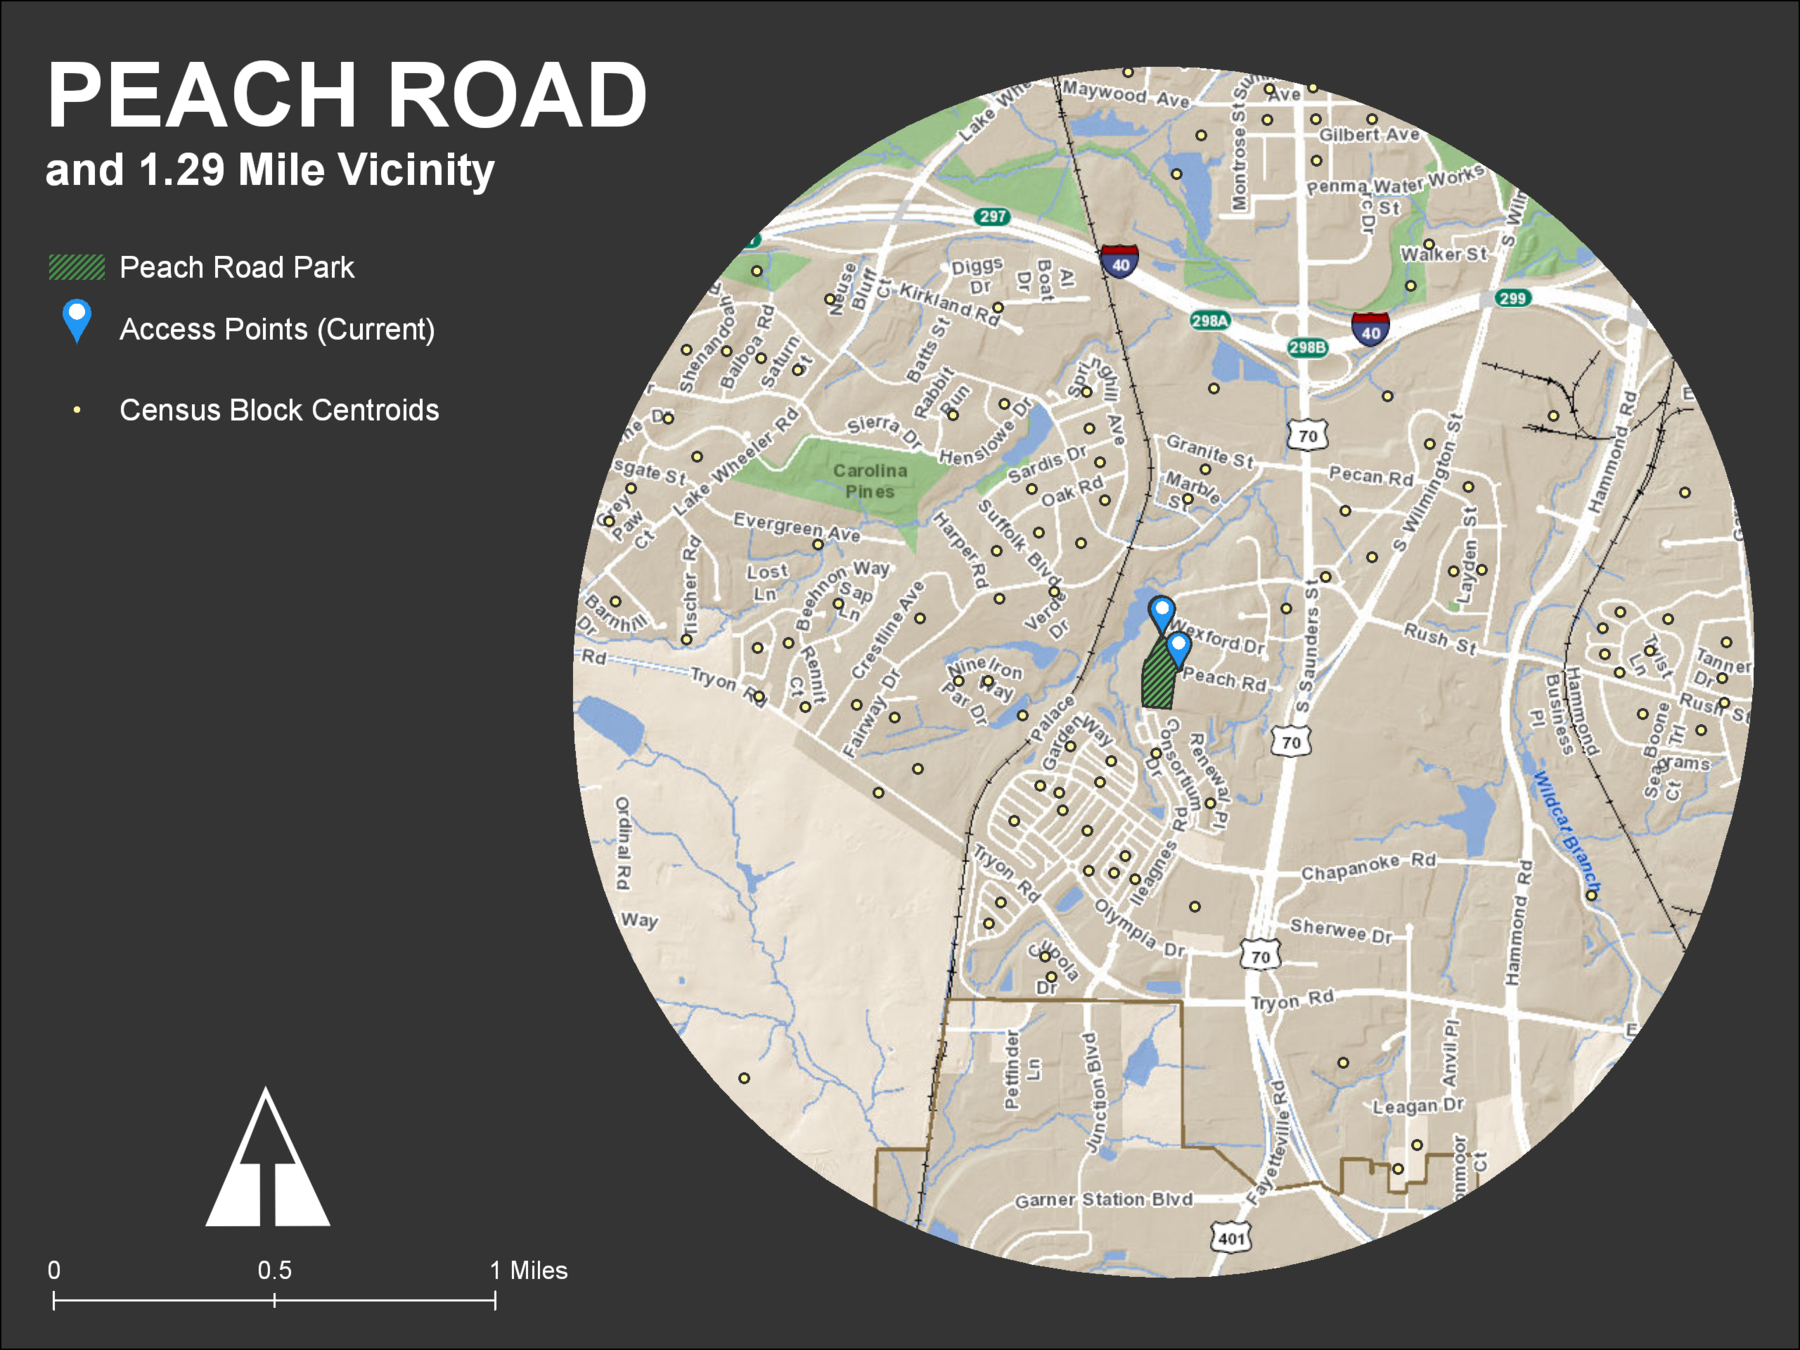
1.29 mile network service area
By Census Block:
- Distance to closest park
- Accessible parks per person
- Accessible park acres per person
Level of Service Tools
Network Distance to Parks Tool
Census Block Centroids
Transit Network
Park Access Points
Routes to Nearest Park
Routes to parks within 1.29 mi
Step 1: Generate Routes from Census Blocks to Parks
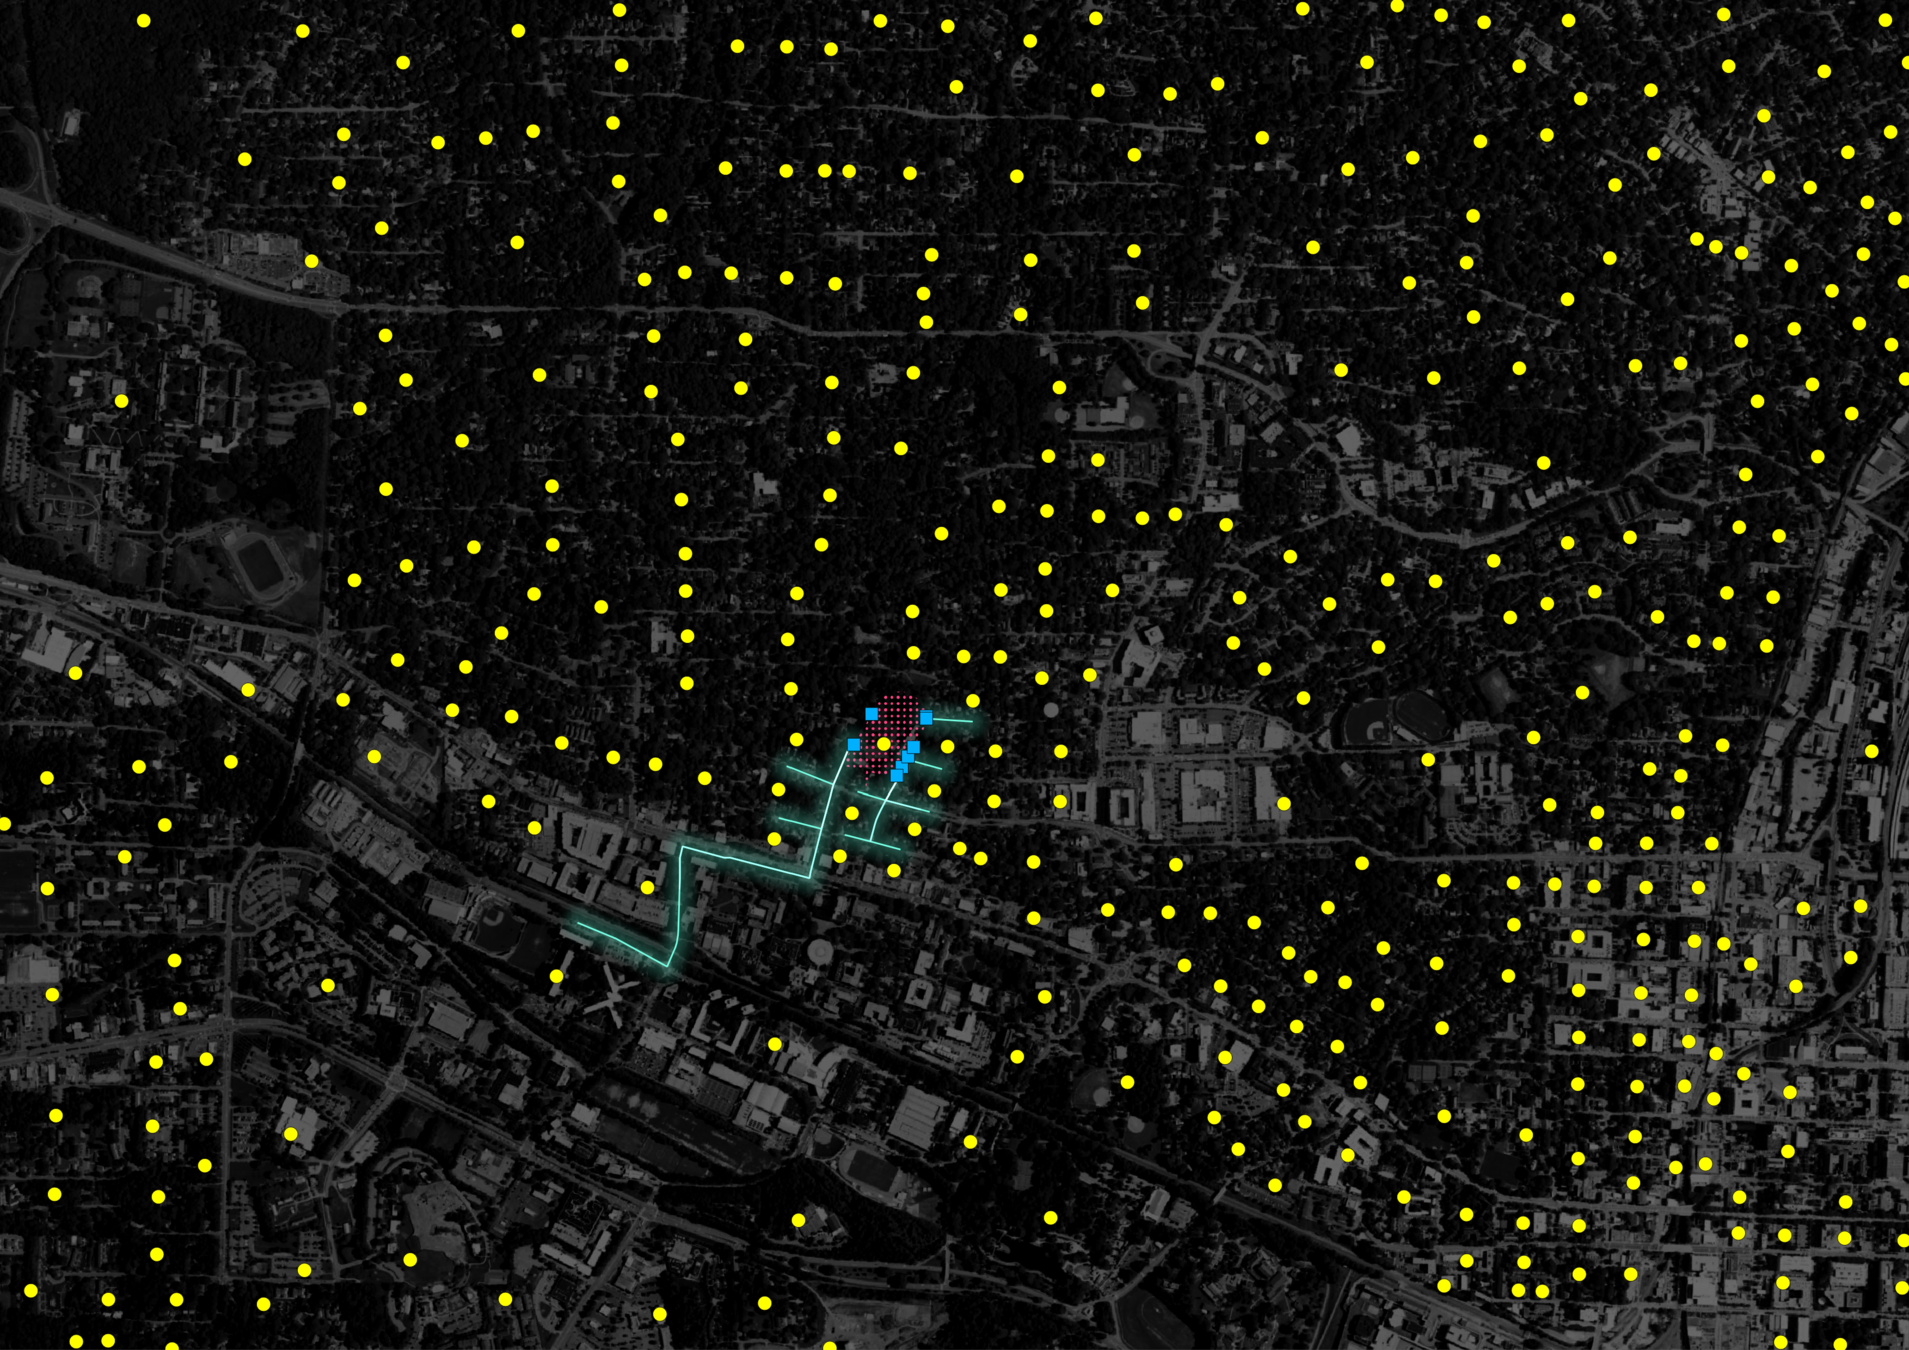
Closest Routes
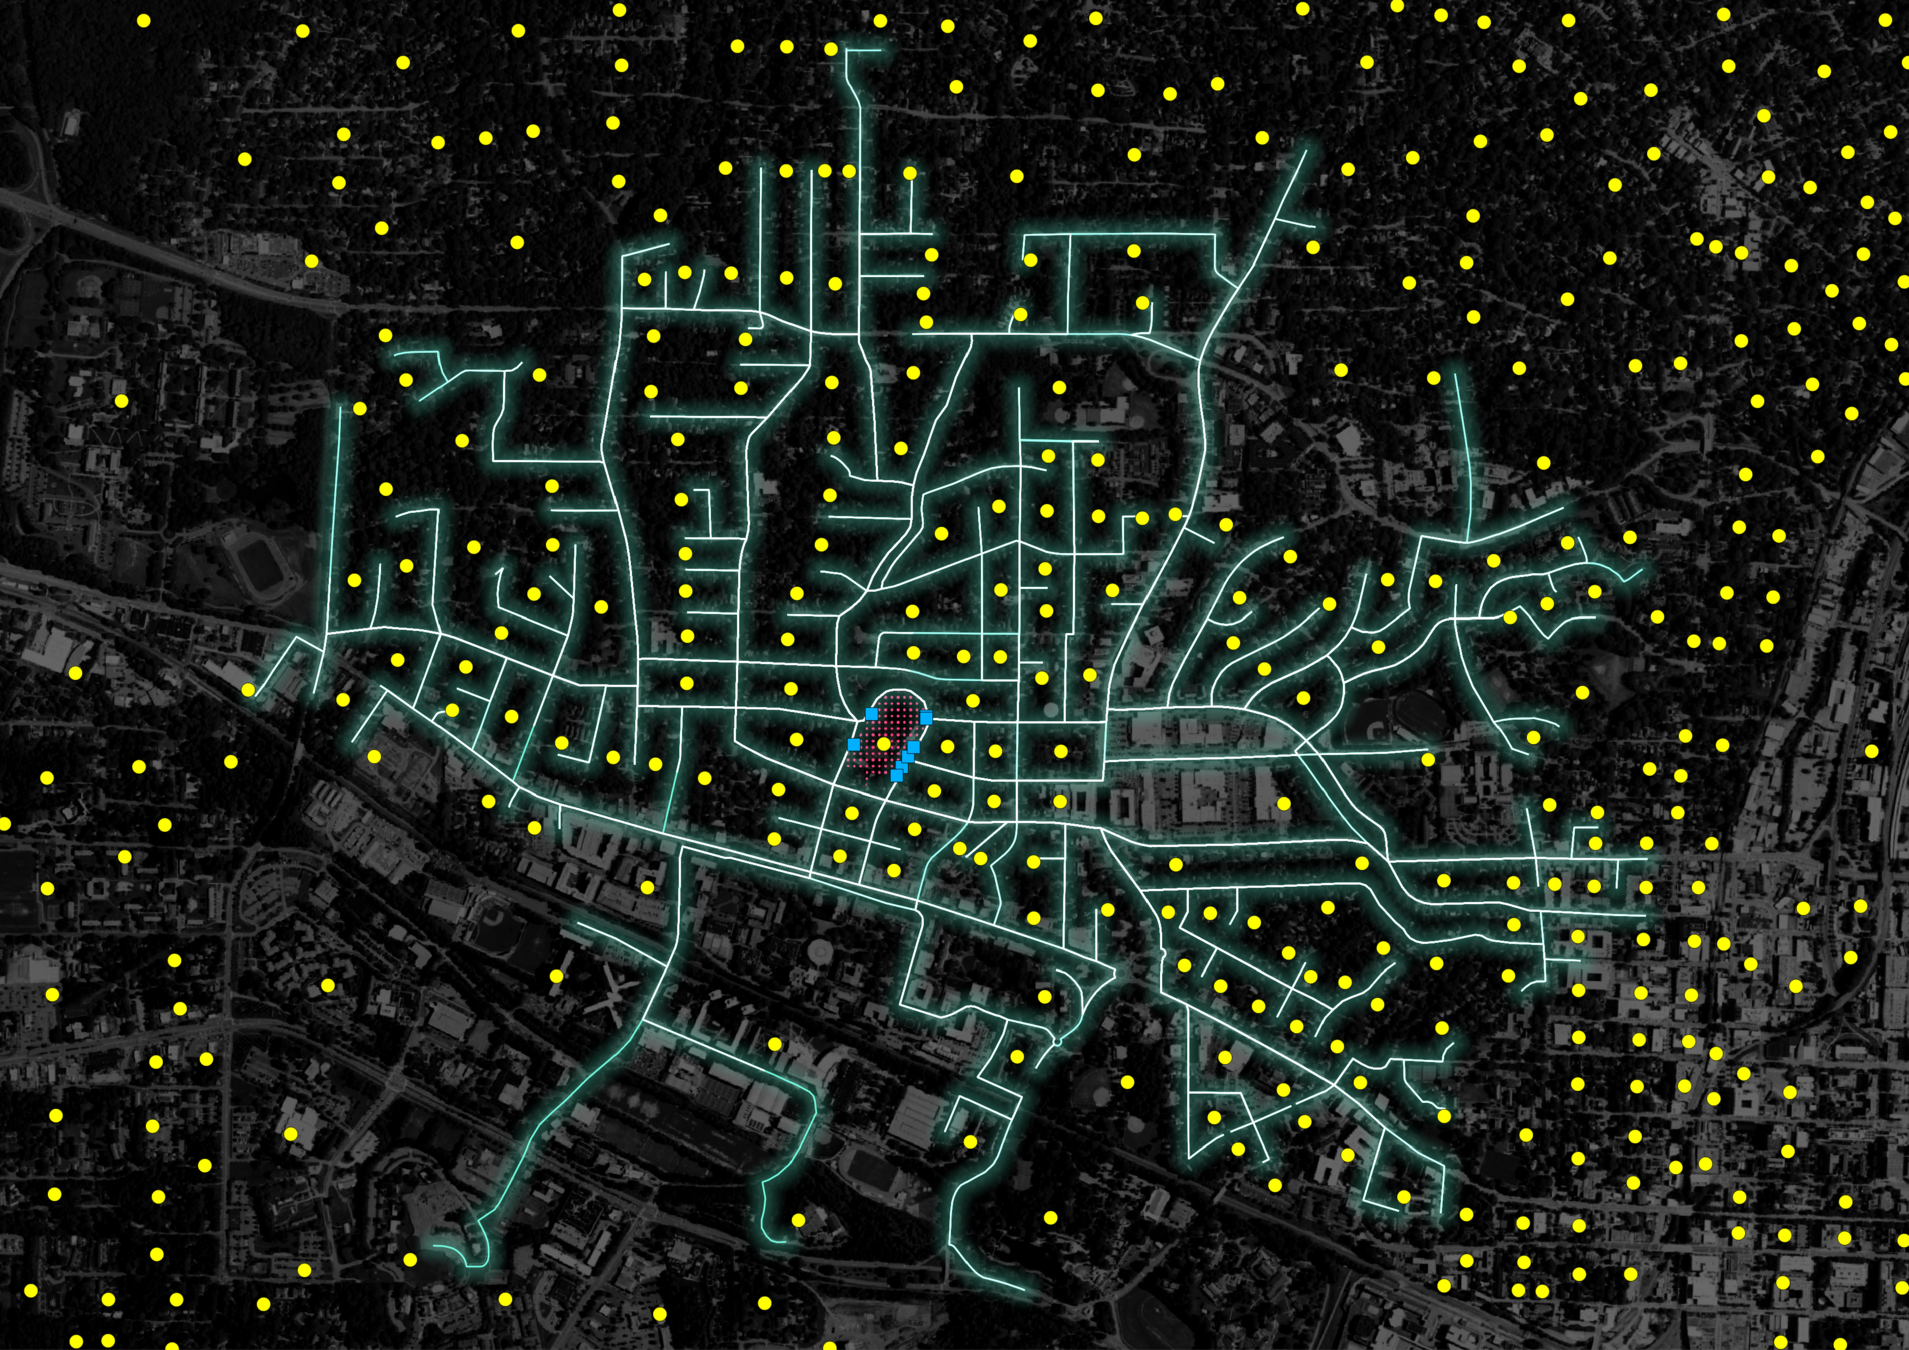
1.29 Mile Routes
Level of Service Calculator
Census Block
Parks
Routes to Nearest Park
Routes to parks within 1.29 mi
Step 2: Calculate Metrics, Score LOS
Census Blocks w/ LOS Scores
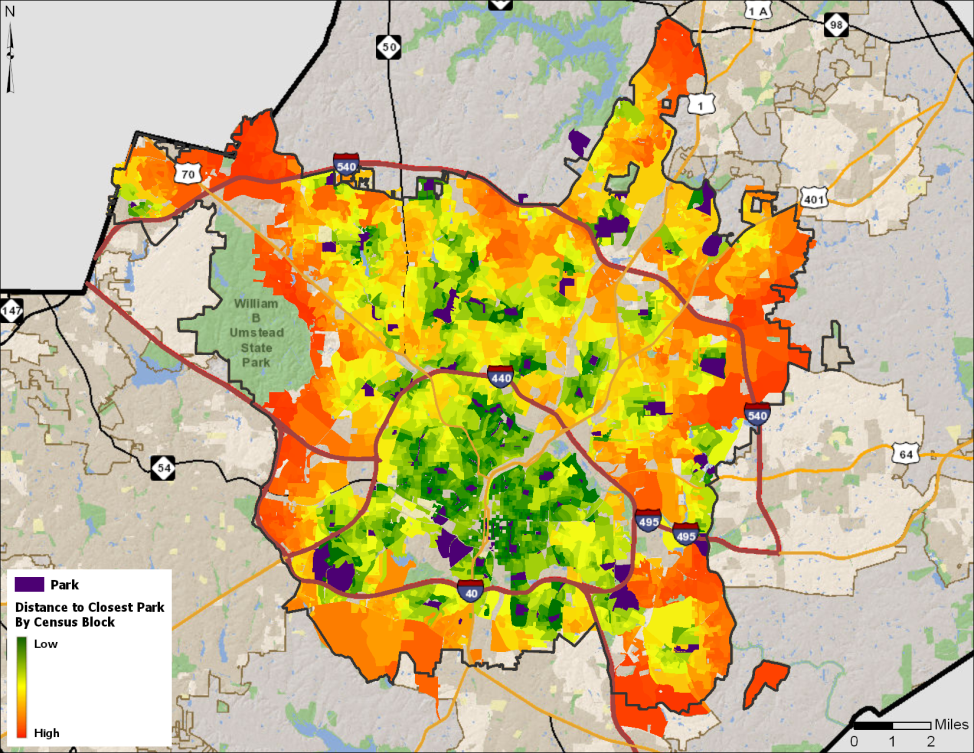
Distance to Closest Park
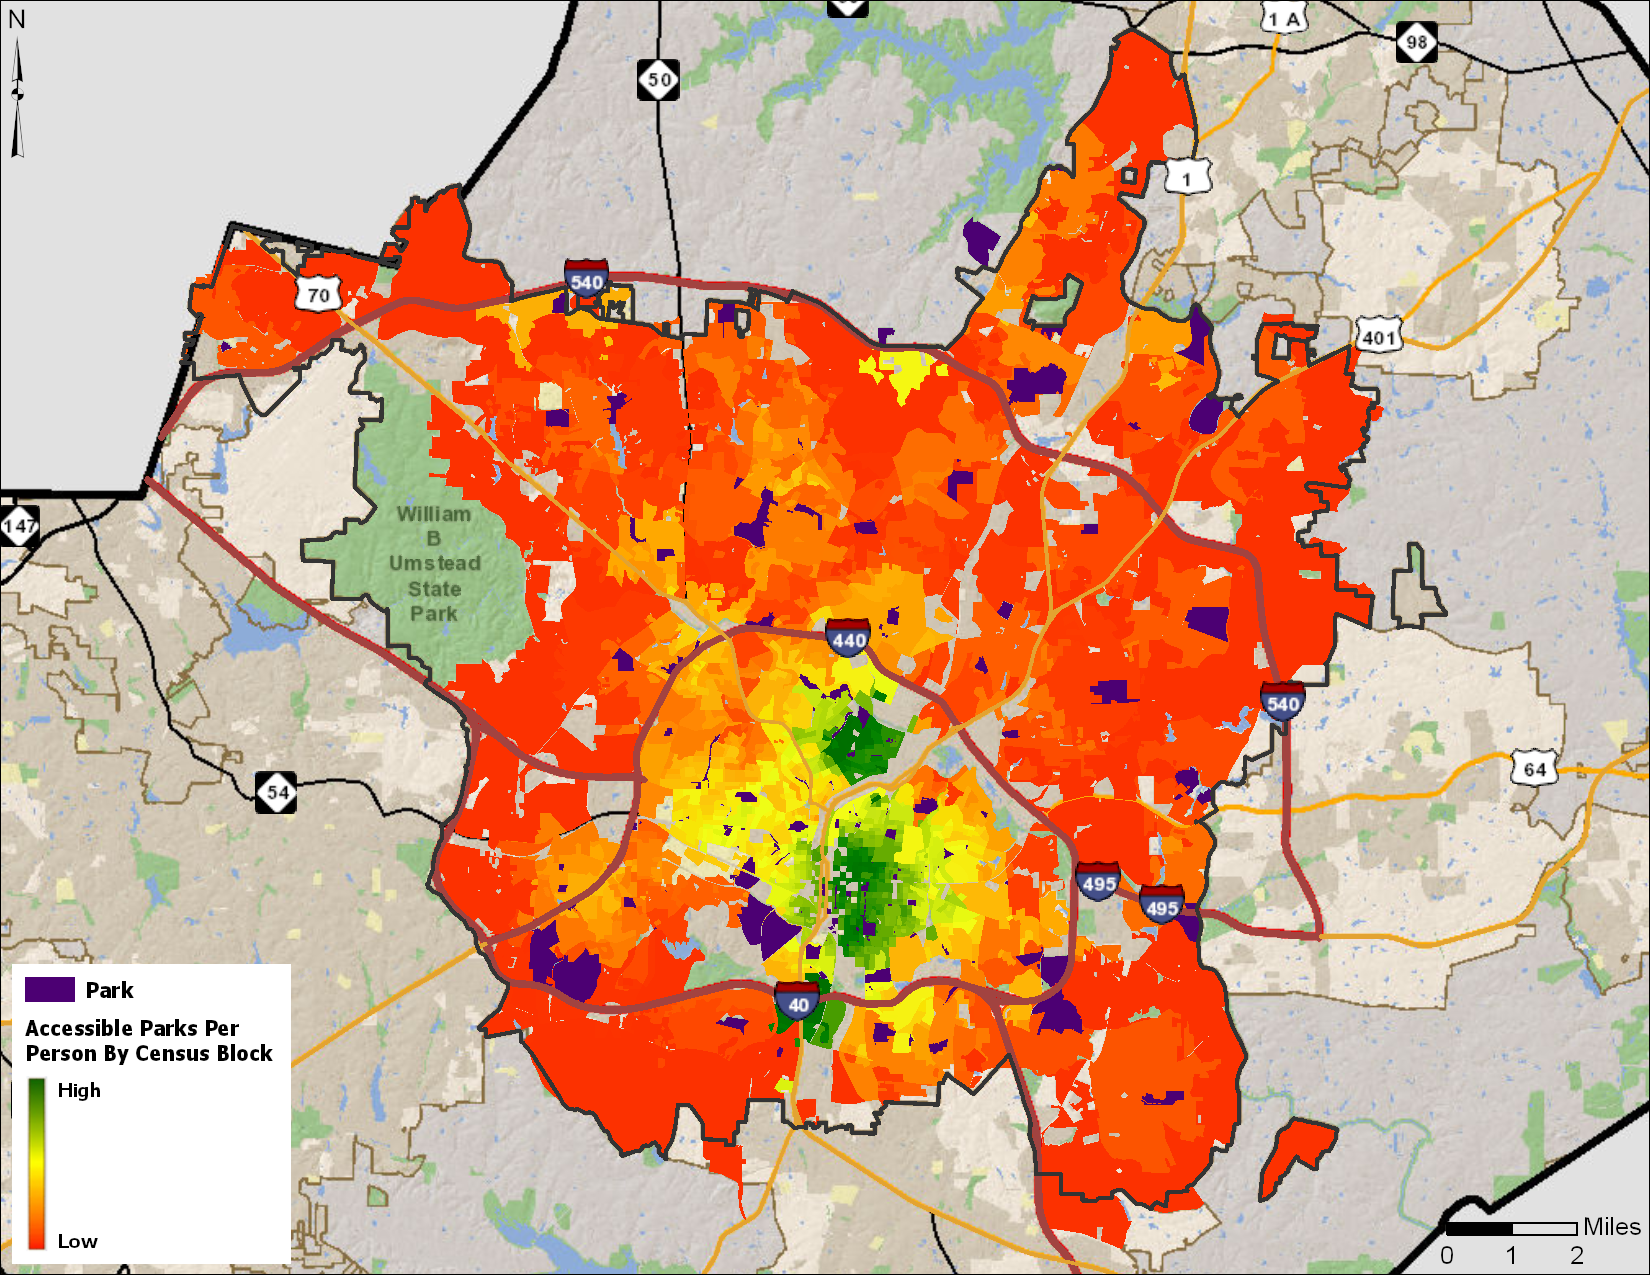
Accessible Parks per Person
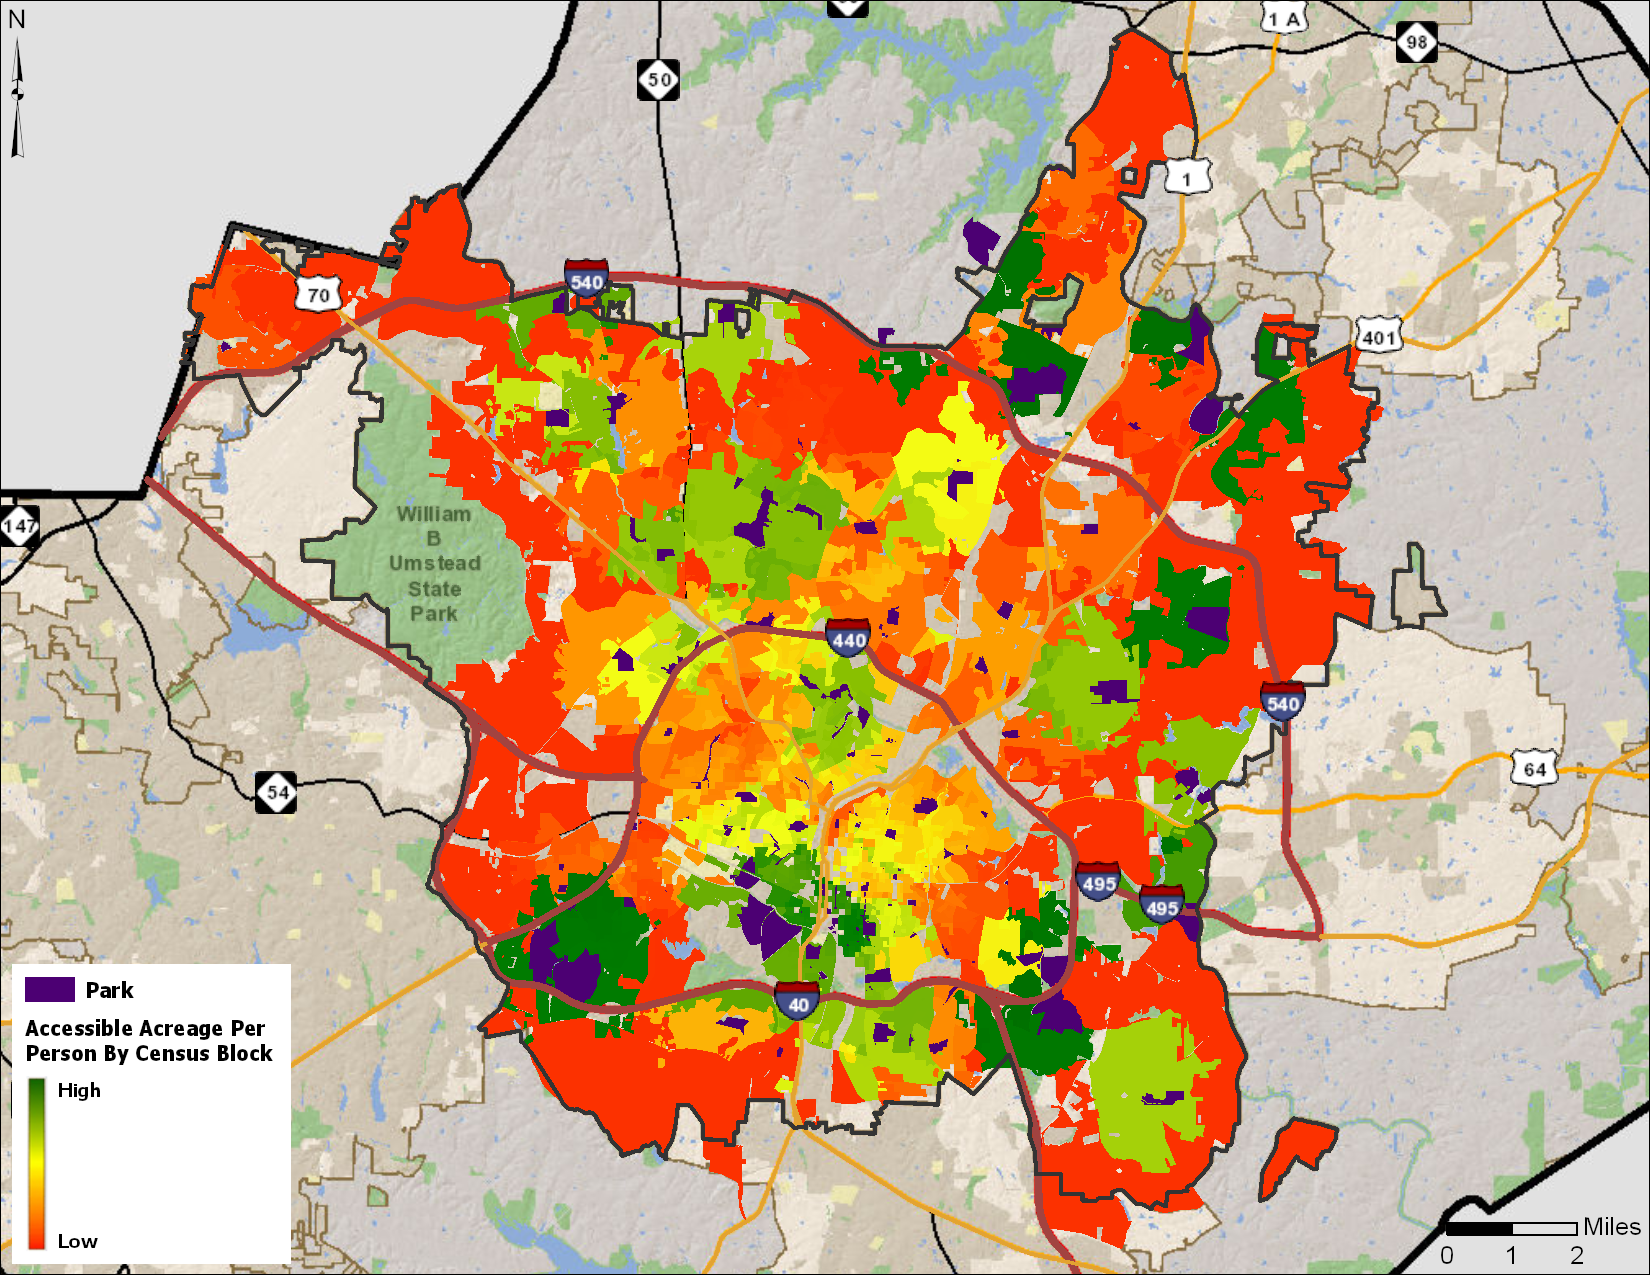
Accessible Acreage per Person
+
+
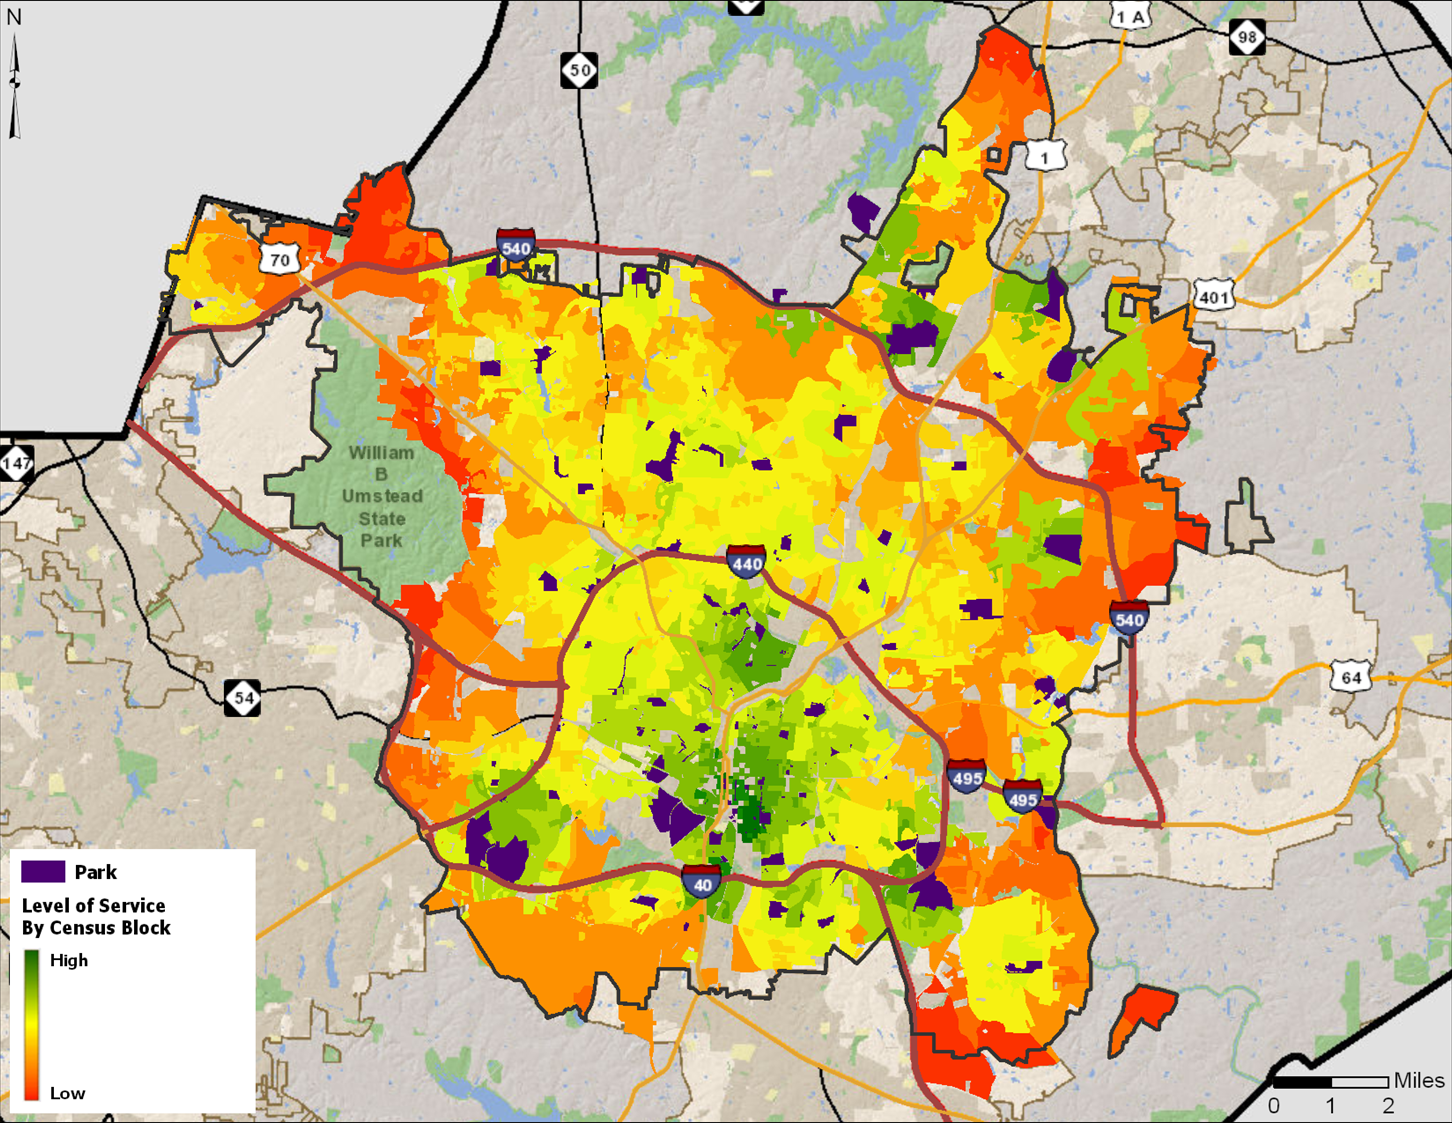
Level of Service
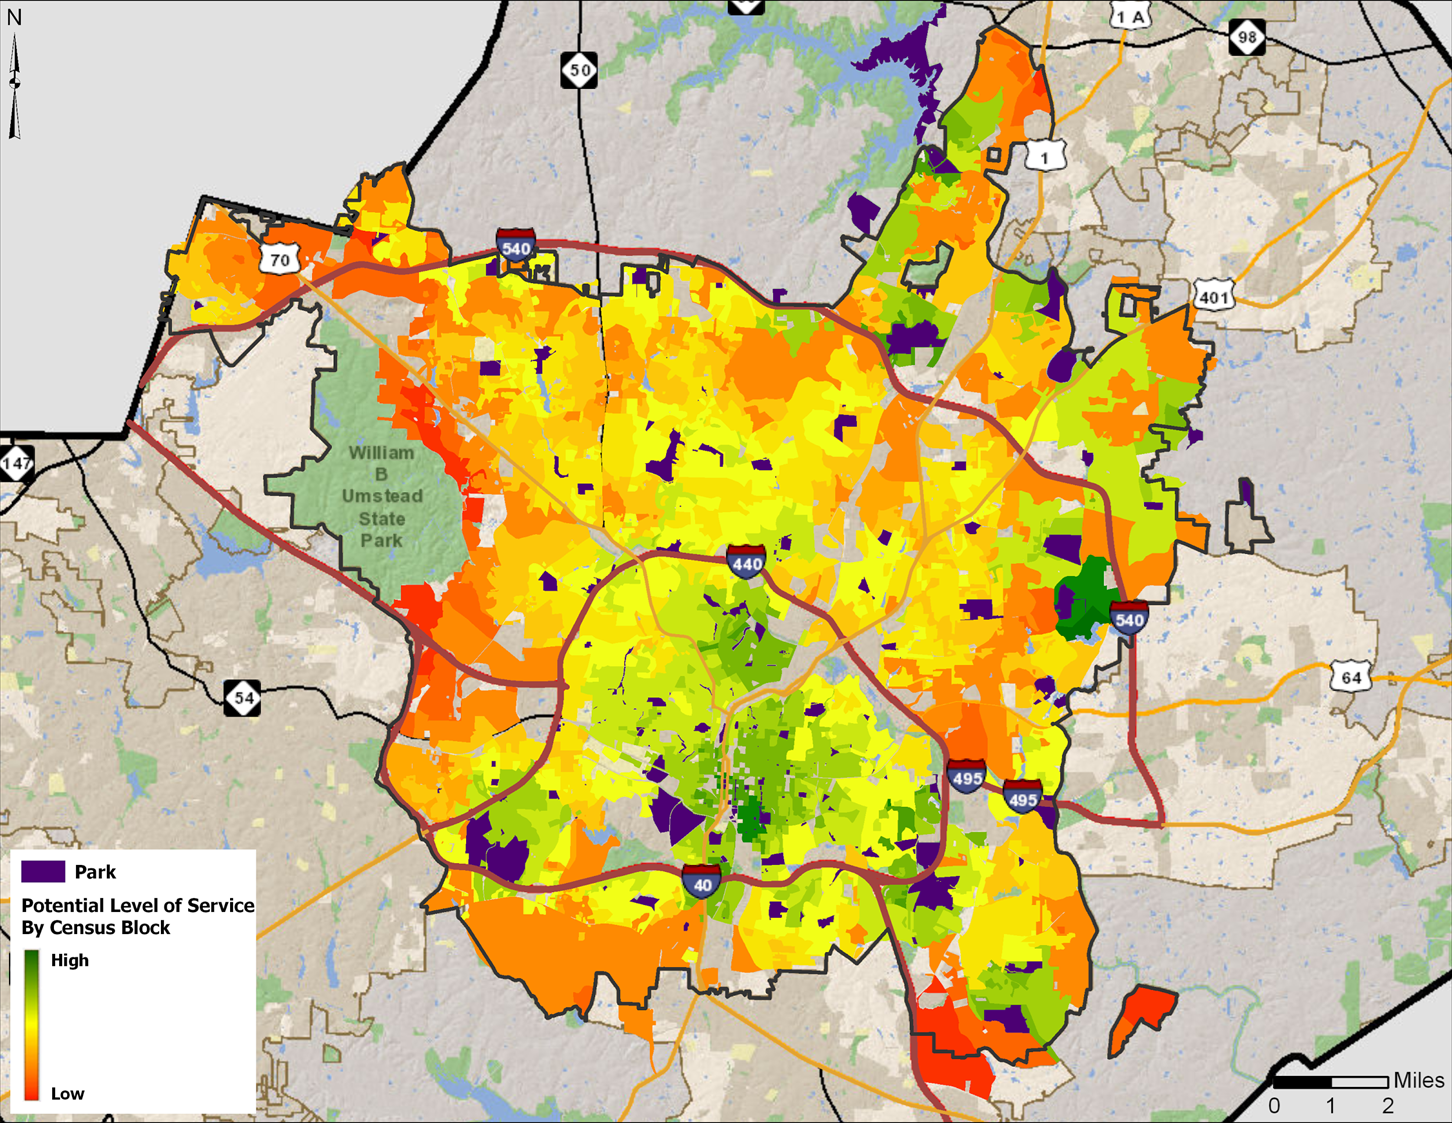
Land Acquisition Scenario
Neighborhood & Community Connections
How well does Raleigh's park system serve its population?
How well does Raleigh's park system serve its population?
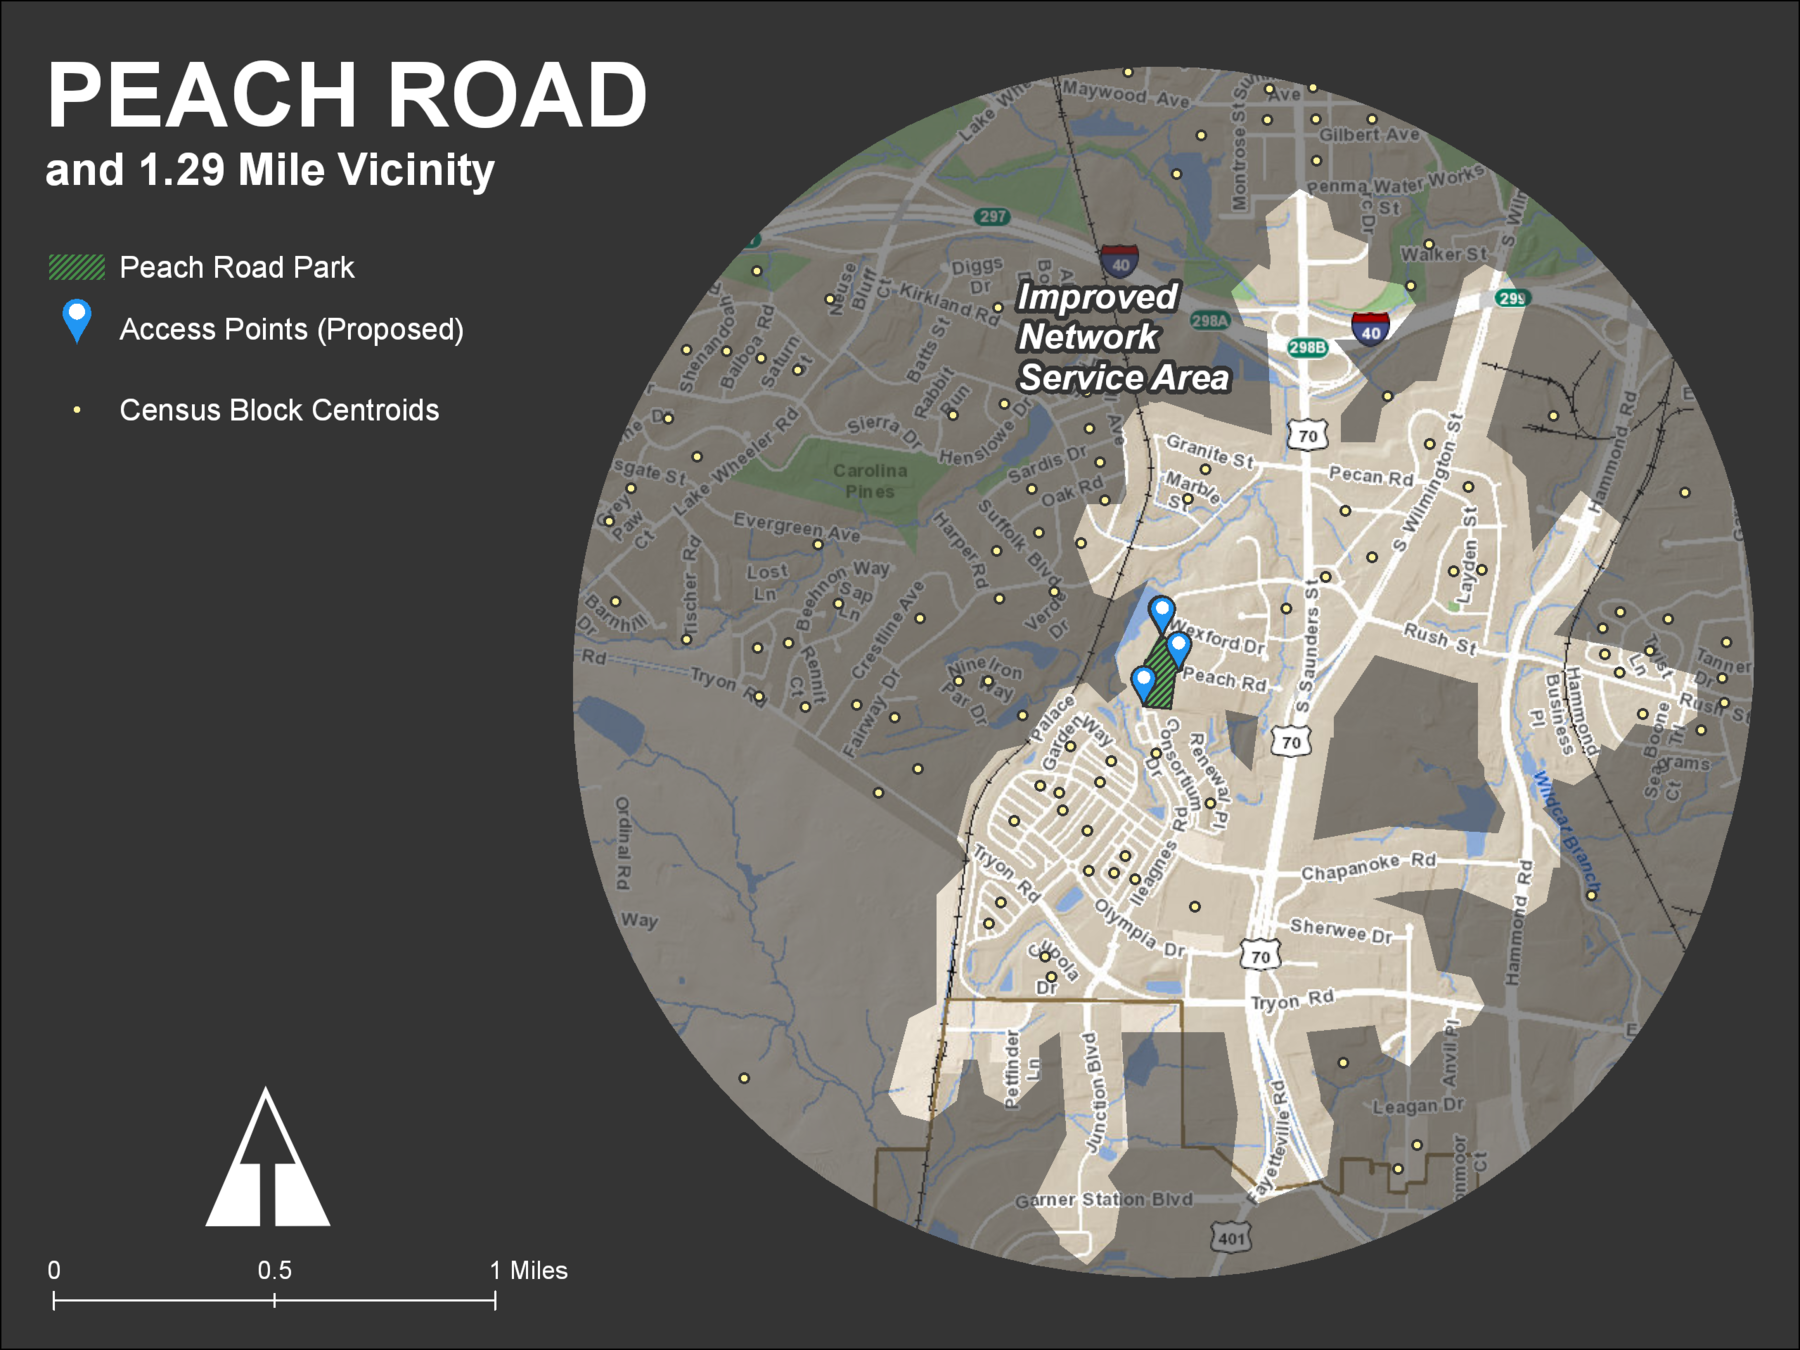
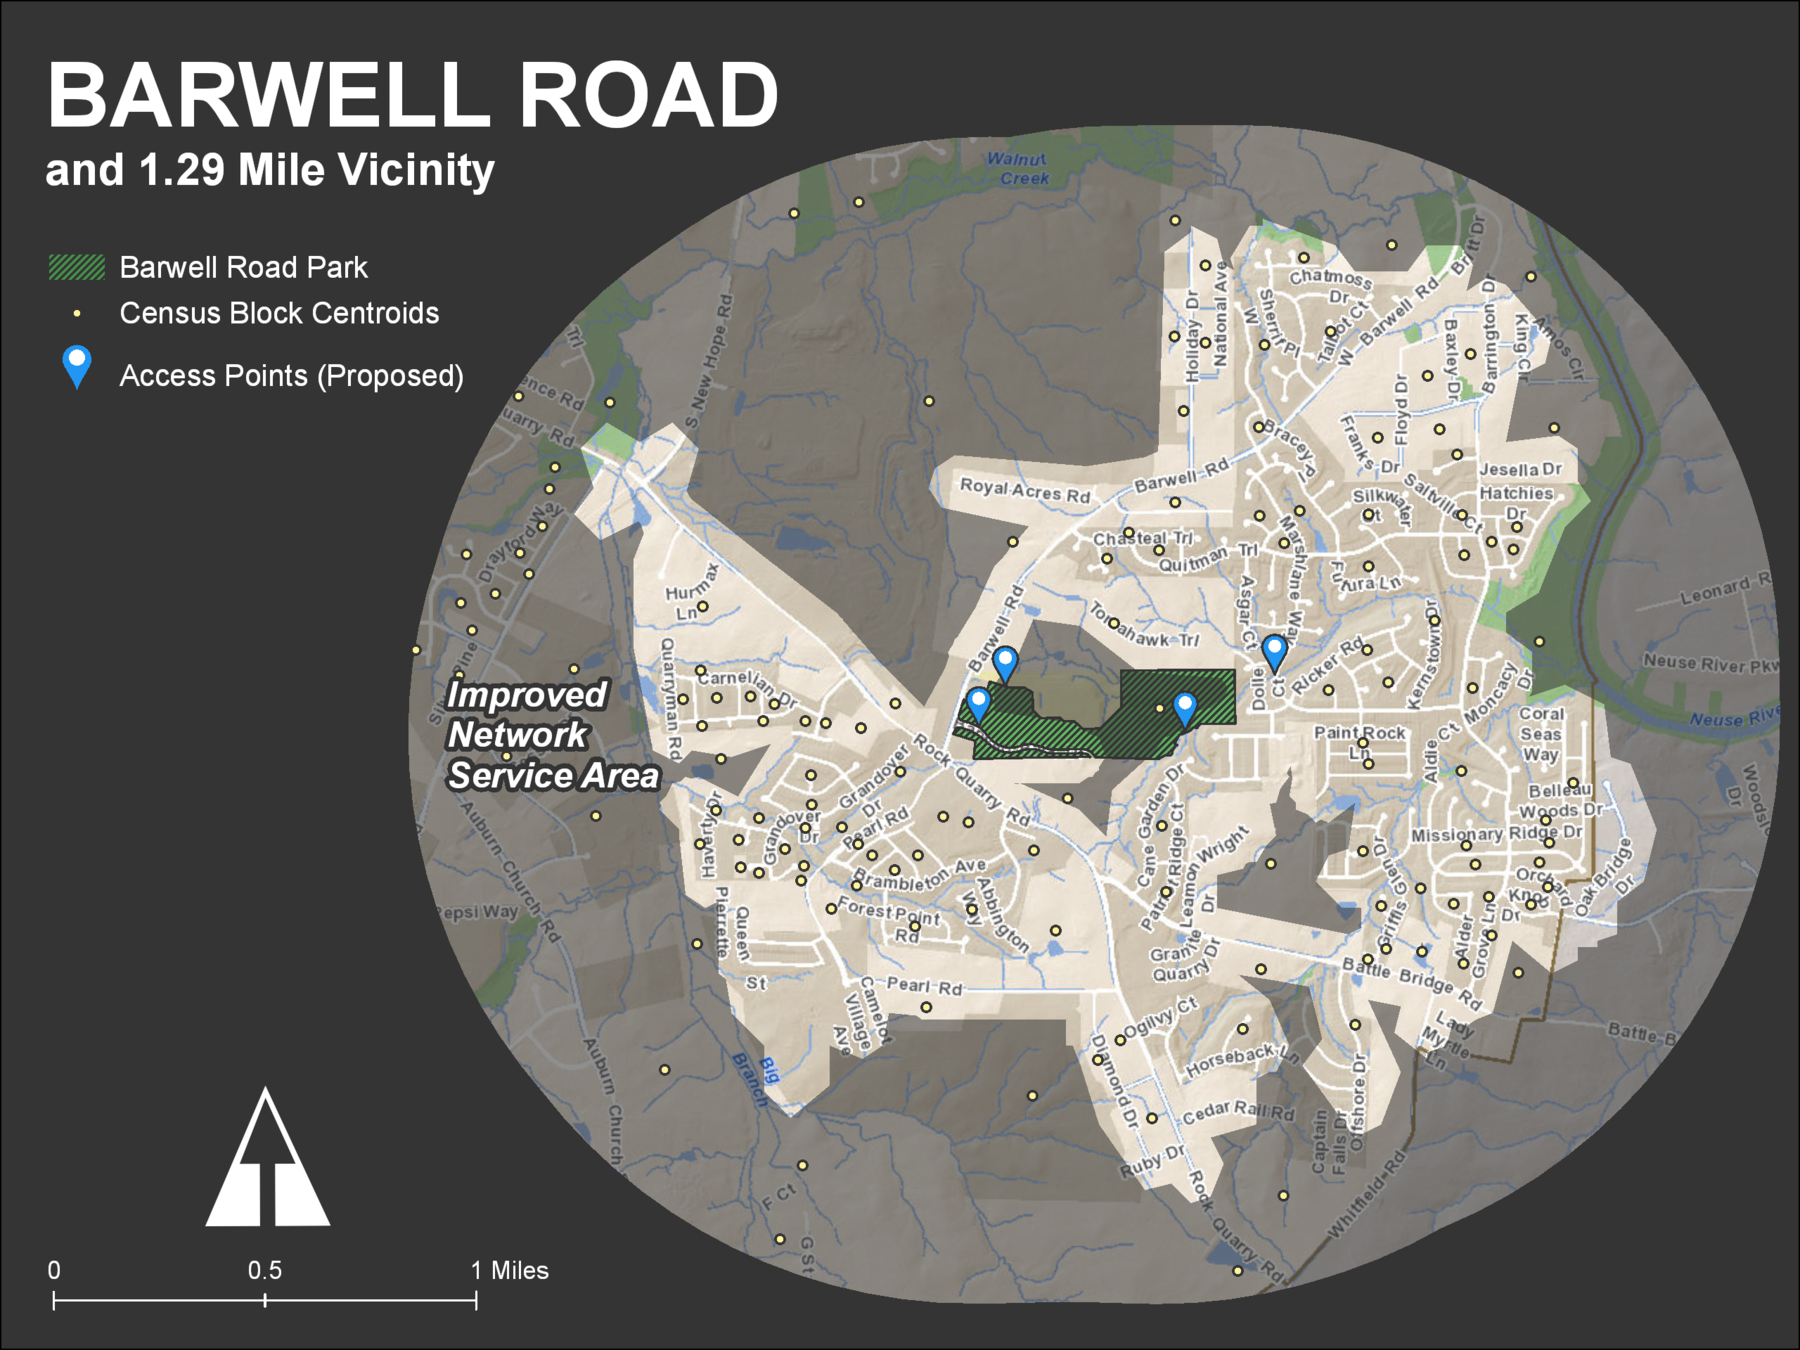
How can Raleigh's park system serve its population better?
Goal
Increase LOS by improving bike and pedestrian accessibility
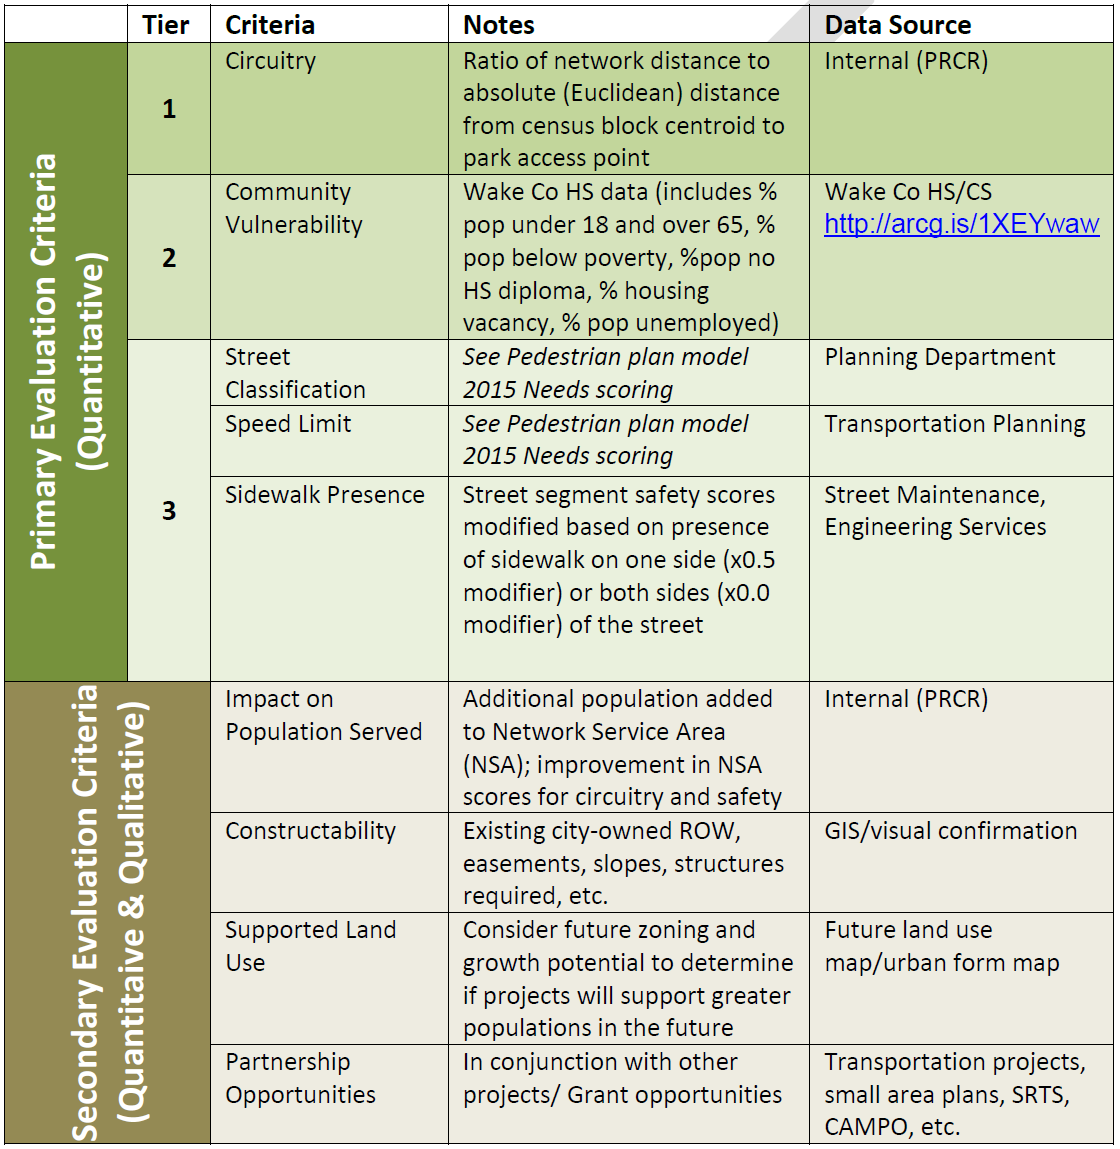
Evaluation Criteria
}
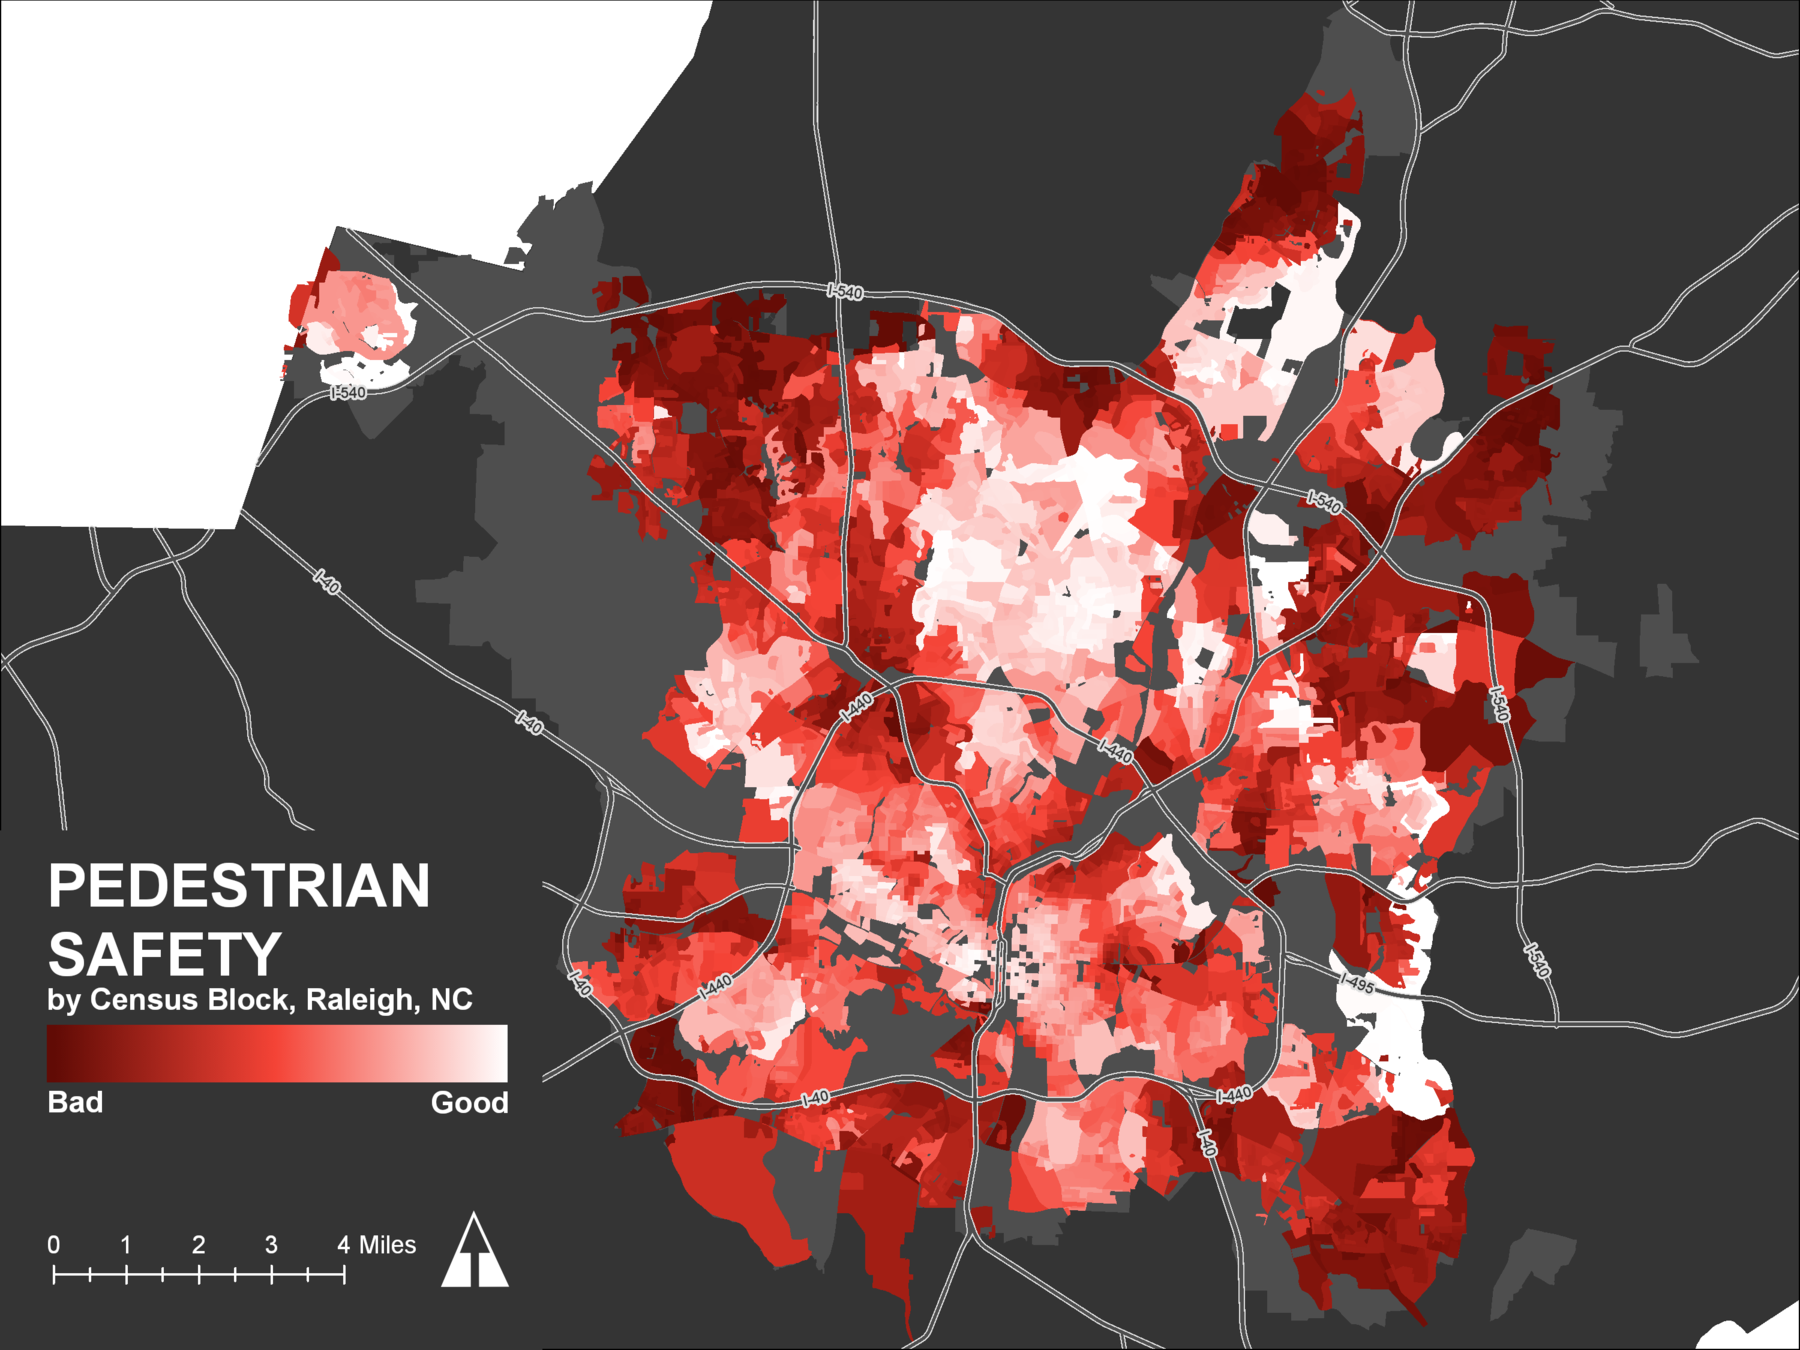
Pedestrian Safety
Blocks for Analysis Tool
Census Block Centroids
Parks
Census Block Centroids - Park 1
Step 1: Get Census Block Centroids within 1.29 mi of each park
Census Block Centroids - Park 2
Census Block Centroids - Park 3
Census Block Centroids - Park #
Distance to Park Tool
Census Block Centroid
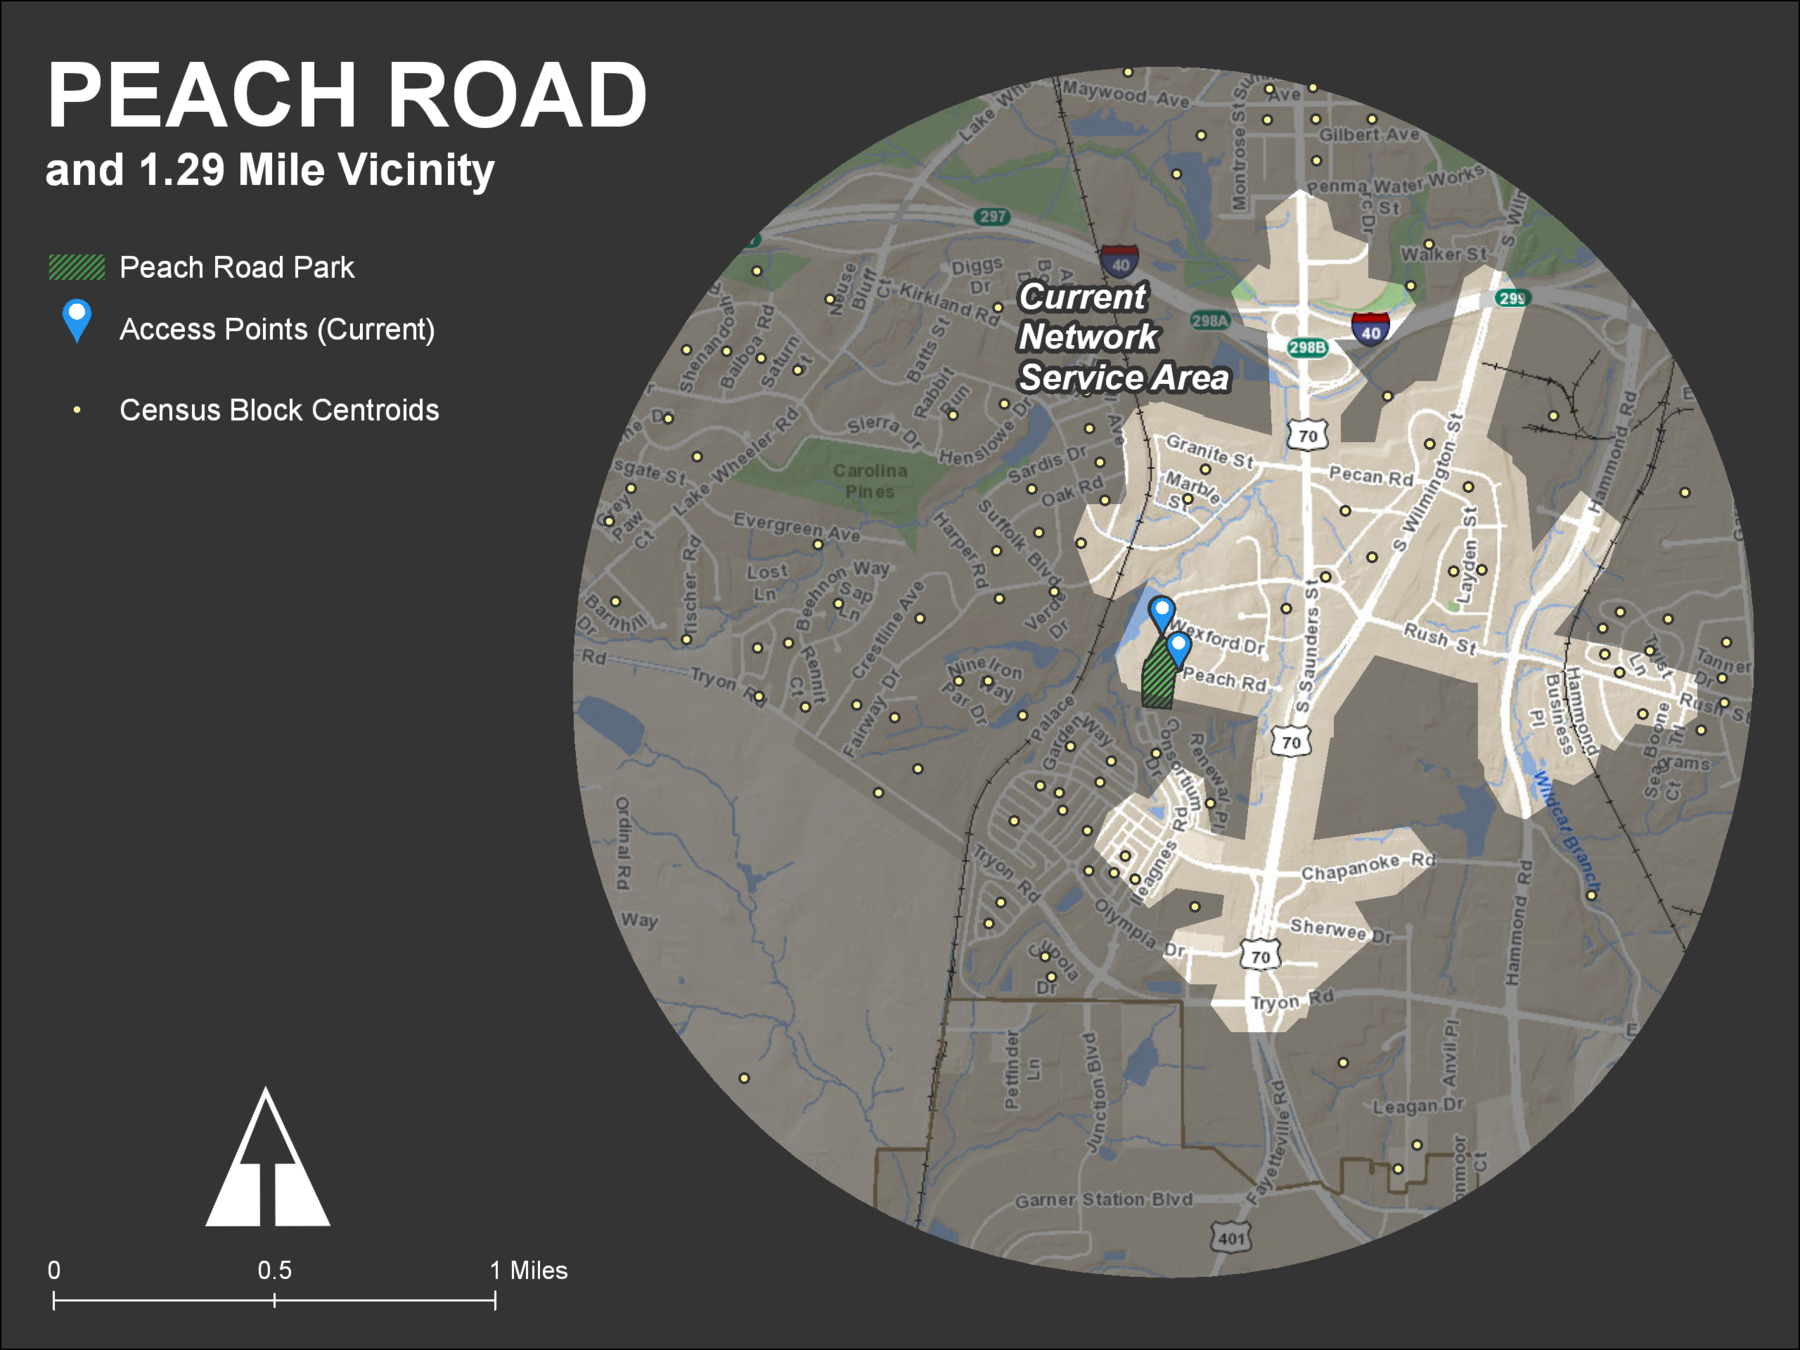
Transit + Greenway Network
Park Access Points
Closest routes to park
Step 2: Create closest route from each Census Block within 1.29 mi of each park
Prioritization Analysis Tool
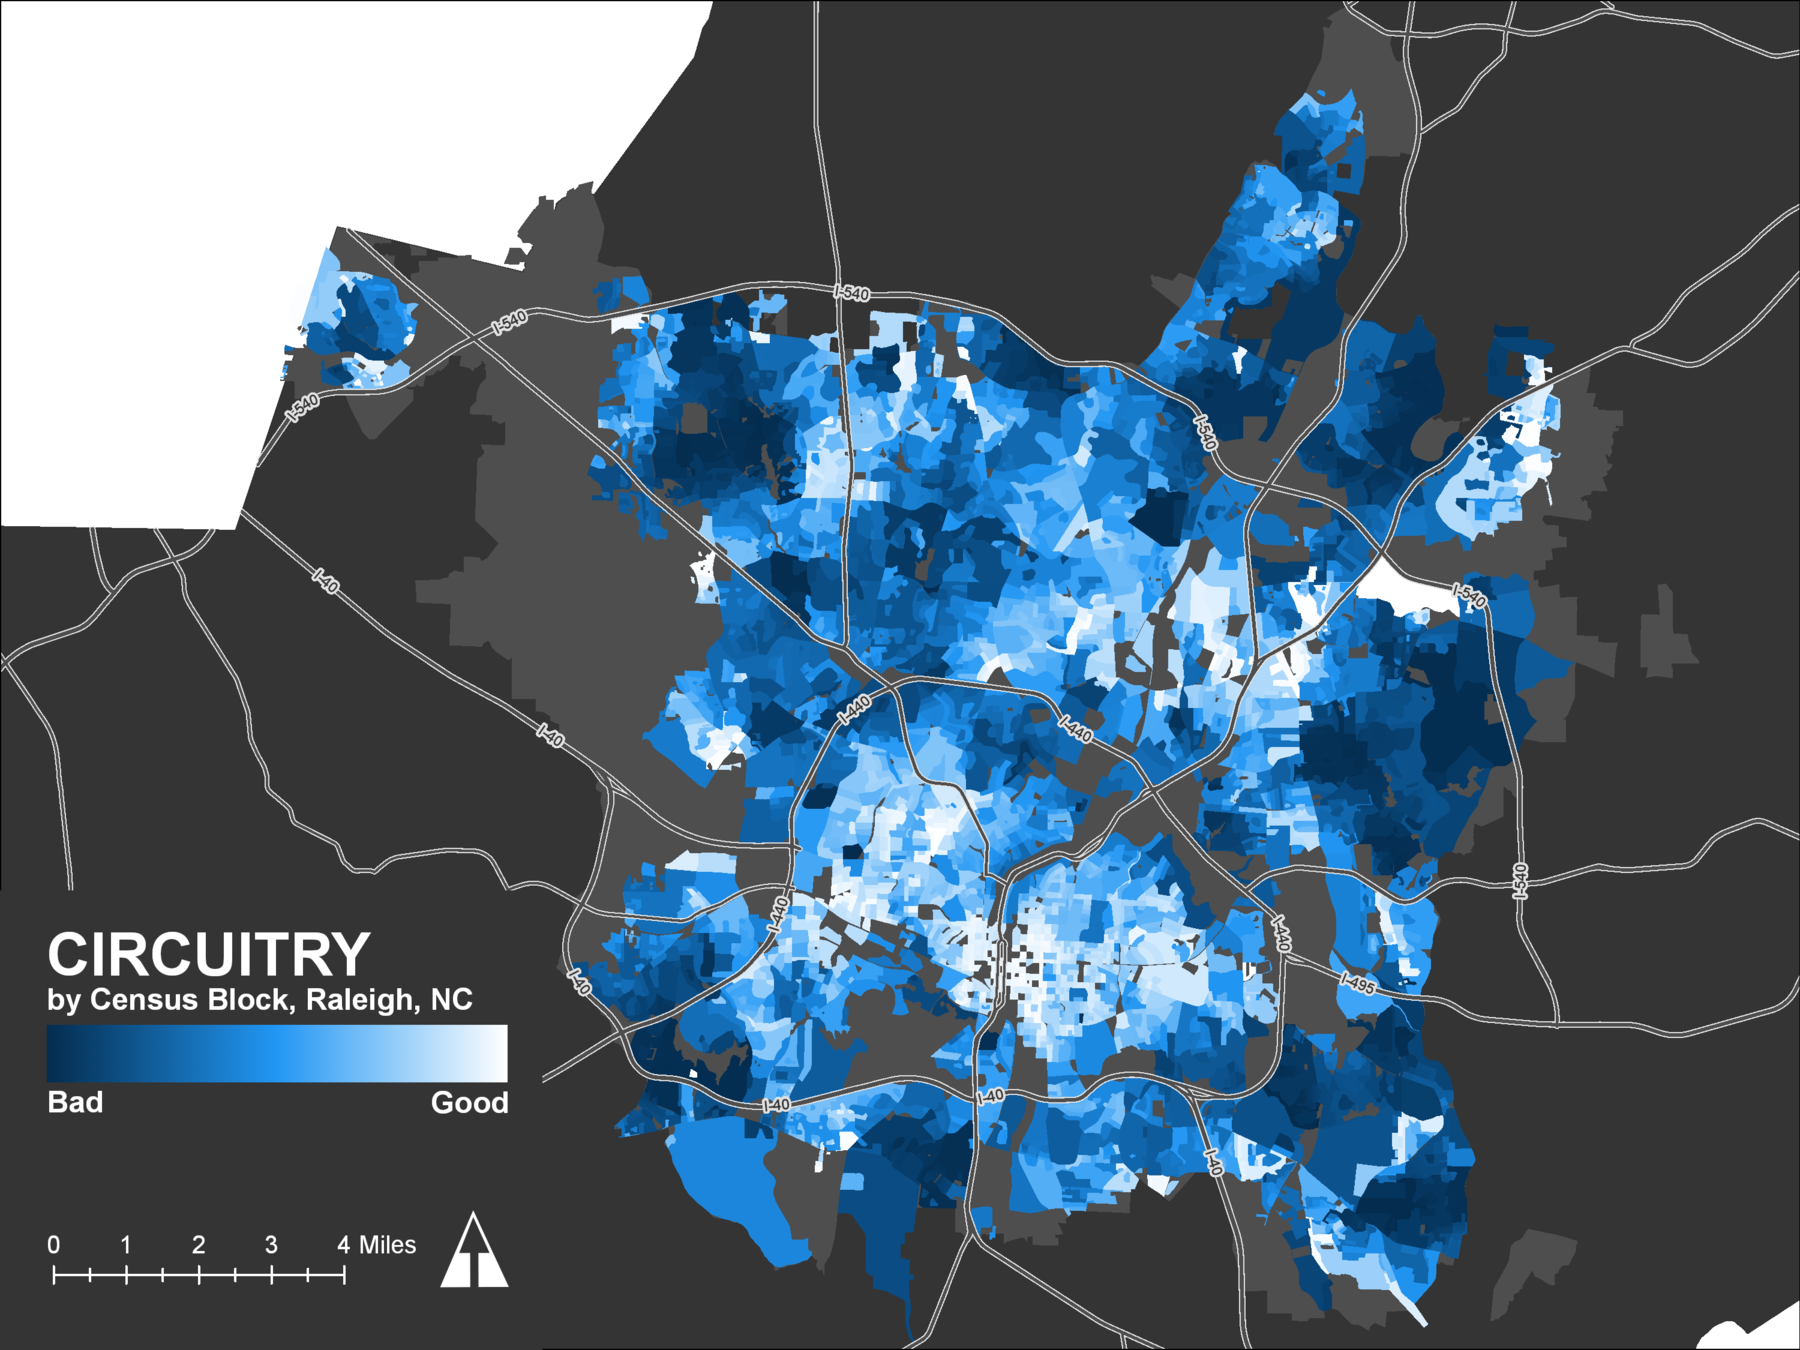
Closest routes w/ circuitry scores & ped safety scores
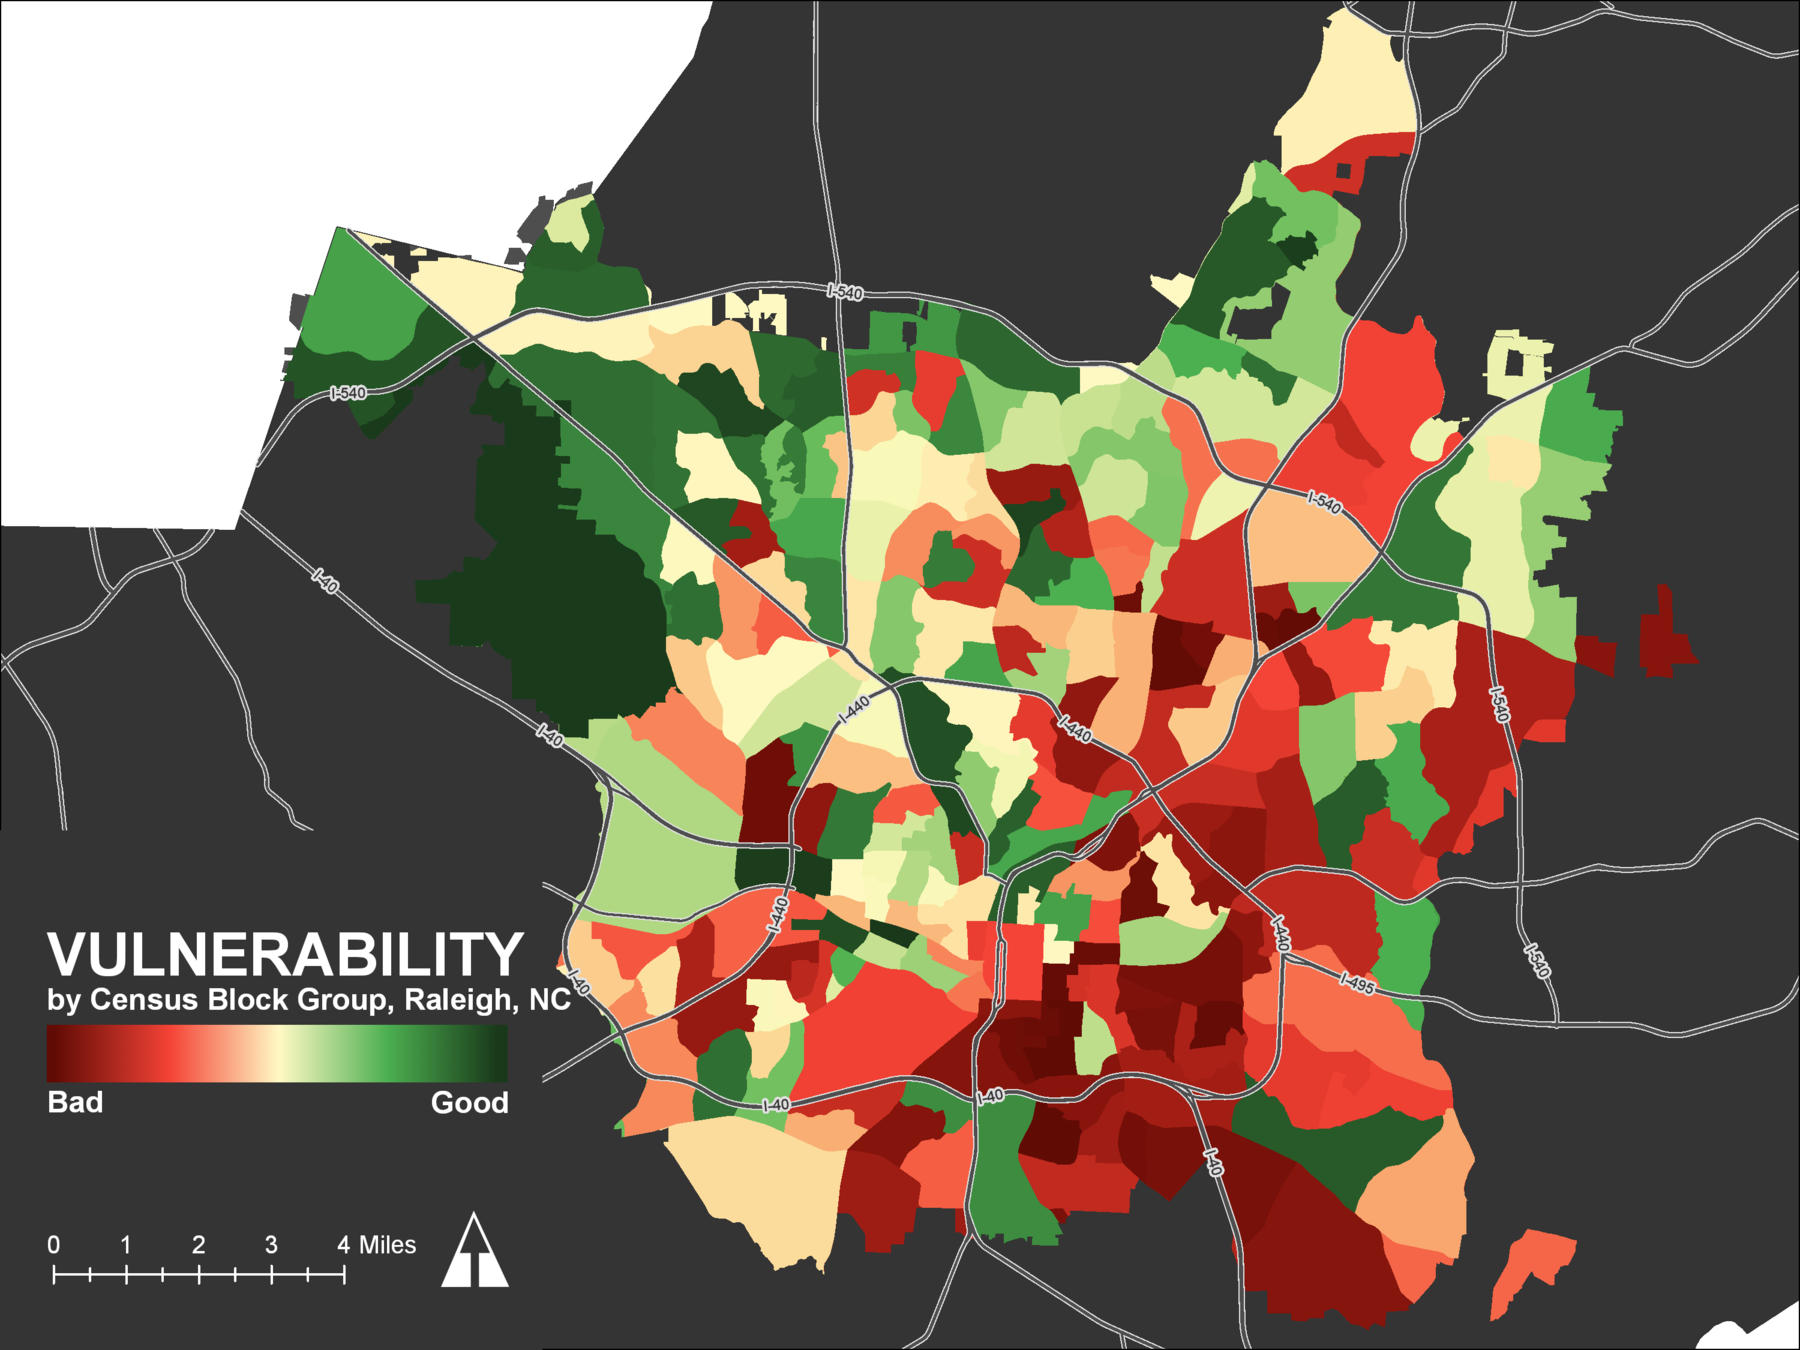
Wake County Vulnerability Data
Parks w/ ranks for circuitry, ped safety, and vulnerability
Step 3: Calculate Criteria and Score Parks
Parks
- Population: 748
- Safety Score: 10th worst
- Population: 3935
- Safety Score: 62nd worst
- Population: 5287
- Circuitry: 4th worst
- Population: 10,059
- Circuitry: 20th worst
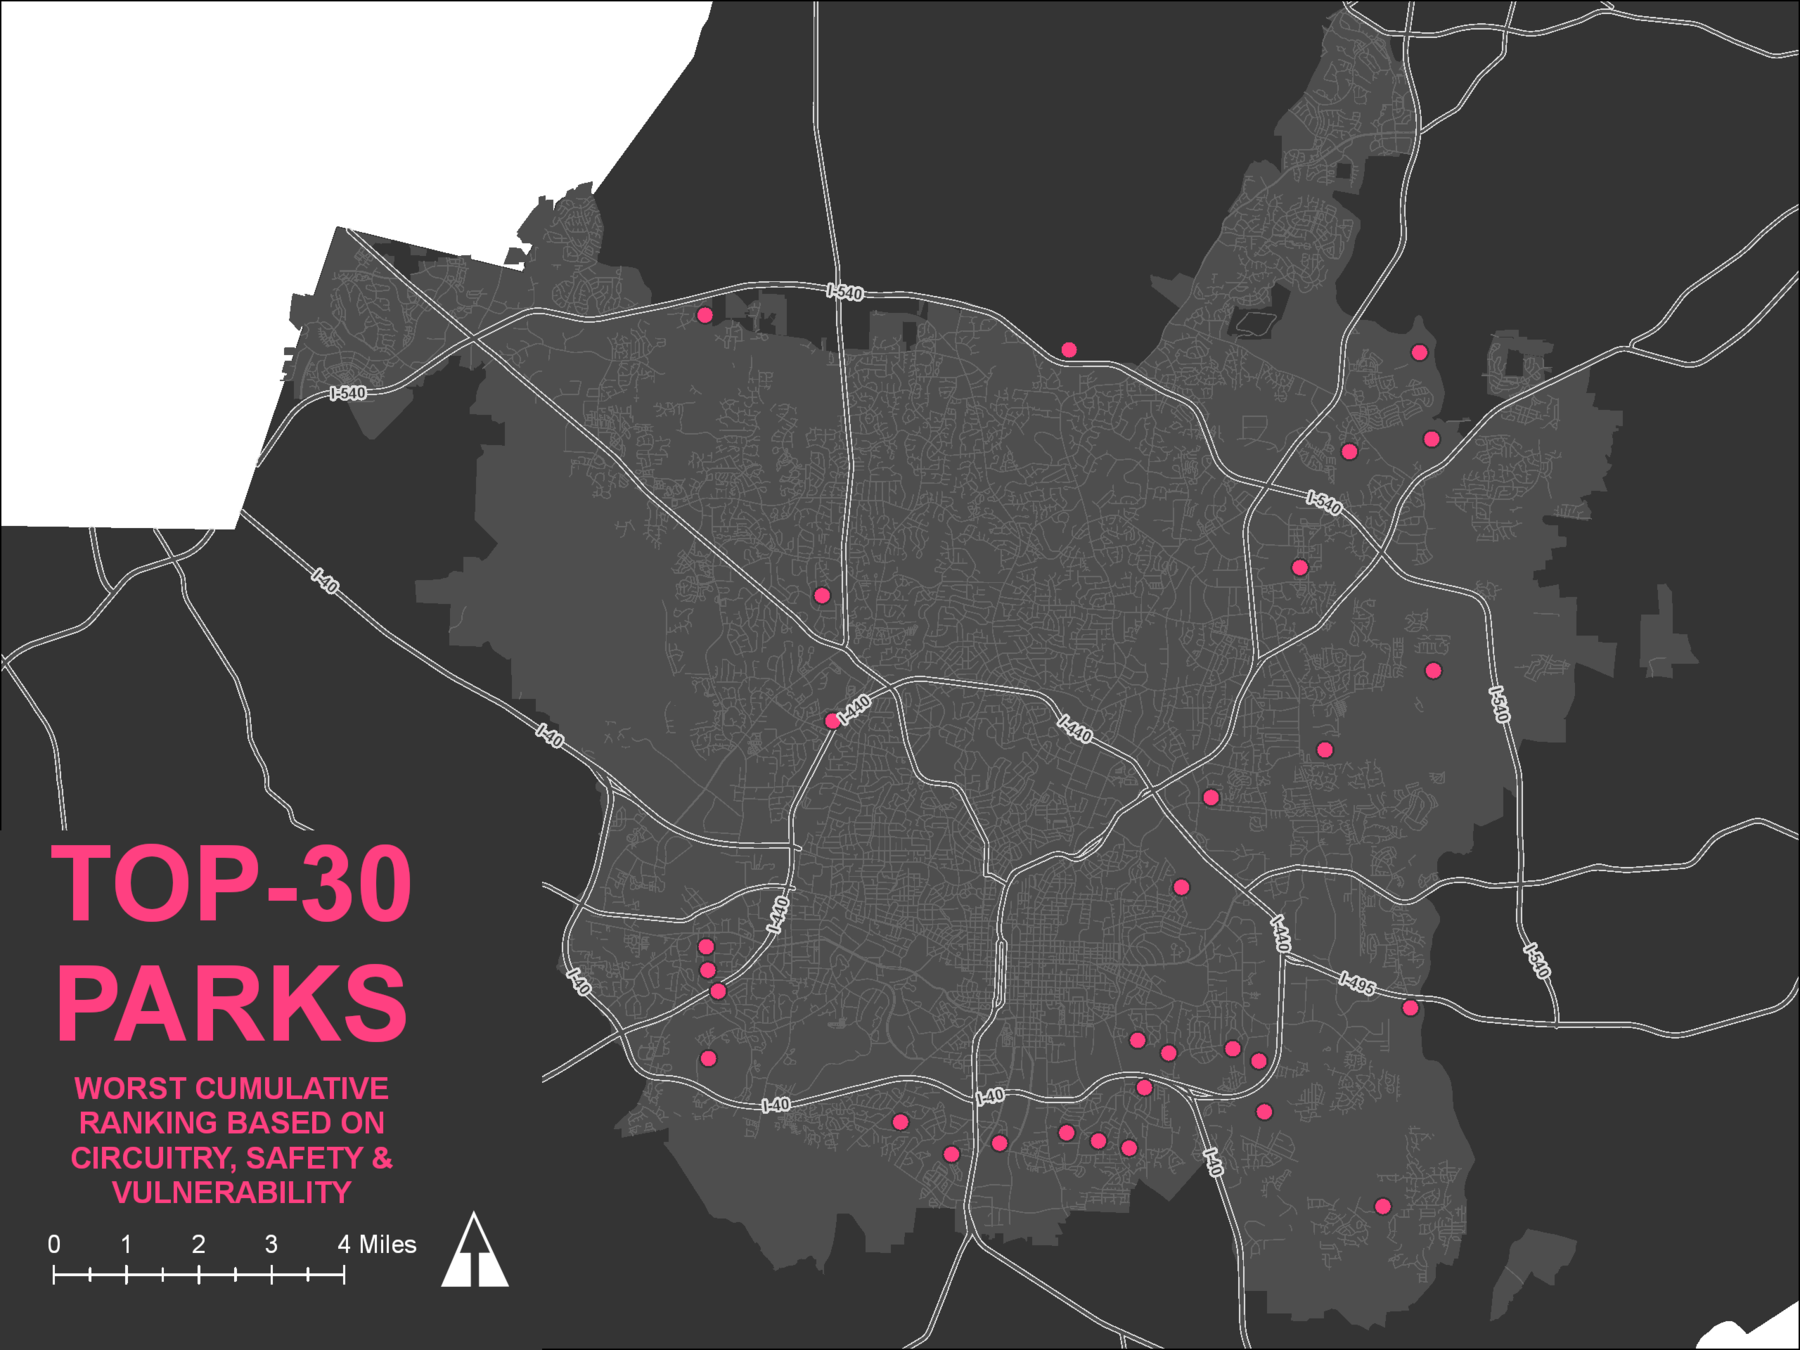
Looking forward
- Key driver for park development, land acquisition & capital improvement projects
- Scoring: Rank -> 0-based scores
- Make the model accessible
NCAUG 2017
By maptastik


