Detektion af regressioner hos Microsoft

Adam Lass, Jesper Rusbjerg, Nikolai Perlt og Rasmus Helsgaun
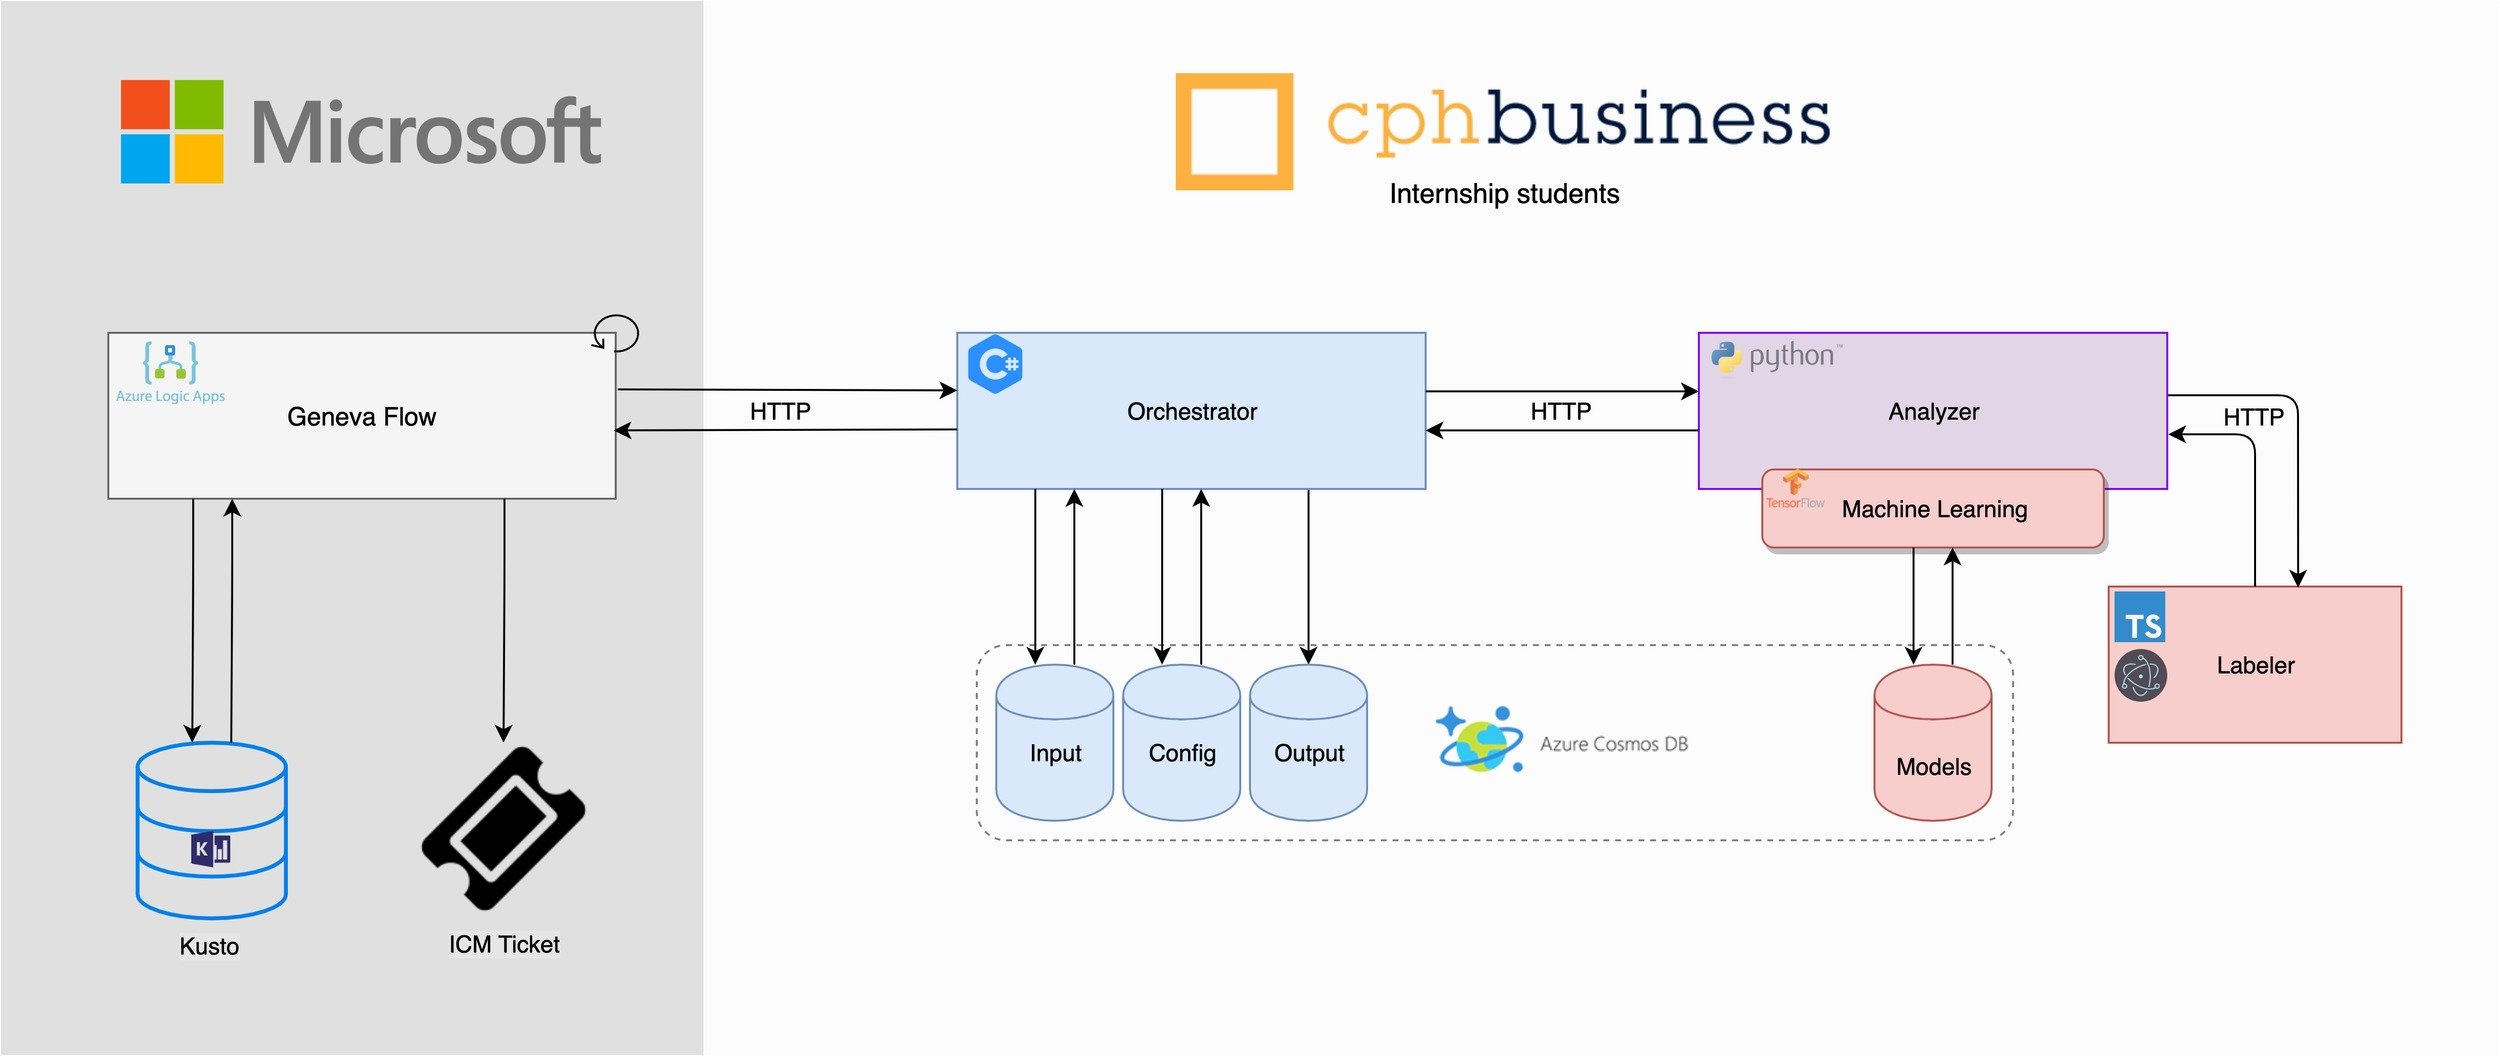
Løsningen
DEMO

Løsningen DEMO
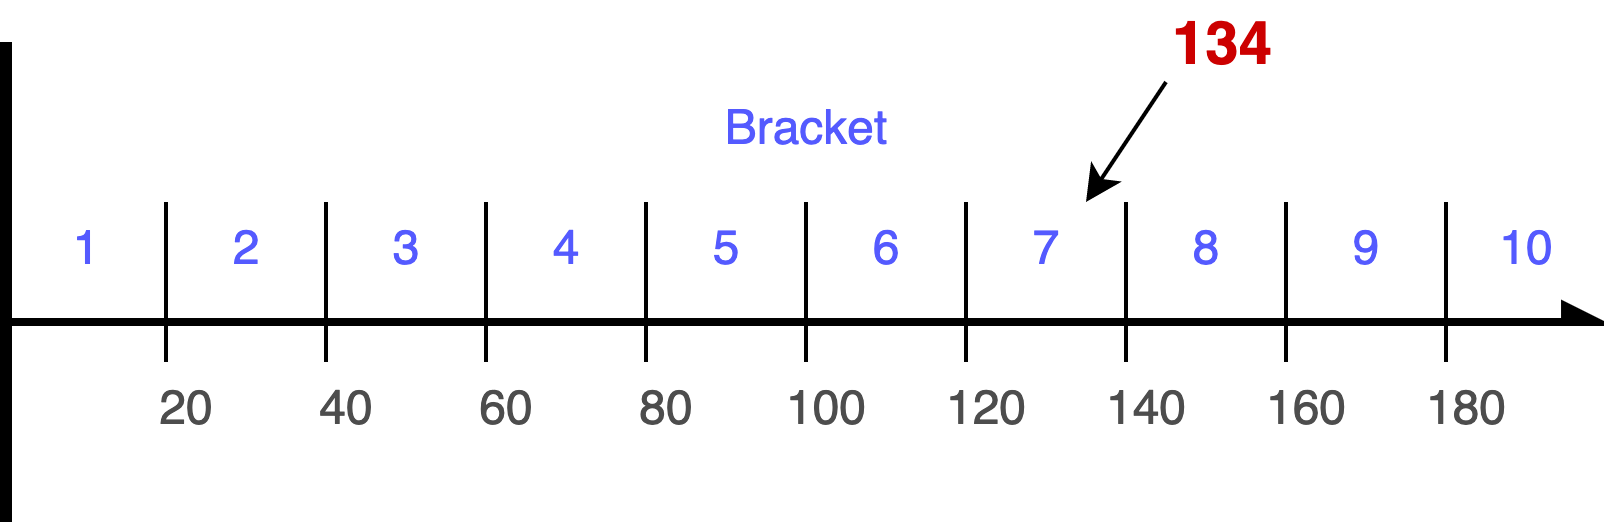
Bracketing Algoritme
Detected Regression
Bracketing Algoritme
Score calculation
User Impact
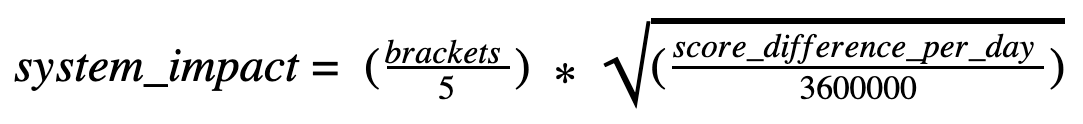
System Impact
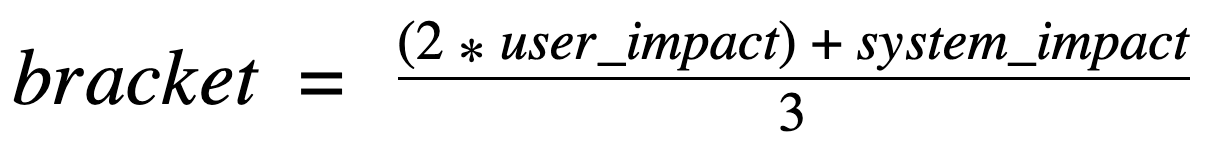
Bracket
Detected Regression
Bracketing Algoritme
Score calculation
User Impact
System Impact
Bracket
Detected Regression
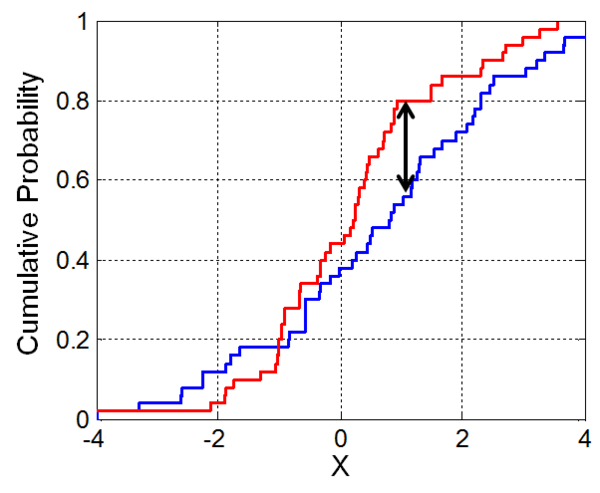
KS-test
D
Alpha = 0.05
Detected Regression
Bracketing Algoritme
Score calculation
User Impact
System Impact
Bracket
Score calculation
Old Runtimes
New Runtimes
Calculate Average Runtime
New Avg > Old Avg
No
return
Yes
Calculate Scores
Old Score = Old Avg * Old RPD
New Score = New Avg * New RPD
SDPD = New Score - Old Score
Calculated Values
Old Score
New Score
SDPD
New Avg
Old Avg
New RPD
Old RPD
Detected Regression
Bracketing Algoritme
Score calculation
User Impact
System Impact
Bracket
User Impact
Calculated Values
Old Score
New Score
SDPD
New Avg
Old Avg
Calculations
IQR = (Q3 - Q1 * 1.5) + Q3
Upper Bracket Limit = IQR * Old RPD
New RPD
Old RPD
User Impact
SDPD =
Detected Regression
Bracketing Algoritme
Score calculation
User Impact
System Impact
Bracket
System Impact
Calculated Values
Old Score
New Score
SDPD
New Avg
Old Avg
New RPD
Old RPD
User Impact
System Impact
Detected Regression
Bracketing Algoritme
Score calculation
User Impact
System Impact
Bracket
Calculated Values
Old Score
New Score
SDPD
New Avg
Old Avg
New RPD
Old RPD
User Impact
System Impact
Bracket
Detected Regression
Bracketing Algoritme
Score calculation
User Impact
System Impact
Bracket
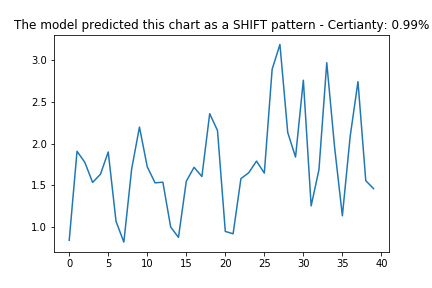
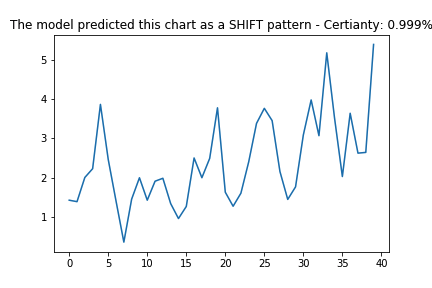
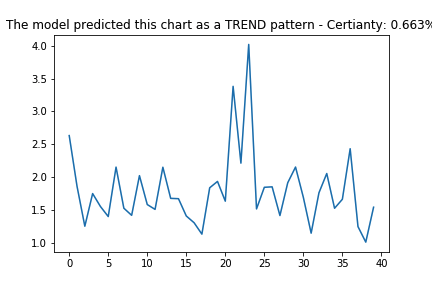
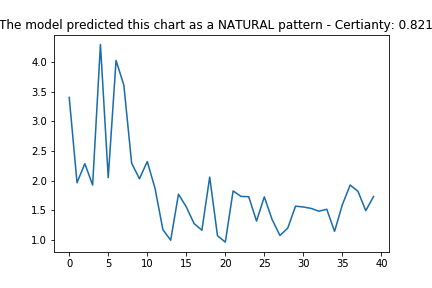
Machine Learning vs.
Statistics
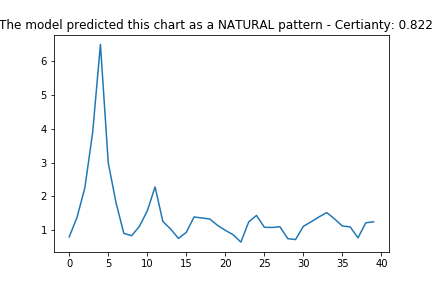
Natural
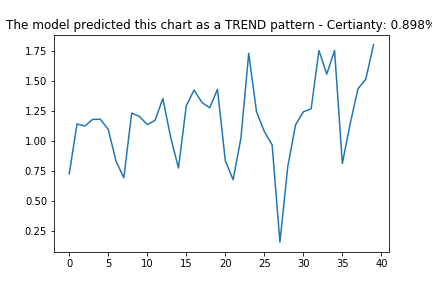
Trend
Shift
Machine Learning vs. Statistics
Machine Learning
Machine Learning vs. Statistics
Machine Learning
Machine Learning
- Flexible
- Multiple Variables
Pros
Cons
Machine Learning vs. Statistics
- Explainability
- Required loads of training data
Machine Learning vs. Statistics
Statistics
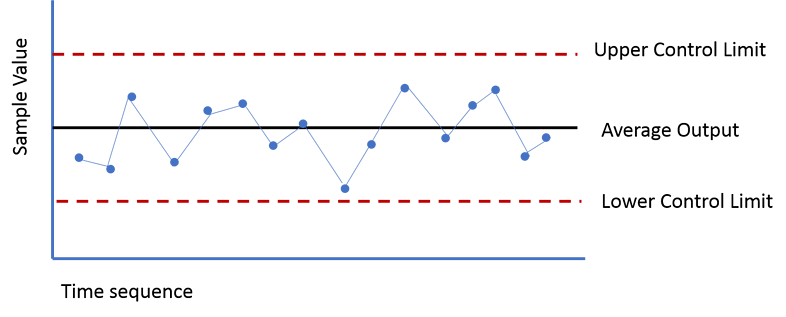
Control Charts
Machine Learning
Control Charts
- Flexible
- Multiple Variables
Pros
Cons
Machine Learning vs. Statistics
- Explainability
- Credability
- Single Variable
- Not Flexible
- Explainability
- Required loads of training data
- Works out of the box
Proces
Proces
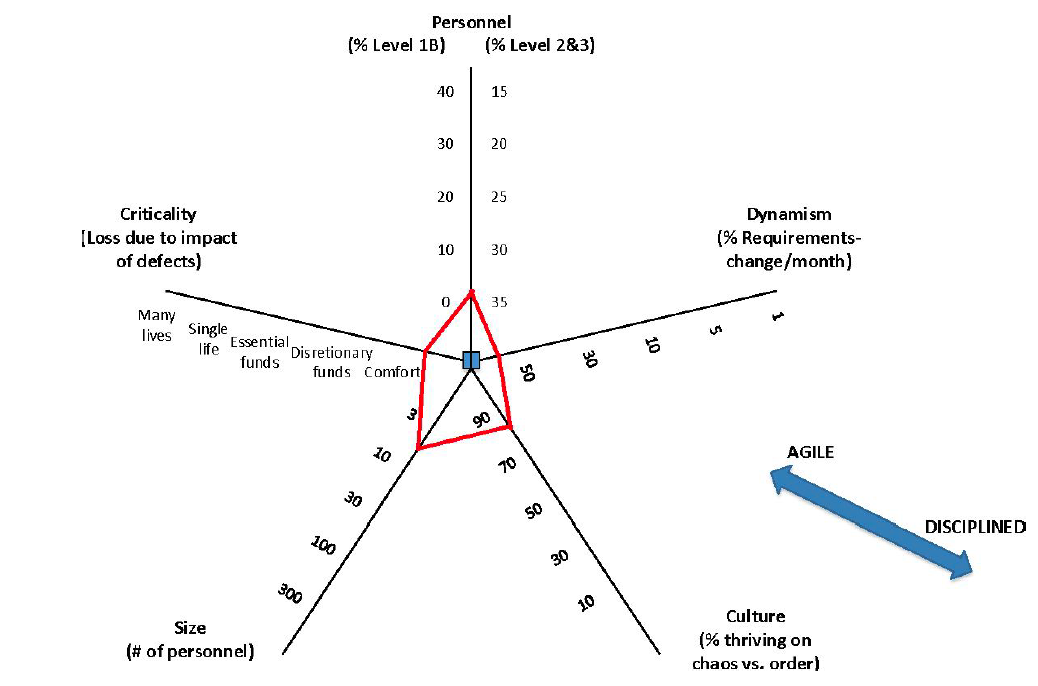
Bøhms & Turners Model
Overblik over proces
Scrum
Praktikforløb
Videreudviklingsforløb
XP
Backlog
Scrum Meetings
- Sprint Planning
- Sprint Review
- Retrospective
- Stand-up
Scrum Master
Product Owner
Sprints
Backlog
Scrum Meetings
- Sprint Planning
- Sprint Review
- Retrospective
- Stand-up
Scrum Master
Product Owner
Sprints
Pair Programming
Collective Ownership
Continuous Integration
Refactoring
Planning Game
Pair Programming
Collective Ownership
Continuous Integration
Refactoring
Planning Game
Ikke anvendt
Delvist anvendt
Anvendt
Spørgsmål?
Praktik Hovedopgave - Microsoft
By Adam Lass


