Code Execution Analysis
In Mobile Apps
Wait. I know GDB.
I don't need this...
So, let's try another title...
How not to shoot yourself in the foot while debugging Mobile apps

About Me
Abdullah Joseph / @MalwareCheese
Mobile Security Team Lead @ Adjust
We do mobile attribution, ad fraud analysis and some data stuff (processing 25 petabytes every 10 days received 😱)
I like binary stuff
Crypto stuff too. Not so much web and network stuff
Bonus only for Nanosec: I graduated from APU. Bachelor's in Game Design
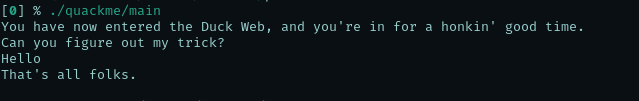
Let's start with a CTF

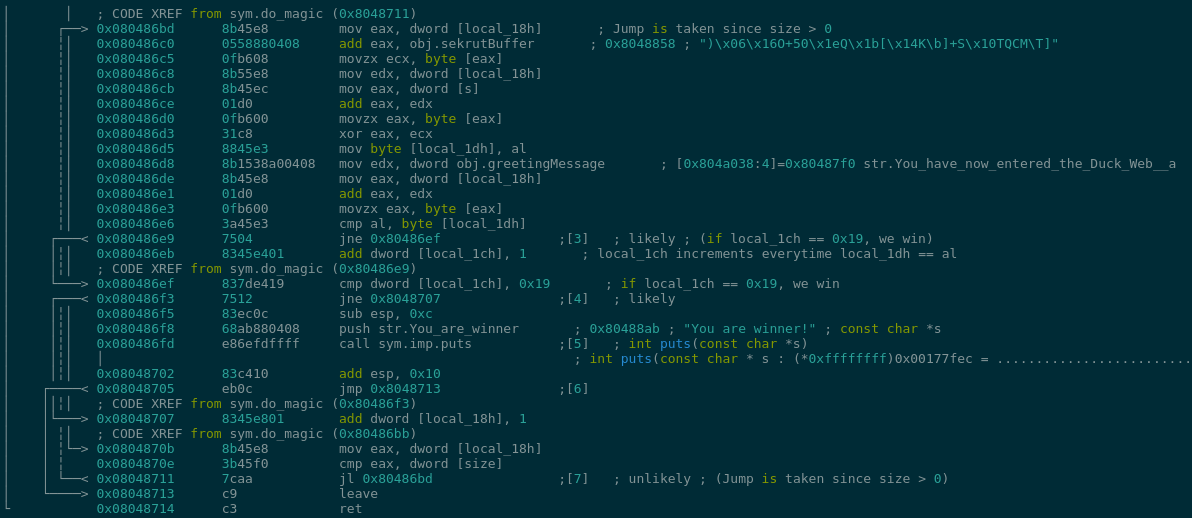
Findings
-
Code block takes input and puts it in [s]
-
obj.sekrutBuffer holds the following byte blob:
)\x06\x16O+50\x1eQ\x1b[\x14K\b]+S\x10TQCM\T]
-
At 0x080486d3, our input and obj.sekrutBuffer get XORed together
-
The result has to equal obj.greetingMessage which gets compared together in 0x080486e6
What did we learn?
Debugger == God Mode
Switching to Mobile
Let's go for Android
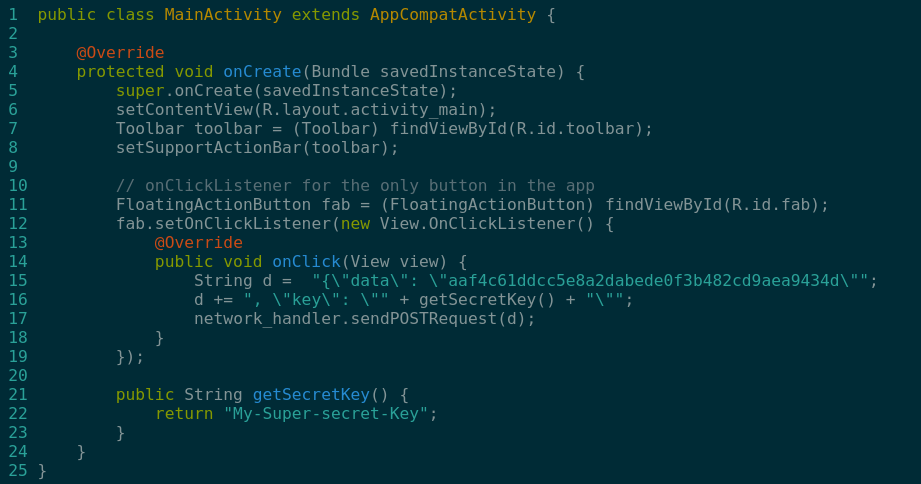
How do we get the output of getSecretKey() dynamically?
-
Disassemble the app (with “apktool” or similar tool)
-
Set the “app:debuggable” flag to true
-
Rebuild the app
-
Sign the app (with Appium’s Sign.jar or similar)
-
Decompile the app to get the Java sources (with CFR decompiler or jadx)
-
Setup a gradle project inside the decompiled sources
-
Setup an IDE, like Android Studio, and port the decompiled java code to it
-
Setup the testing device to have that app in the “Wait for debugger” list of apps in “Settings” -> “Developer Mode”
-
Setup breakpoints on the “getSecretKey()” function
-
Run the app. It should say “Wait for Debugger” now
-
Use JDWP to run the app and break at “getSecretKey()” function
-
Examine the return value
More info here: https://stackify.com/java-remote-debugging/

Let's talk about
binary instrumentation
Also known as "Function Hooking"
The ability to insert a practically unlimited amount of code at any location in a binary to observe or modify that binary’s behavior
-- Dennis Andriesse - Practical Binary Analysis
So now...
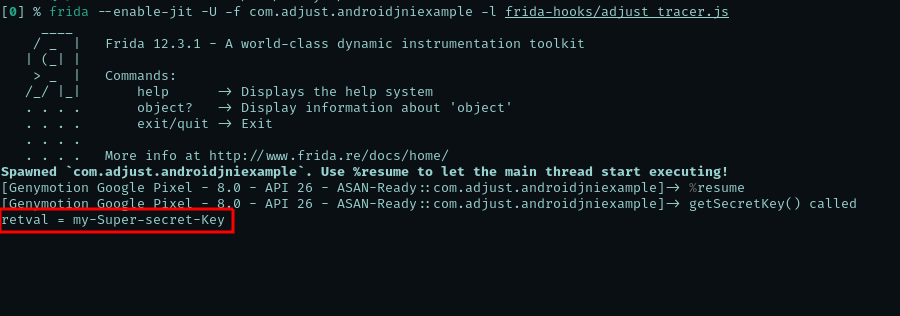
How do we get the output of getSecretKey() dynamically?
// myagent.js
// ===================
Java.perform(() => {
  let activity = Java.use("com.adjust.myapp.MainActivity");

  Activity.getSecretKey.implementation = () => {
    var retval = this.getSecretKey(this, arguments);
    console.log("getSecretKey() called");
    console.log(`retval = ${retval}`);

    return retval;
  };
});
// ===================

// Run with:
// $ frida -U -f com.adjust.myapp -l myagent.js


Fallbacks
AKA: What Frida cannot do / is not
- Not a ptrace-based debugger
- LLDB and GDB are debuggers capable of deep analysis of every Instruction
- Frida HAS a lot of debugger functionality, but its main purpose is to aid in binary analysis and hook into parts of the binary to execute arbitrary instructions
- What this means is that, if you're intending to step-into every function and analyze it's execution, it might be better to use LLDB/GDB
Fallbacks
AKA: What Frida cannot do / is not
-
Not the only instrumentation framework
- DynamoRIO (open-source & free)
- Intel PIN (free but closed-source)
However, it is the easiest one to use and the only one that supports multiple architectures and VM environments (AKA: Android and iOS) by default.
Use Case #1
Analysis: Memory Dumper & Scanner
$ memdumper/memdump.py -U -p com.myapp.adjust -v
INFO:Starting Memory dump...
DEBUG:Too big, splitting the dump into chunks
DEBUG:Number of chunks: 80
DEBUG:Save bytes: 0x12C00000 till 0x13589680
DEBUG:Save bytes: 0x13589680 till 0x13F12D00
DEBUG:Save bytes: 0x13F12D00 till 0x1489C380
DEBUG:Save bytes: 0x1489C380 till 0x15225A00
DEBUG:Save bytes: 0x15225A00 till 0x15BAF080
...
DEBUG:Save bytes: 0x223F4900 till 0x22D7DF80
DEBUG:Save bytes: 0x22D7DF80 till 0x23707600
DEBUG:Save bytes: 0x23707600 till 0x24090C80
DEBUG:Save bytes: 0x24090C80 till 0x24A1A300
DEBUG:Save bytes: 0x24A1A300 till 0x253A3980
DEBUG:Save bytes: 0x253A3980 till 0x25D2D000
DEBUG:Save bytes: 0x25D2D000 till 0x266B6680
DEBUG:Save bytes: 0x266B6680 till 0x2703FD00
DEBUG:Save bytes: 0x2703FD00 till 0x279C9380
DEBUG:Save bytes: 0x279C9380 till 0x28352A00

$ strings -n 5 dump/*.data | uniq | ack -i secret
THIS IS A SECRET STRING!!!
THIS IS A SECRET STRING!!!
THIS IS A SECRET STRING!!!
THIS IS A SECRET STRING!!!
Use Case #2
Native Android Function Hooker
10x times easier than GDB or LLDB scripting (!)
[0] % native_stalker/native_stalker.py \                                                                                                                                <<<
    --process com.myapp.adjust \
    --library libnative-lib.so \
    --addr 0x00009610 \
    --binary /path/to/my/app/libnative-lib.so \
    --verbose
INFO:Analyzing with R2...
INFO:Retrieving PLT section...
INFO:.plt [0x8AE0] -> [0x92D0]
INFO:Prepping Frida...
INFO:Resuming process...
INFO:Hooking library loaders...
JS: loaders(): {"0":"libnative-lib.so","1":38416,"2":35552,"3":37584}
INFO:Awaiting hook callbacks...
JS: Library [native-lib] loaded with java.lang.String.loadLibrary
[+] JS: stalk_func(): {"0":"libnative-lib.so","1":38416,"2":35552,"3":37584}
[+] JS: Library base addr: 0x8b2c1000
[+] JS: Hooking [0x8b2ca610]...
INFO:Tracing 38416@libnative-lib.so concluded with 11 calls:
        0x8b80 -> sym.imp.free
        0x8c40 -> fcn.00008c40
        0x8b30 -> fcn.00008b30
        0x8b90 -> fcn.00008b90
        0x8c50 -> fcn.00008c50
        0x8b40 -> sym.imp.fopen
        0x8ba0 -> fcn.00008ba0
        0x8bc0 -> fcn.00008bc0
        0x8b70 -> sym.imp.getline
        0x8c30 -> fcn.00008c30
        0x8b20 -> sym.imp.__android_log_vprint
INFO:Done. You can exit the script now...
Misc
-
Dynamic Analysis
- Trace any (Dalvik/Objc/Native) function
- Dump saved files
- Memory scanner
- Automated crypto keys scanner
- One-time watchpoints
- Monitor file system access
- SSL pinning bypass
-
Code Execution
- Invoke app functionality under controlled circumstances
- Modify device properties (great for regression tests)

We are hiring Binary Dudes and Dudettes!

Code Execution Analysis in Mobile Apps - Nanosec 2019
By afjoseph