Serra Hunter @ UPC
Ahcène Boubekki
UCPH, Denmark
Short Resume
Short Resume
Name:
Ahcène Boubekki
Background:
Mathematics
(complex geometry, algebraic geometry...)
Currently:
Post-Doc @ PTB/TU Berlin
PhD:
Analysis of User Behavior
Previously:
Post-Doc @ UCPH/Pioneer Centre for AI
Researcher @ TU Munich
Researcher/PhD @ DIPF/TU Darmstadt (~Frankfurt)
Researcher/PhD @ Leuphana (~Hamburg)
Post-Doc @ UiT Arctic University of Norway
Short Resume
Main Research Topics
1. Representation Learning
2. Explanability/Interpretability


1. Representation Learning
2. Explanability/Interpretability
Self-explainable Models
Model Inspection
Learning Representations
Representing for Learning
Previous Research
PhD Thesis
The mBook Project
Objectives
Evaluate the use of an electronic textbook for history in middle school
Bring new methods to Educational Science
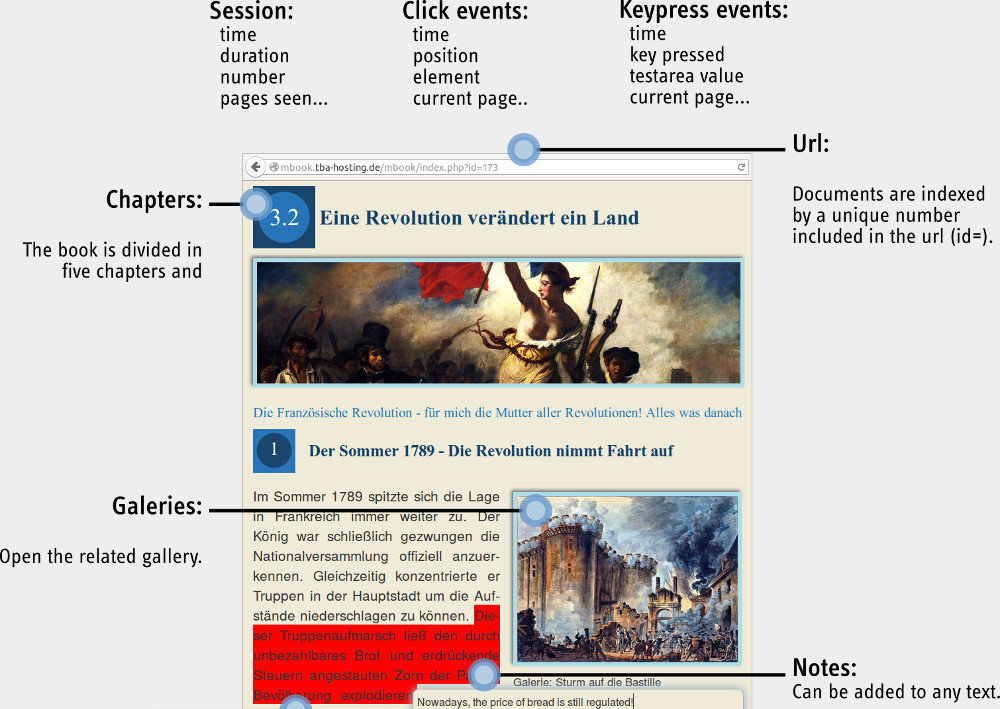
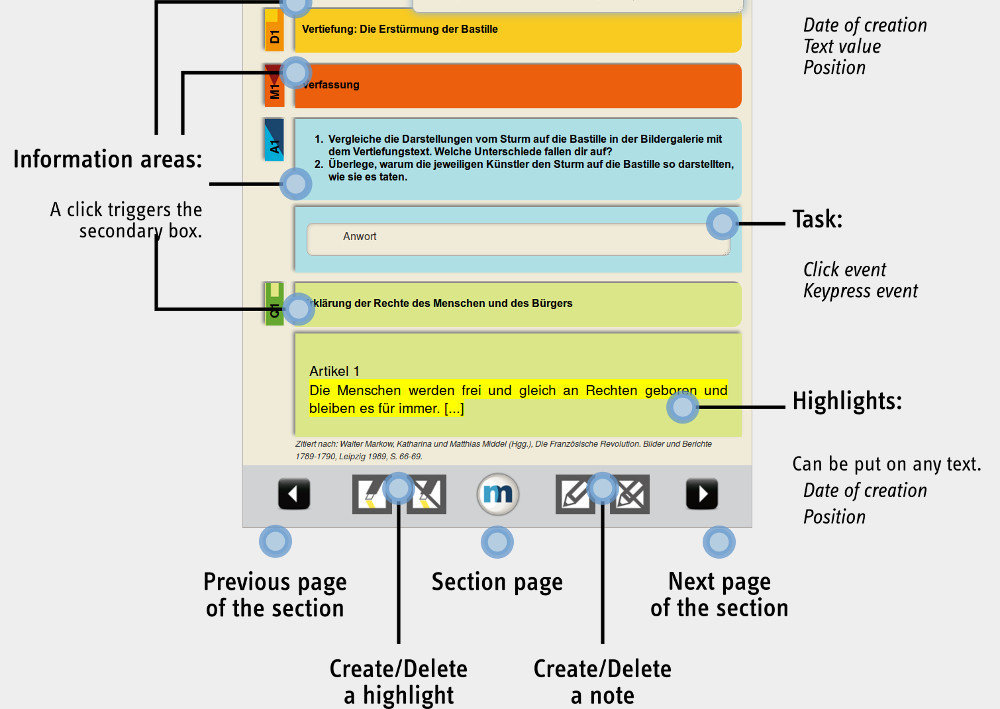
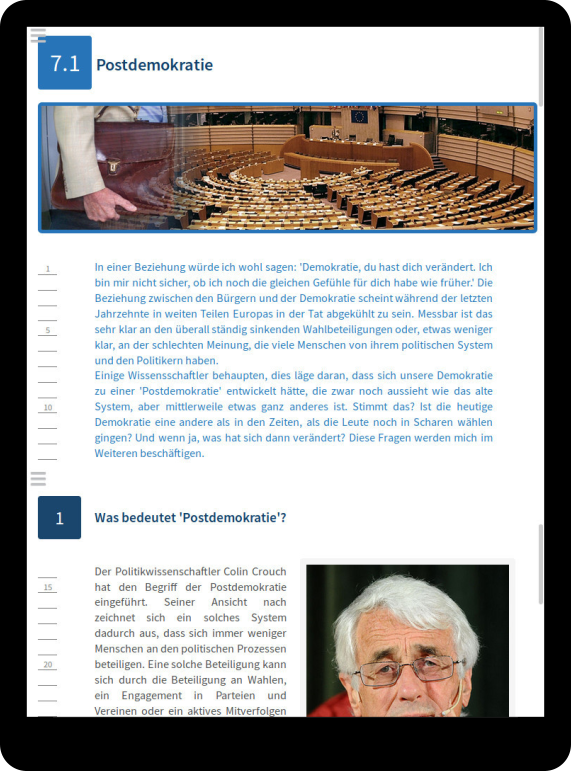
The mBook
The mBook Project
Some statistics

From January 31st to July 11th 2017
2,197 sessions
400 users
195 pupils (537 sessions)
The mBook Project
Classical Approaches
Bi-variate factor analysis

Markov Chains
Contributions
Contributions
Same Data
Different Models
Different Representations
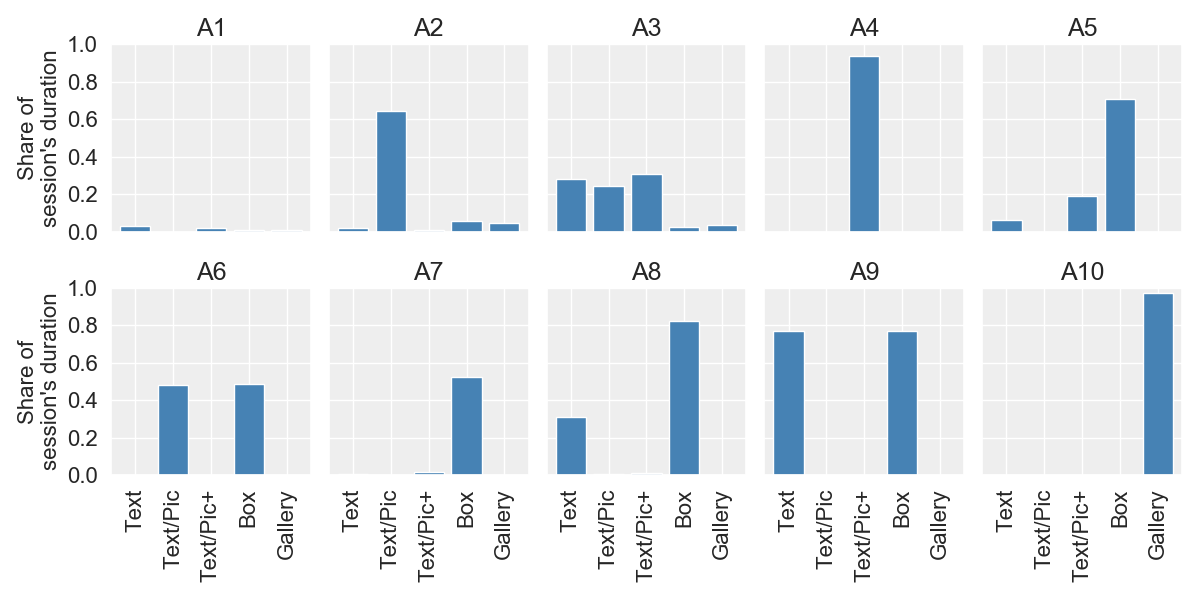
Content Analysis
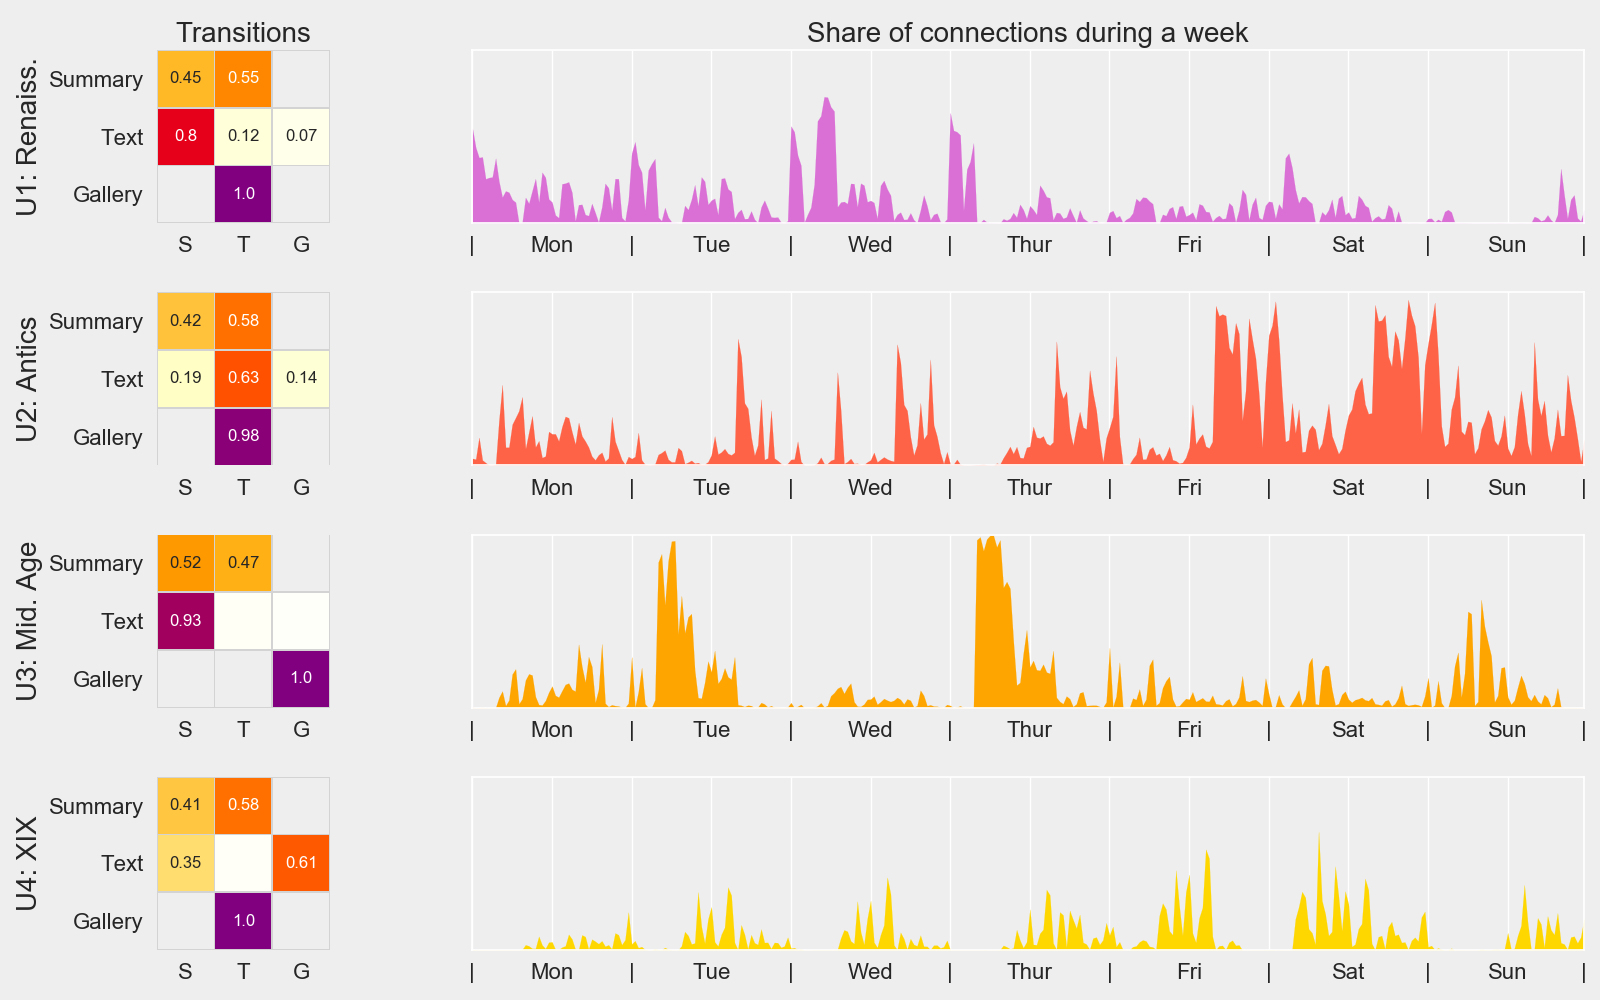
Periodic Behaviors
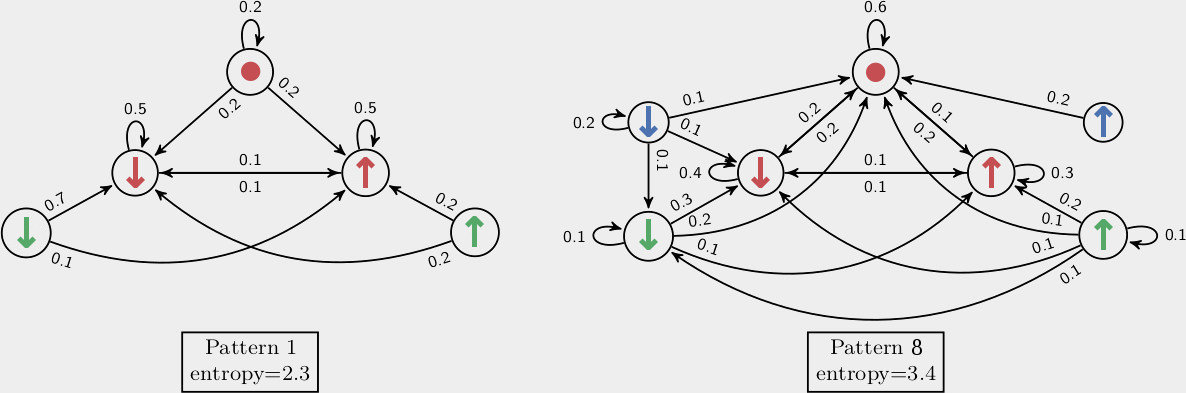
Scrolling Behaviors
Online Behaviors
Is there a correlation between content and motivation?
Do the pupils use the mBook the same way over the week?
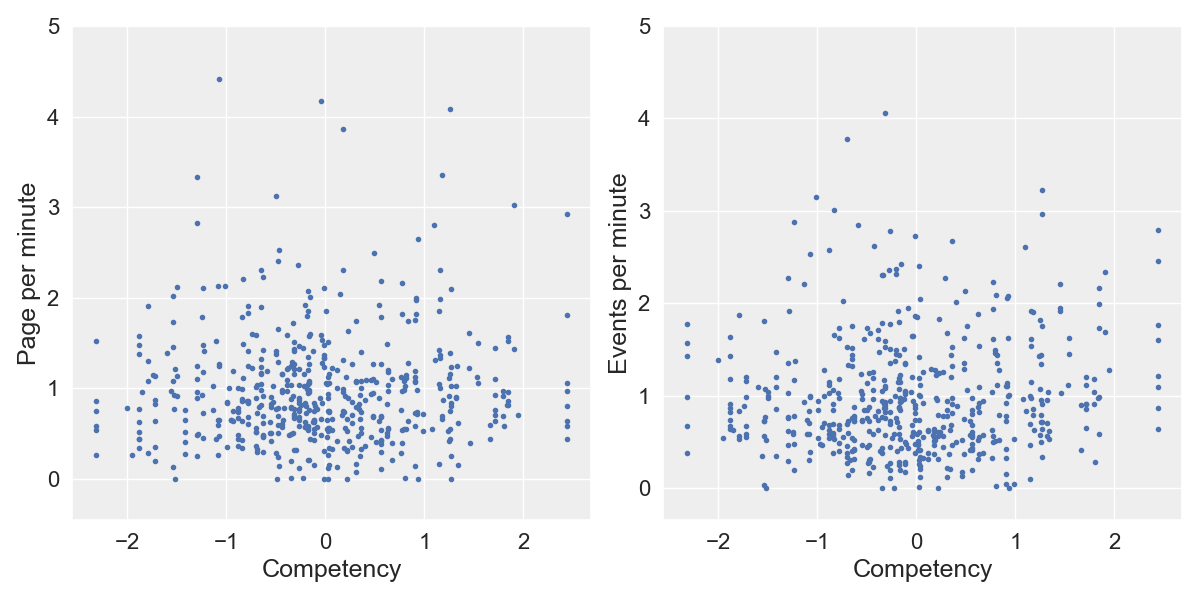
Are scrolling patterns correlated with competencies?
What is the influence of the teacher?
Content Analysis
Model: Archetypal Analysis
Repr.: Frequency Vectors
How to use AA instead of factor analysis?
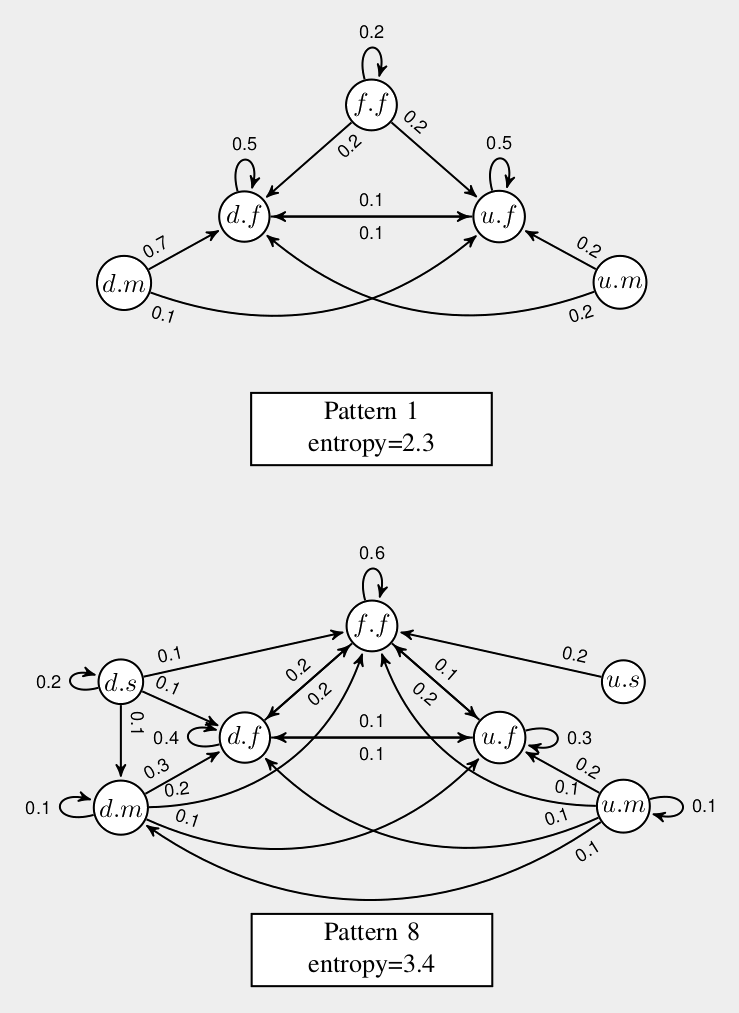
Periodic Behaviors
Model: Mixture of Markov Chains
Repr.: Discrete Sequences
Can we make MMCs temporally aware?
Scrolling Behaviors
Model: Infinite/Bayesian MMC
Repr.: Discrete Sequences
How to do data-driven the model selection?
Online Behaviors
Model: Infinite/Bayesian k-means
Repr.: Spatio-temporal Timeseries
Can we study sessions as spatio-temporal trajectories?

Trajectories and Online Behaviors


Is it relevant to study sessions as
spatio-temporal trajectories?
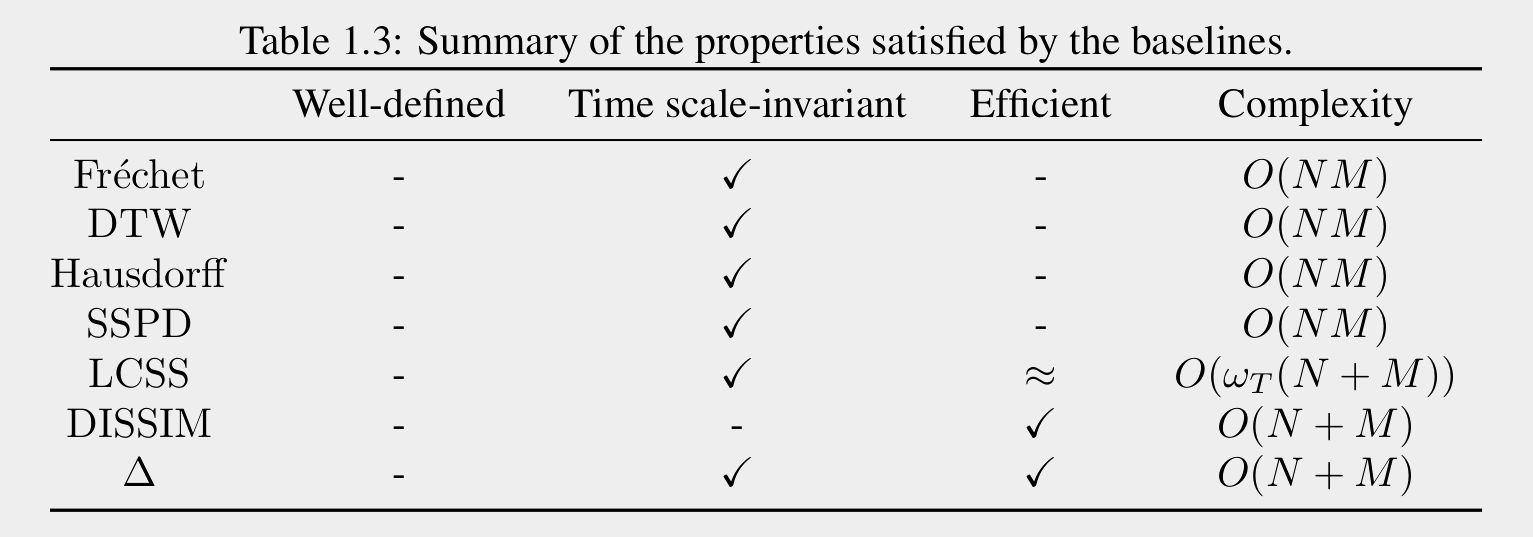
* Well-defined ~ invariant to subdivision
distinguishes prefixes
None satisfies all the properties
Let's build one!
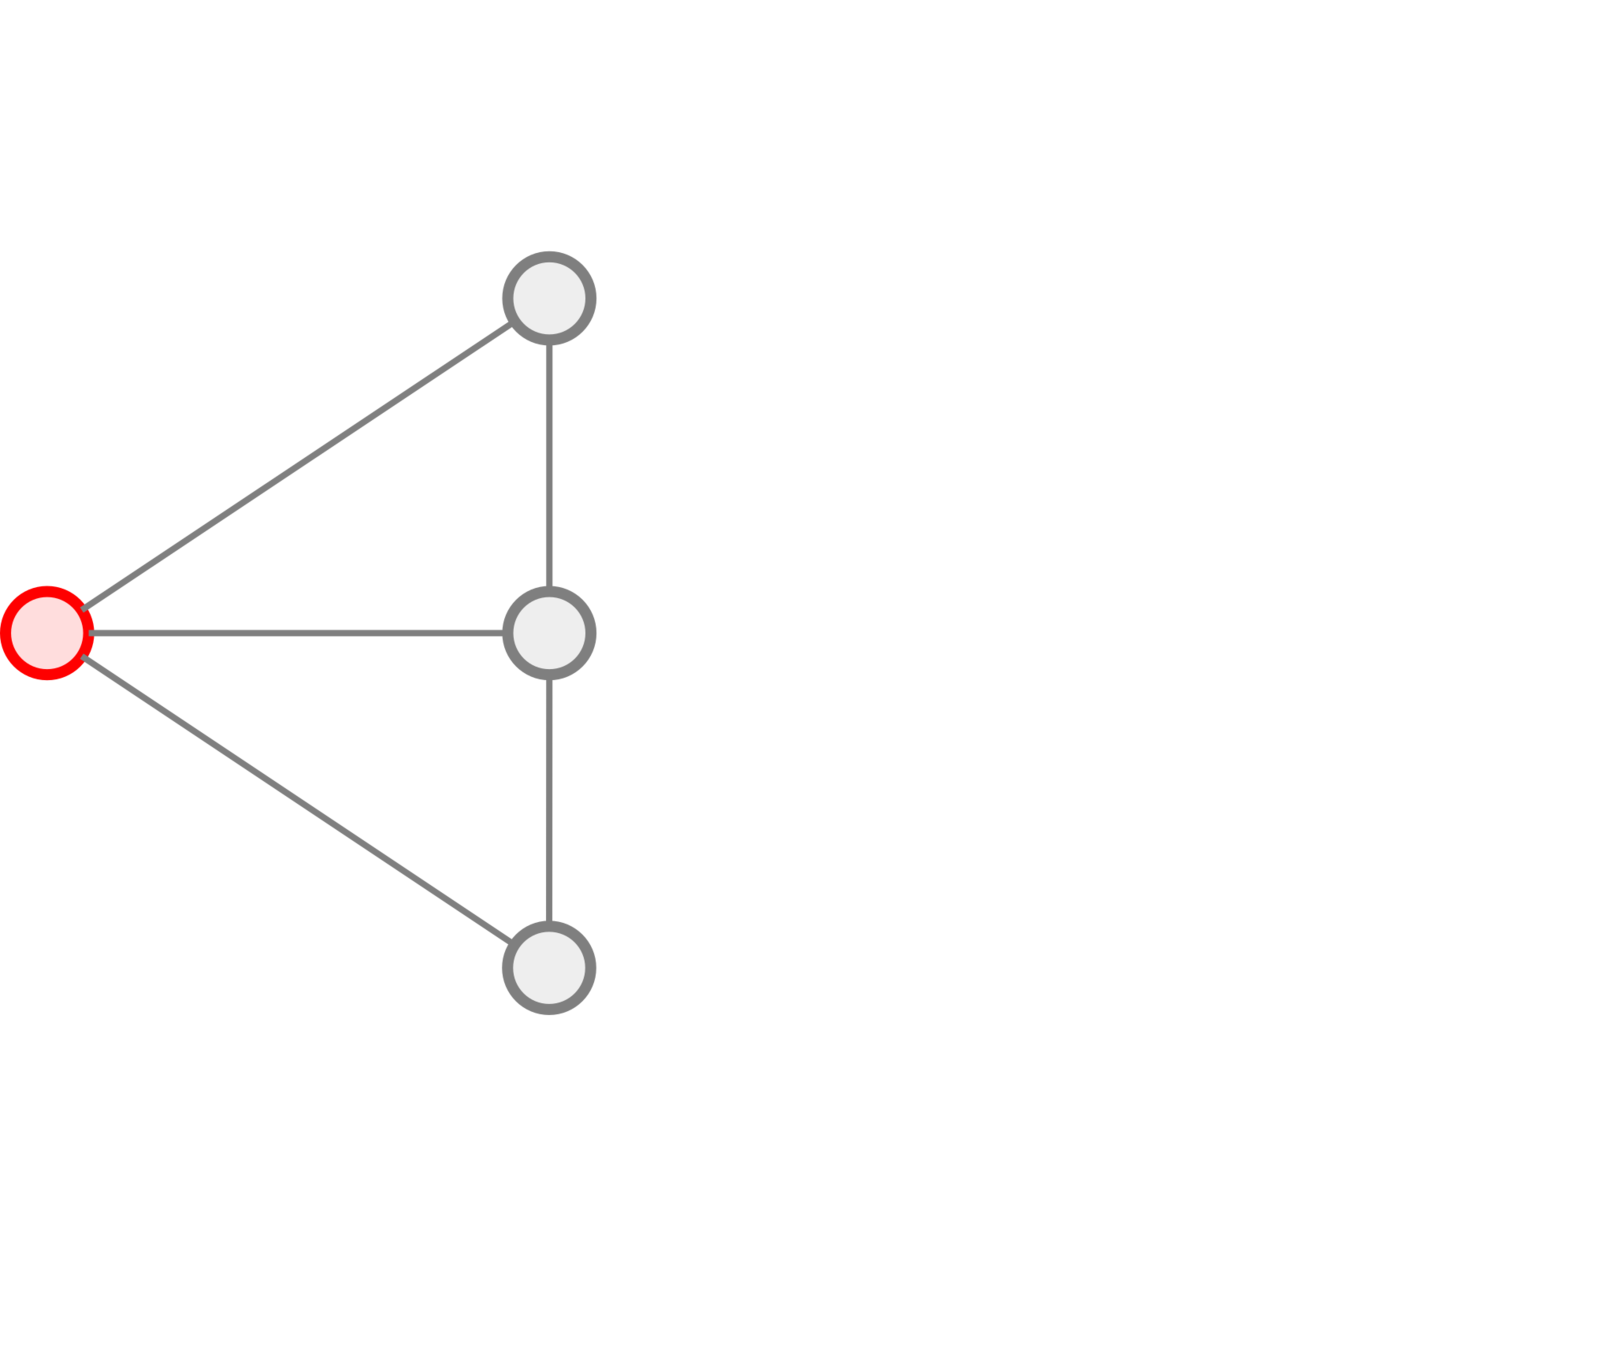
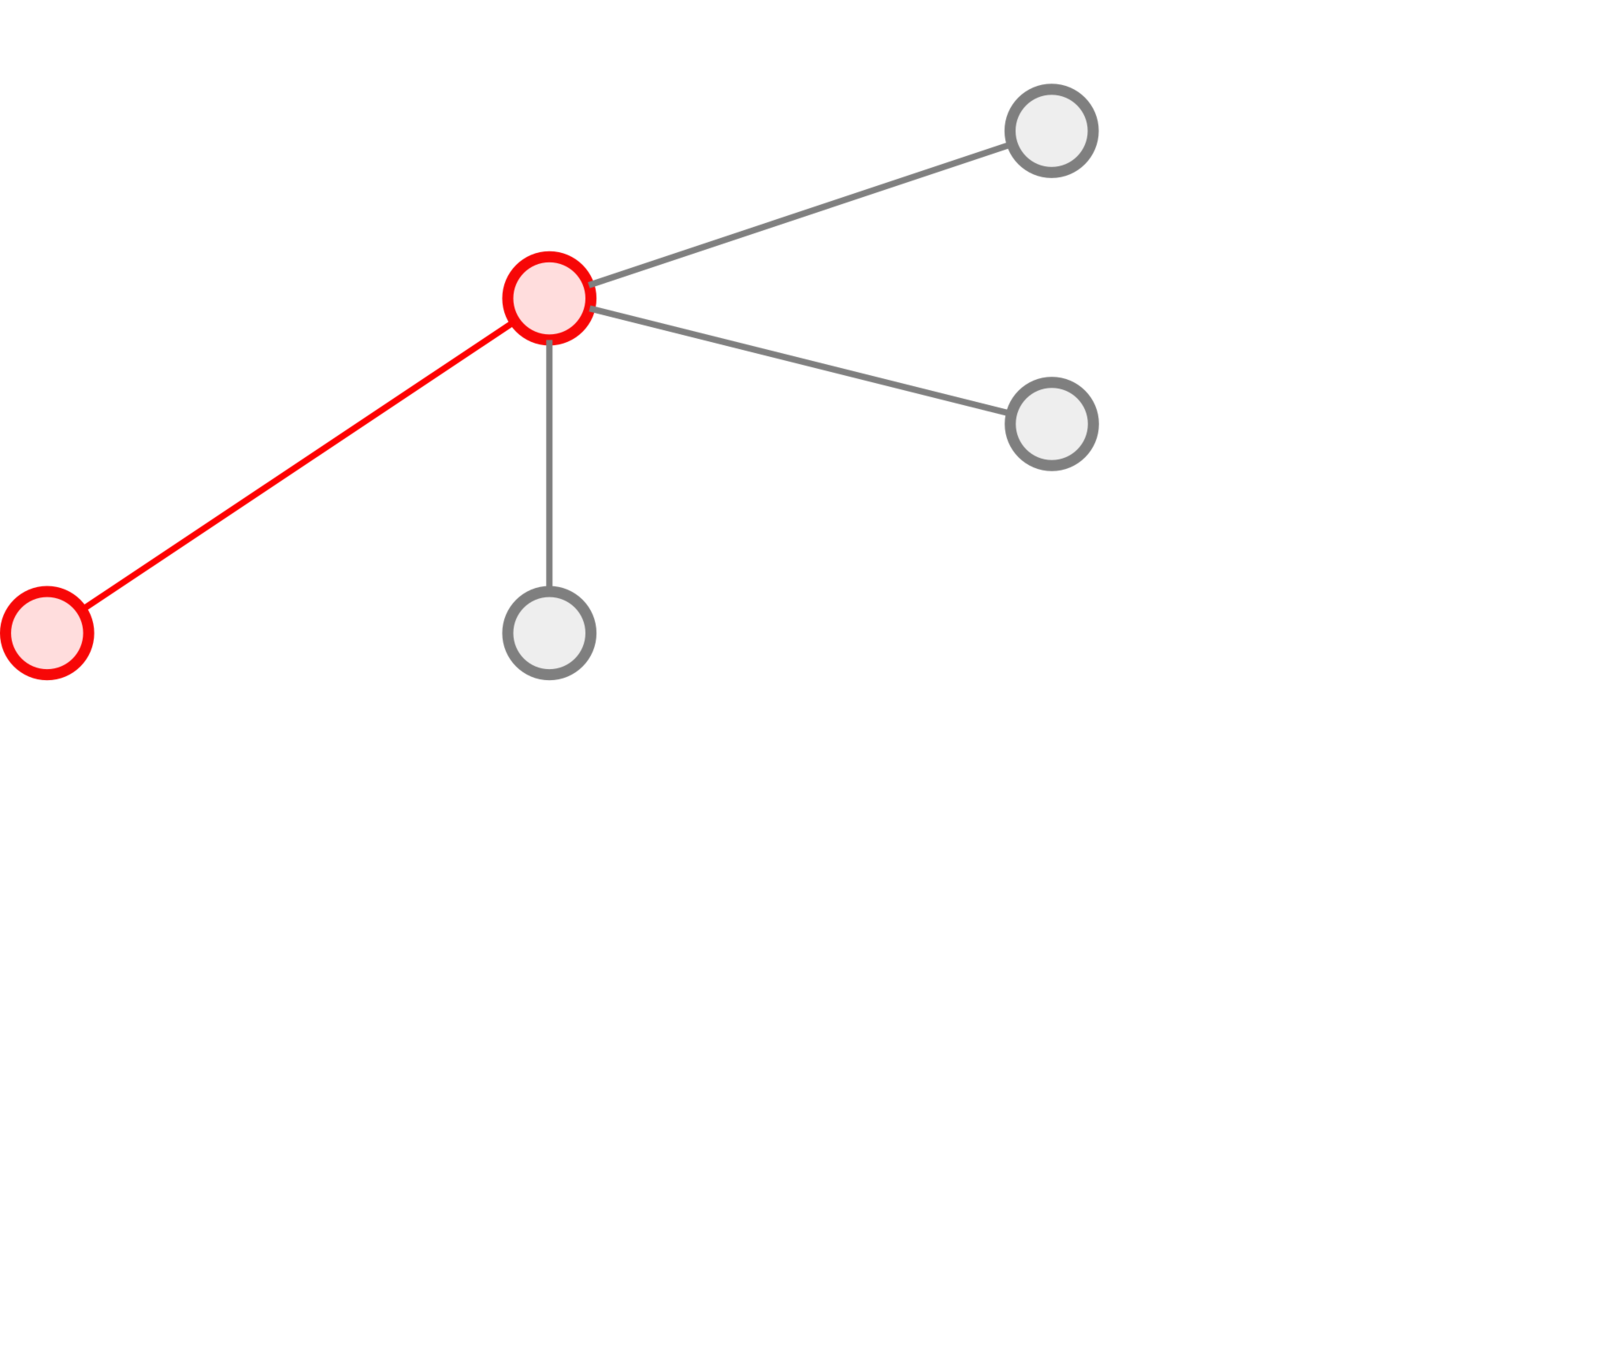
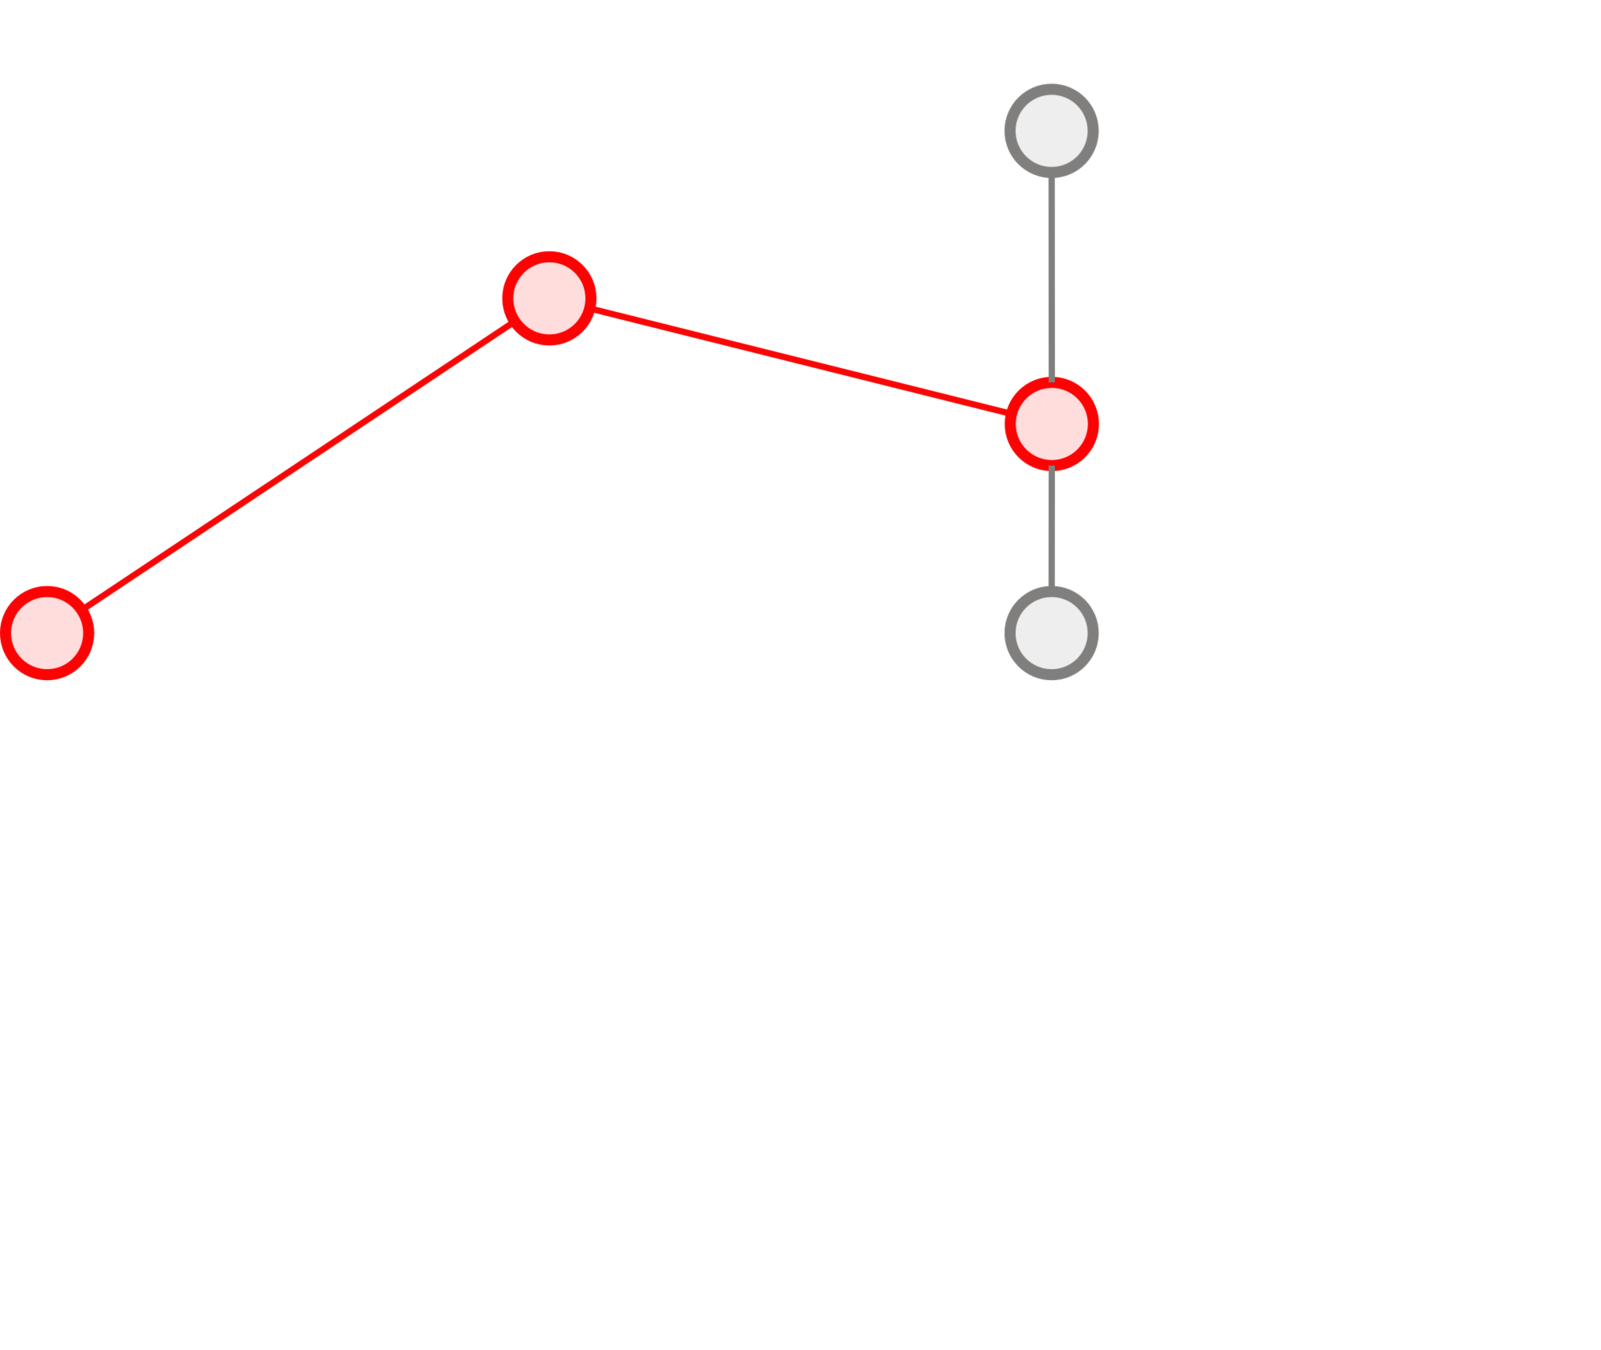
Sequence of pages
↓
Path in the page graph
+
Timestamps
+
Metric on the page graph
↓
Spatio-temporal
trajectory
Which trajectory measure ?
Construction
Our Measure:
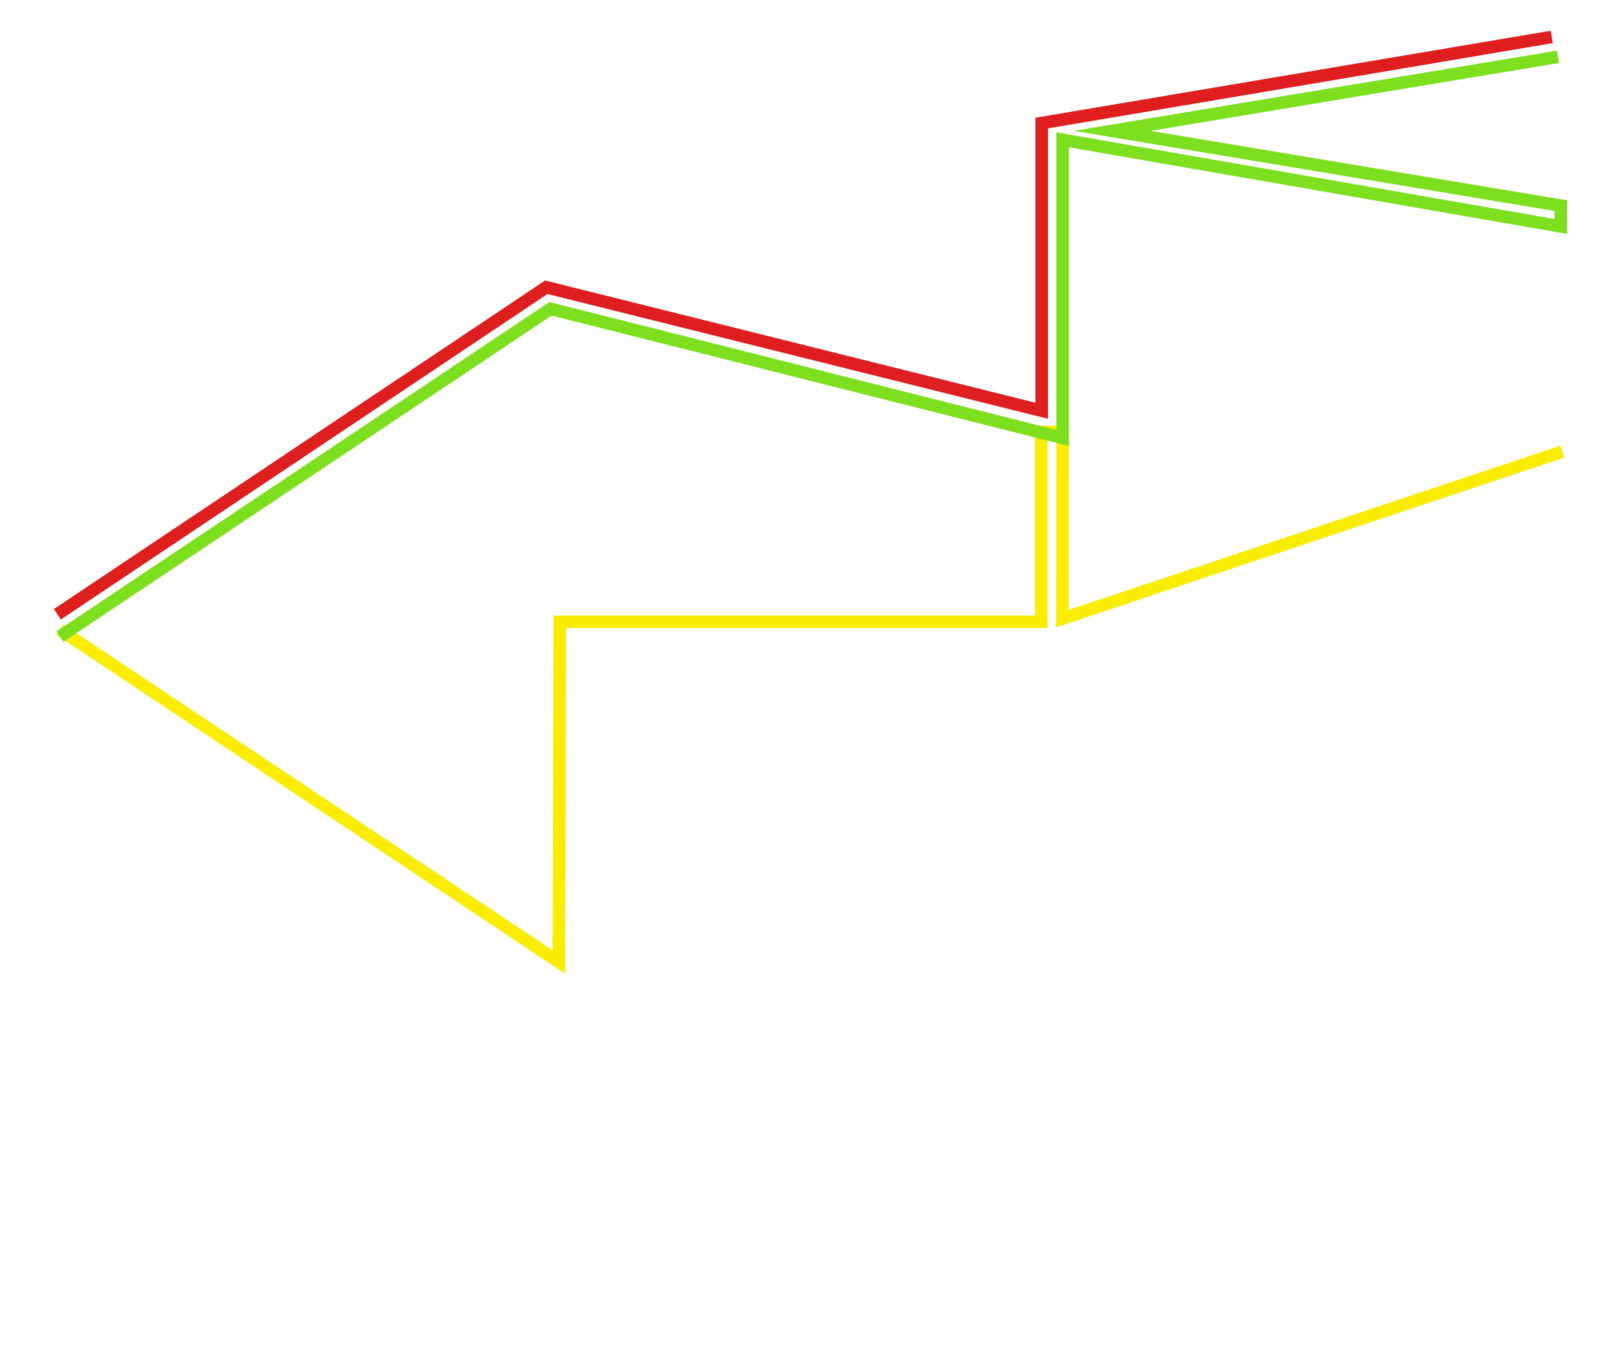
\Delta_{\mathrm{KL}}( X,Y : \lambda) = (1-\lambda)\log \frac{T_Y}{T_X} + \lambda \frac{1}{T_X} \int_{0}^{T_X} d \big( X(t), Y(t) \big) \partial t
Digression about
\Delta_{\mathrm{KL}}

\Delta_{\mathrm{KL}}
with shift
\Delta_{\mathrm{KL}}
without shift
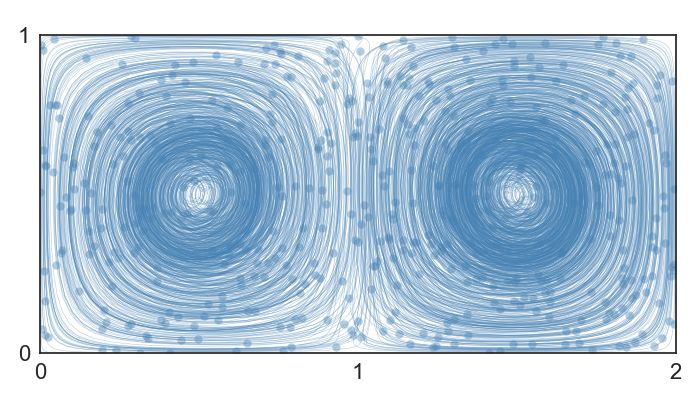
K.V. Olesen, et al. "A Contextually Supported Abnormality Detector for Maritime trajectories." Journal of Marine Science and Engineering (2023)
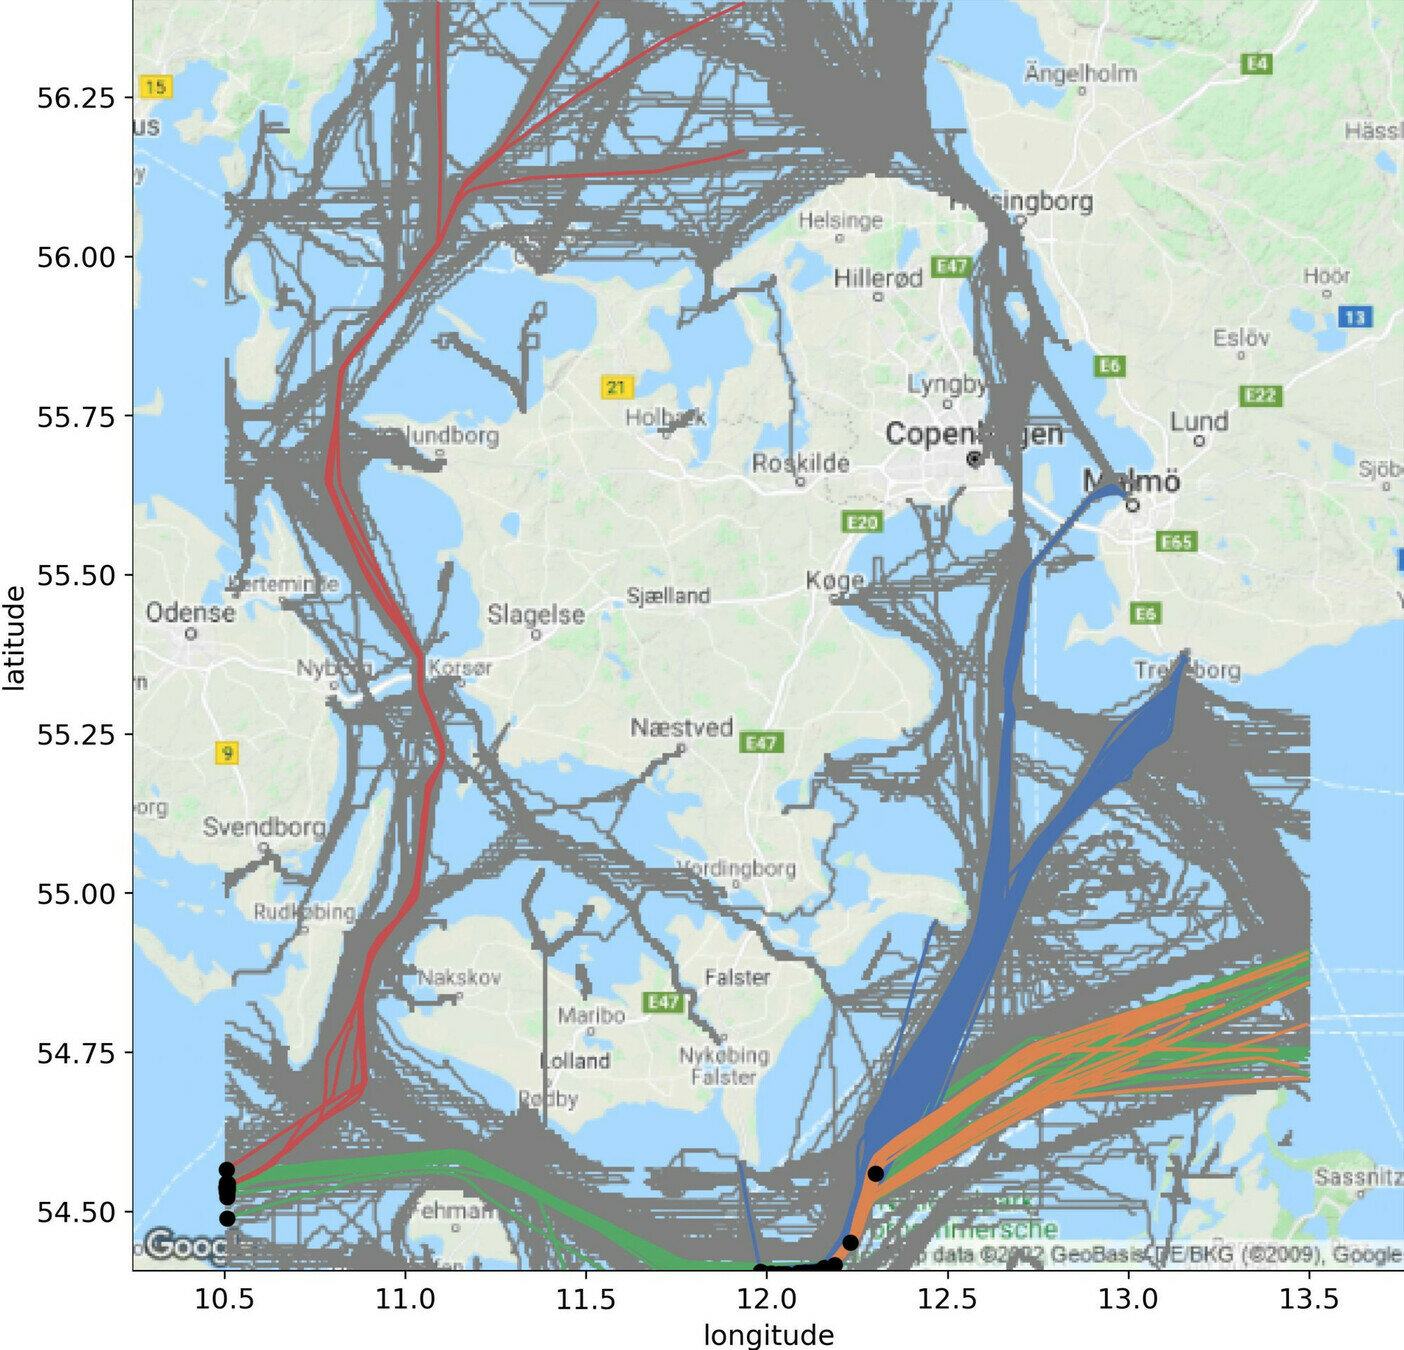
Trajectories in same cluster tend to start in the same location
What if we allow a temporal shift ?
Trajectories and Online Behaviors
Positive Correlation ↔ High avg. ≈ More Freedom
\psi
Negative Correlation ↔ Low avg. ≈ Less Freedom
\psi
Statistically Significant
Activity Indicator
\psi :=
average distance between one pupil
and her classmates
\mathrm{PPM} :=
number of page per minute
\mathrm{EPM} :=
number of event per minute
Pupils perform better if they follow the teacher's style/instructions
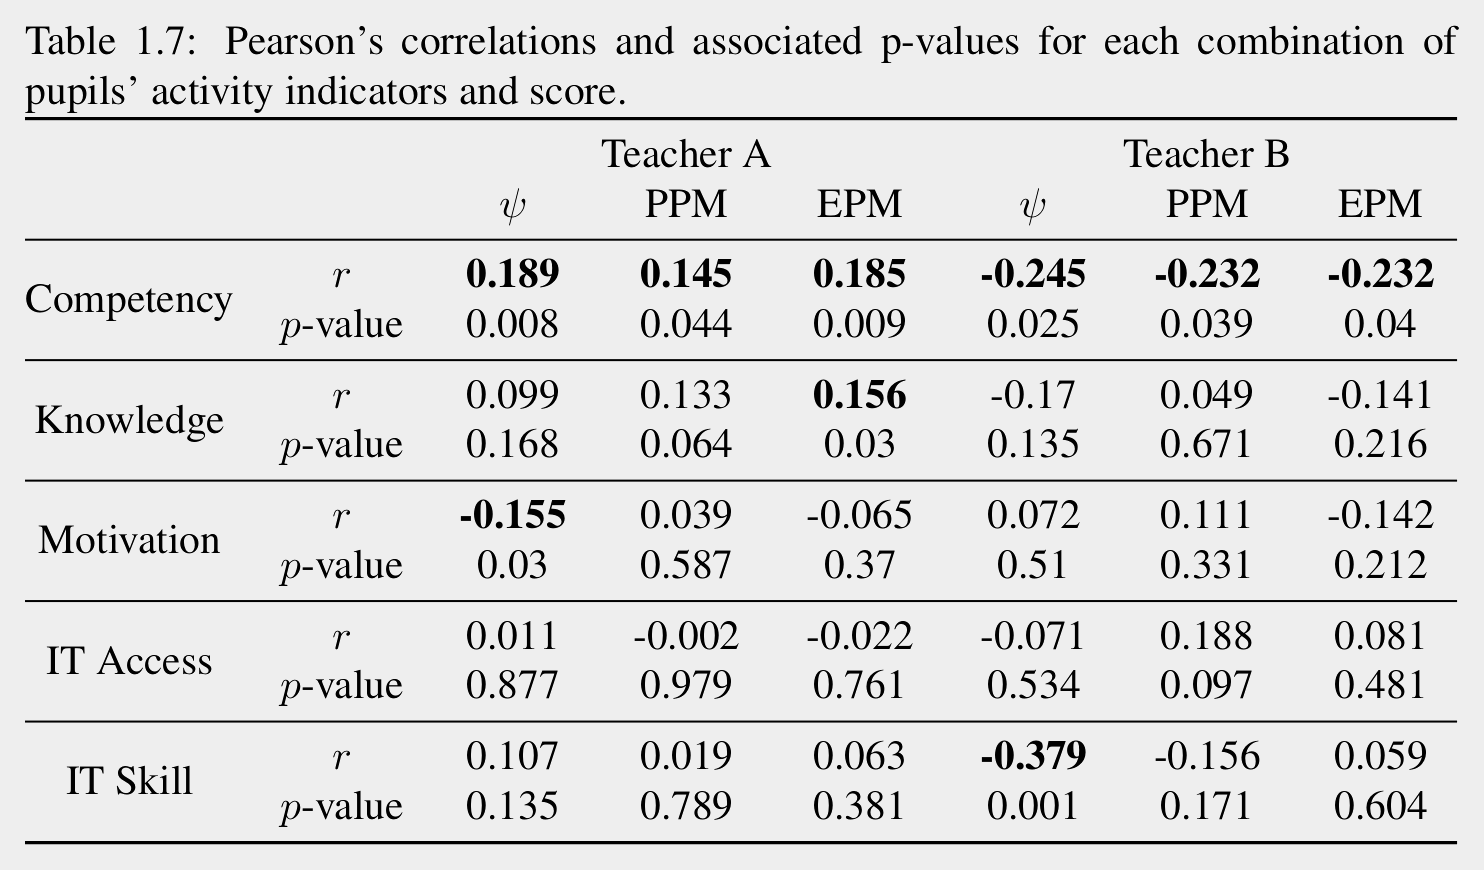
Teacher A
Teacher B

\text{avg.}\psi
Teacher B
Teacher A
Deep Clustering as a Unifying Method
Haven't we be doing the same thing?
Neural
Networks
Centroids
Neural Networks ?
| Model | Objects | Dis/similarity | Clustering |
|---|---|---|---|
| AA | Vectors | Euclidean + kernel | Centroids |
| MMC | Matrices | Probability | Centroids |
| Trajec. | Time series | Temporal simil. | Centroids |
Embedding
From Clustering to
Deep Clustering
A Short Lesson
Affinity-based Clustering


We cannot make everyone happy !
Problem:
Group super heroes
Objective:
Everyone is happy
Minimize unhappiness
Affinity-based Clustering
0.6
0.4
0.3
0.9
0.1
0.6
0.7
0.8
0.9
0.1
0.4
0.2
0.1
0.9
0.1
0.2
0.3
0.7
0.5
0.8
0.9
0.5
0.4
0.3
Memory
expensive
How many
groups?
Where should we cut the graph?
✂
Affinity-based Clustering
Group together those that are clearly similar
Strategy:
and treat the rest as noise.
DBSCAN
Ester, Martin, et al. "A density-based algorithm for discovering clusters in large spatial databases with noise." kdd. Vol. 96. No. 34. 1996.
Affinity-based Clustering
Group together those that are clearly similar
Strategy:
Merge if one member is similar enough to one other member.
Until enough is not satisfied anymore.
Until 3 clusters are formed.
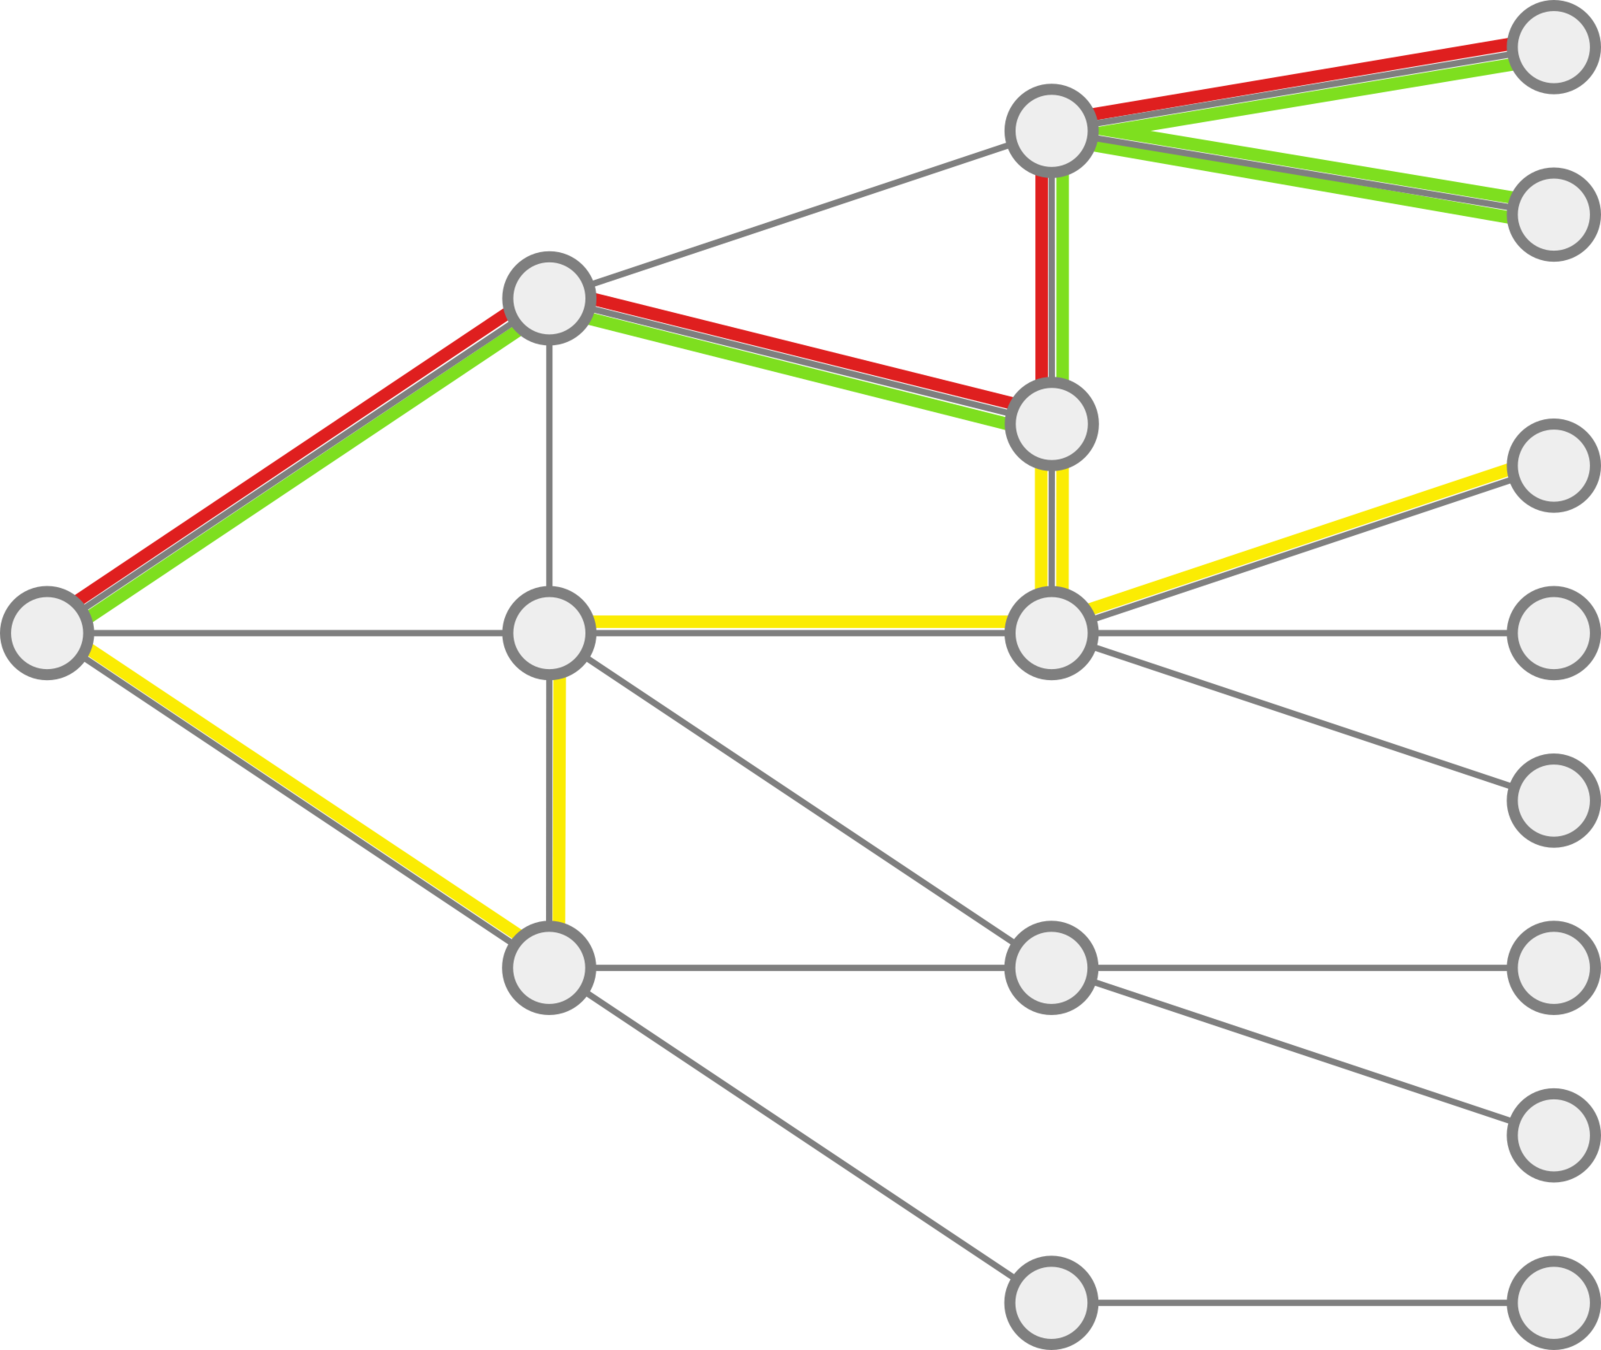
Agglomerative Clustering
Single-linkage
Different merging strategy,
different linkage
still queries the Affinity matrix
(N×N)
Affinity-based Clustering
Remarks:
Which similarity measure?
Euclidean distance is easy
Not always cluster vectors
Cost of the
affinity matrix
Compute over mini-batches
Might repeat computations
Objects don't move!
The decision borders move
Let's make the objects move!
Affinity-based Clustering
Euclidean distance is easy
Compute over mini-batches
Let's make the objects move!
Euclidean distance is easy
Compute over mini-batches
Let's make the objects move!
color
shape
What are we actually doing?
We learn a similarity measure
We learn a Kernel!
Feature map
Euclidean
Unknown
How do we guide the learning?
Affinity-based Deep Clustering
Let be a dataset that we want to cluster using a feature map .
\mathcal{X}\!=\!\{x_1\ldots x_N\}\!\subset\!\mathbb{R}^d
We want that in the embedding space:
- similar objects are close to each other,
- dissimilar ones are far from each other.
f\!:\!\mathbb{R}^d \!\longrightarrow \!\mathbb{R}^p
For each datapoint , we have a set of positive examples
and of negative ones .
x_i
x_i^{+}
x_i^-
\mathcal{J} = \sum_{i=1}^N \sum_{j \in x_i^+} ||x_i -x_j||^2 - \sum_{l \in x_i^-} ||x_i -x_l||^2
Triplet Loss
How do we get these sets?
Euclidean norm not good in practice
\mathcal{J} = \sum_{i=1}^N
-\log\Big( \dfrac{ \sum_{j \in x_i^+} \exp \cos( x_i, x_j) / \tau }{ \sum_{l \in x_i^-} \exp \cos( x_i, x_l) / \tau } \Big)
InfoNCE
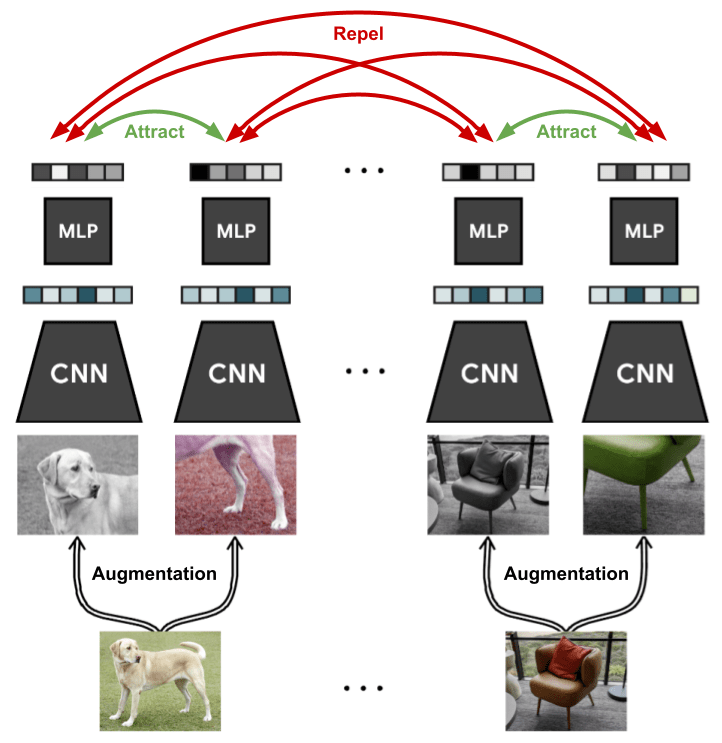
Contrastive Learning
Augmentations are pulled closer
Other instances are pushed away

Centroid-based Clustering
Choose three representatives.
Strategy:
Group by similarity.
Update the representatives.
Continue until convergence.
k-Medoids
Can we learn k-means with a neural network?
If the representatives are not necessarily instances
k-means
Research Plan
Mechanistic Interpretability
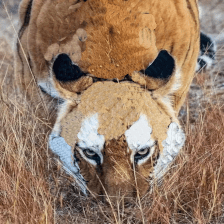
Motivation
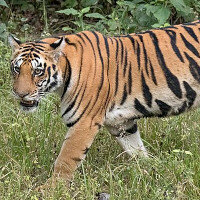
What did you see?
Where did you look?
Where were
the eyes?
How many eyes
were there?
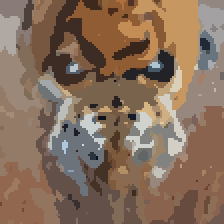
How to see what
a model sees?
How to see what a model sees?
RISE
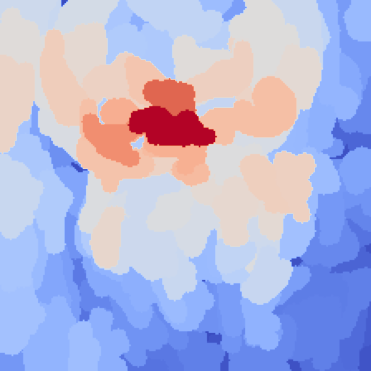
XRAI
GradCAM

LRP
IG


Dingo or Lion
These do not answer directly
what does the model see?
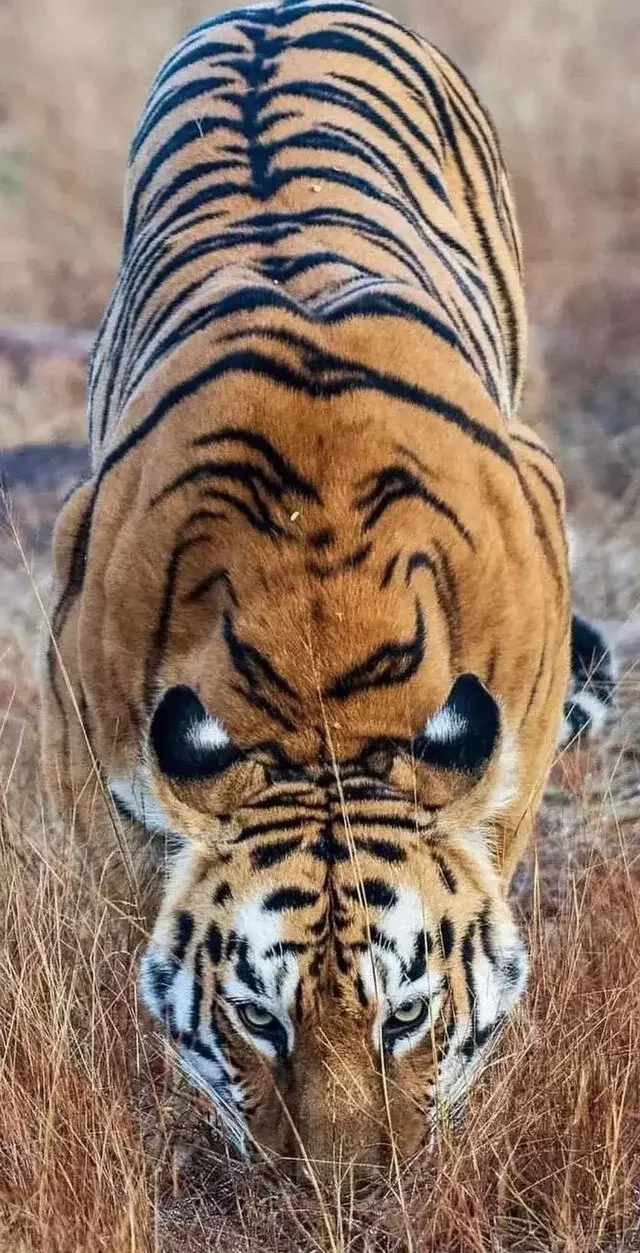
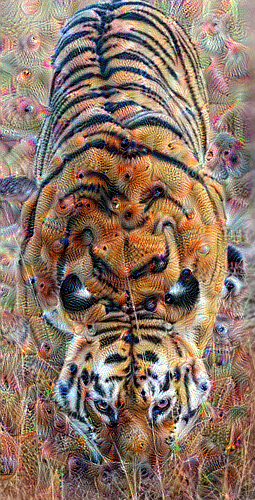
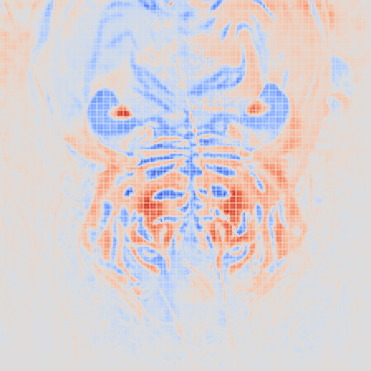
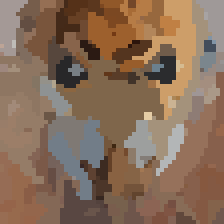
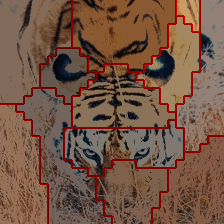
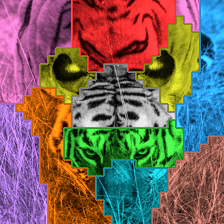
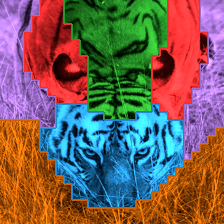
Deep Dream?
What makes it more a tiger than a tiger?
Too slow, impossible to train, not really useful.
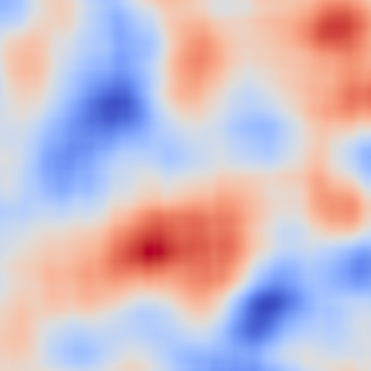
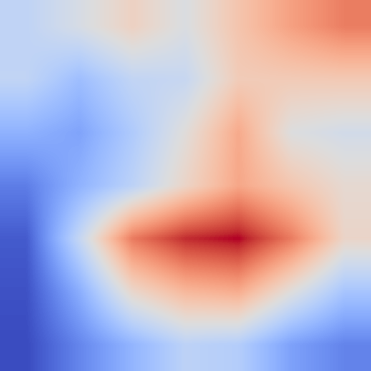
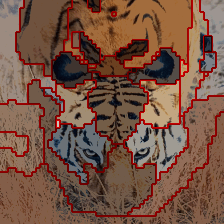
What is important for the prediction?
Inconsistent, difficult to read, objective unclear.
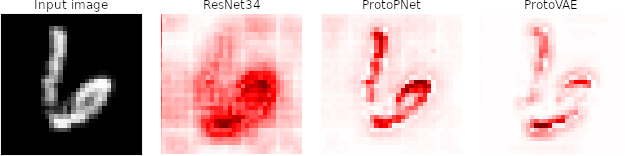
Saliency Maps?
How is the neighborhood in the embedding?
Inspection of the embedding, "biaised" justification..
Prototypes/Concepts?
Counterfactual?
What should I change to change class?
Tricky to compute, but nice!
How to see what a model sees?
Standard Image Classifier

\rbrace
Encoder
convolutions, pooling, non-linearity, skip-connections, attention, etc.
\rbrace
Classifier
Single linear layer... eventually a softmax


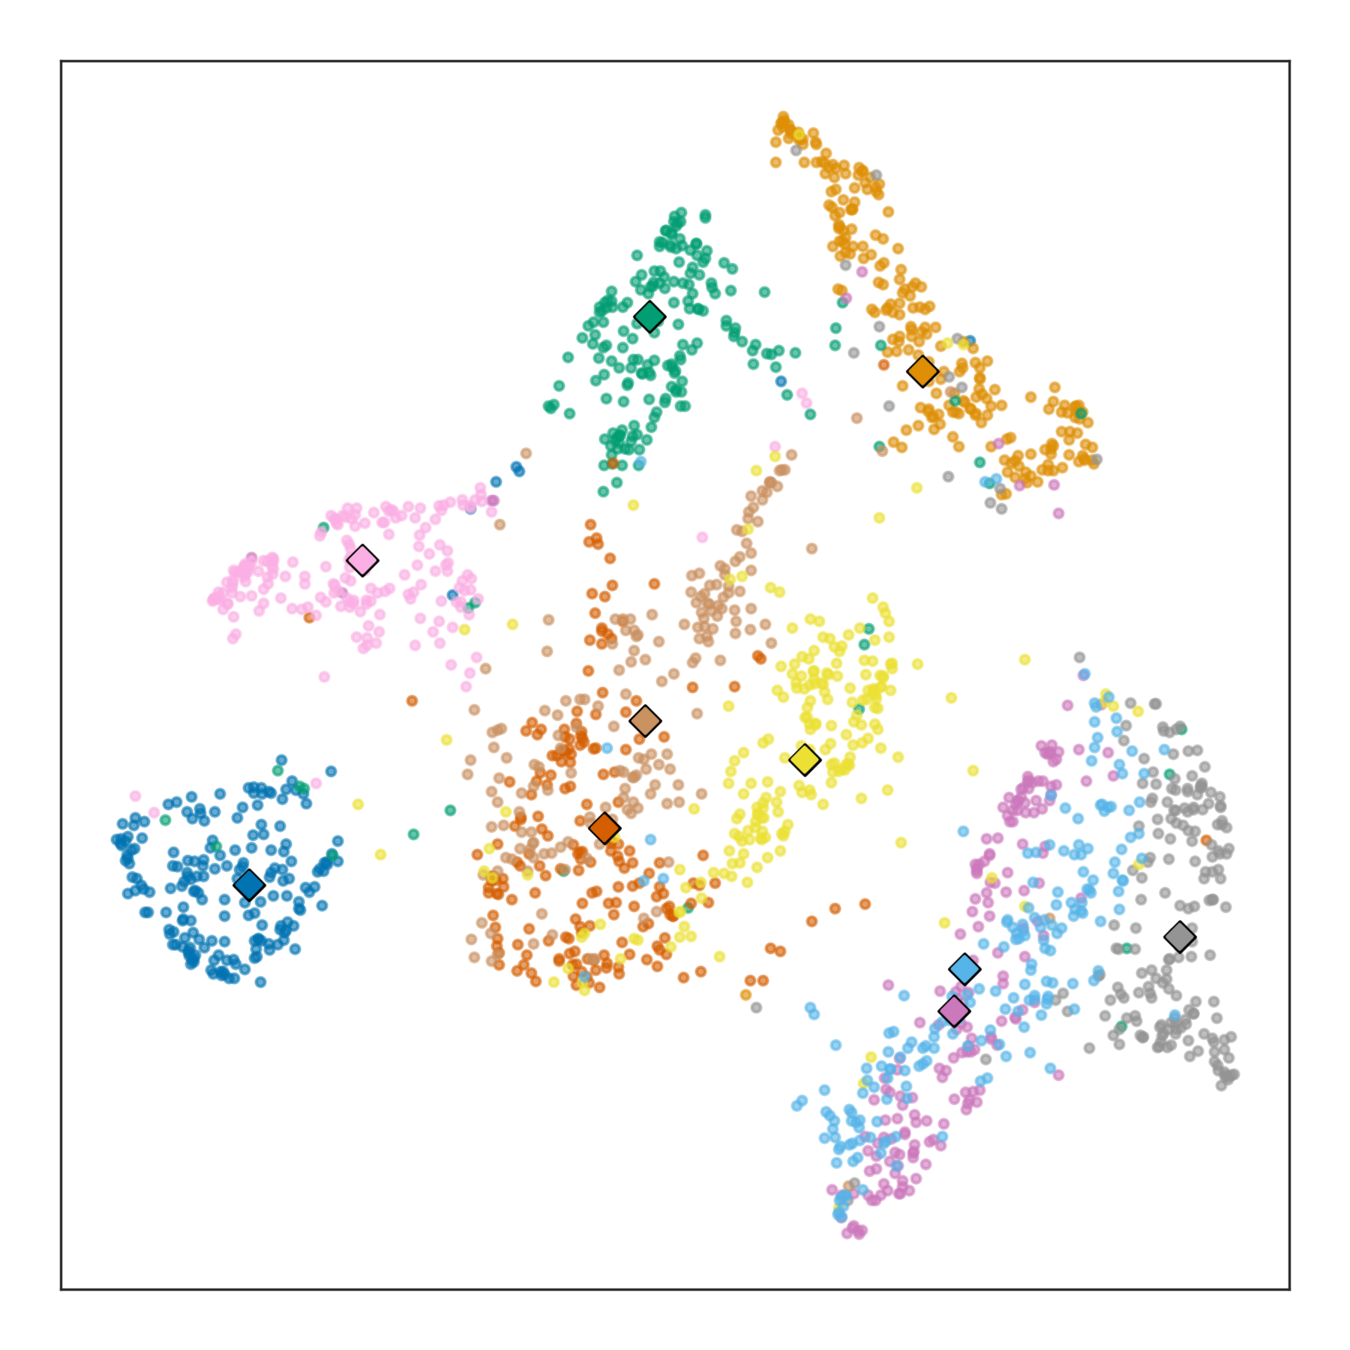
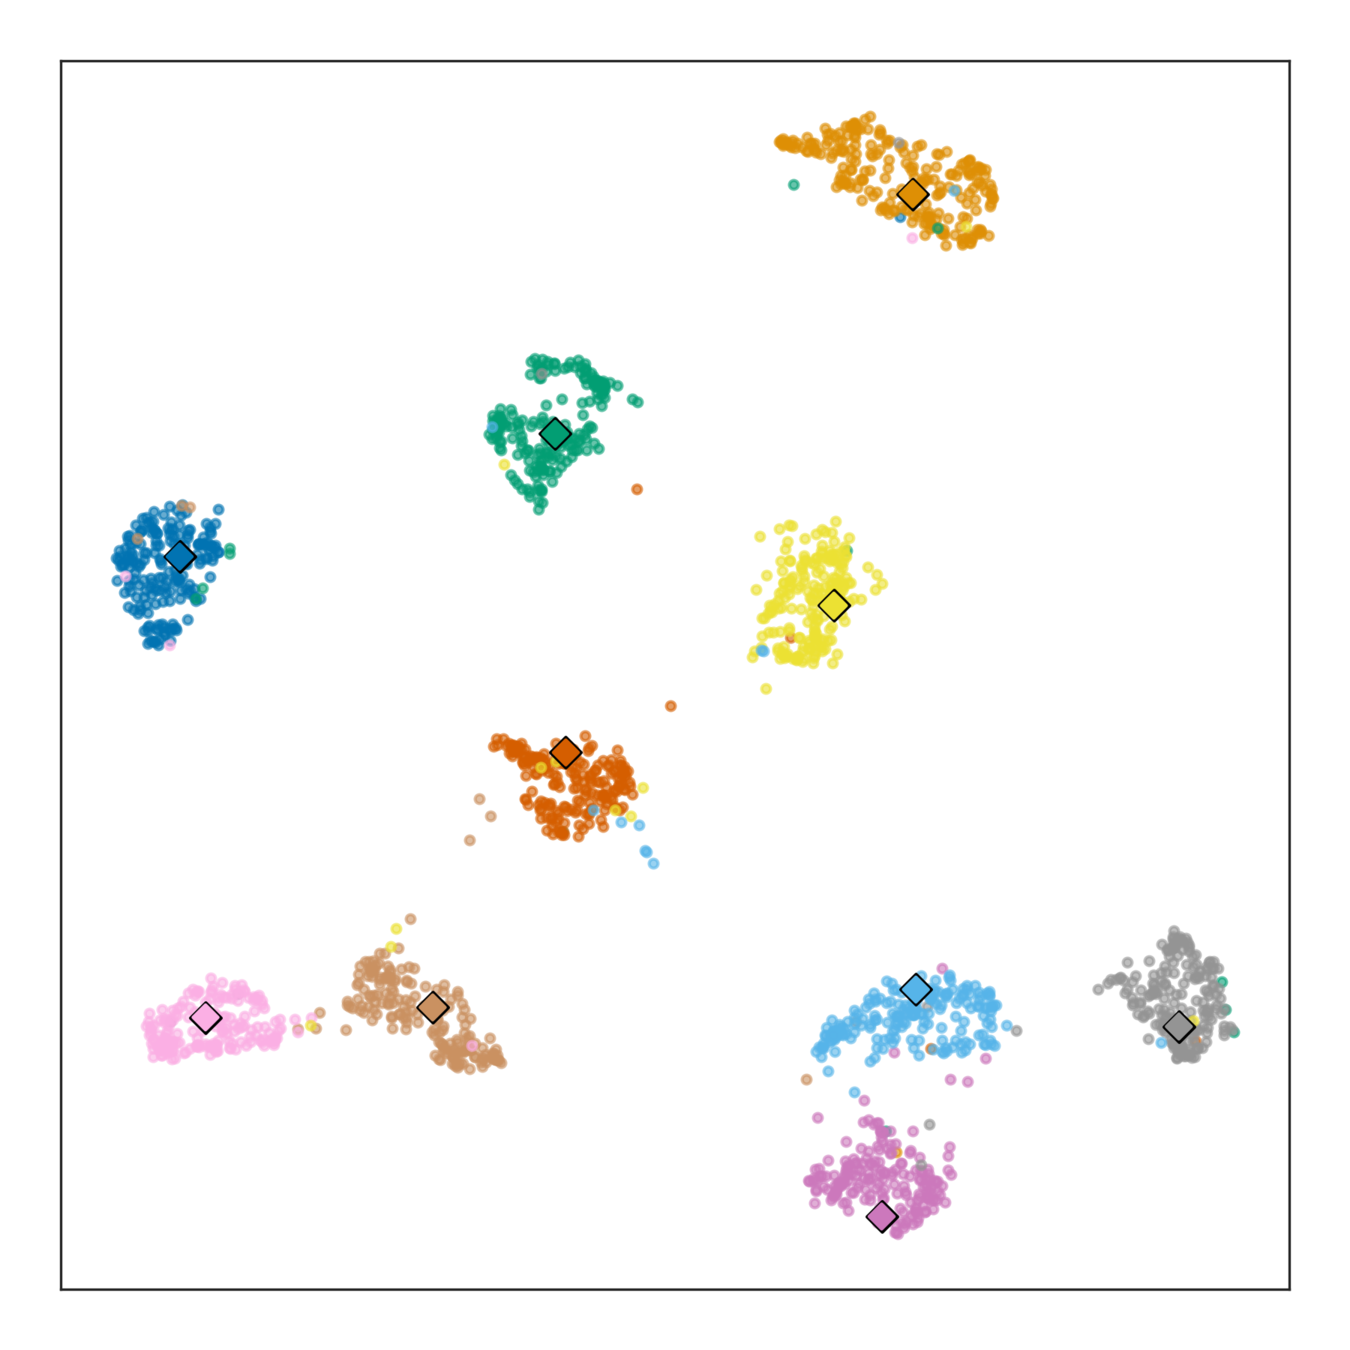
clustering
k=10
k=5
How to see what a model sees?
Standard Image Classifier
\rbrace
Encoder
convolutions, pooling, non-linearity, skip-connections, attention, etc.
\rbrace
Classifier
Single linear layer... eventually a softmax
clustering
k=10
k=5
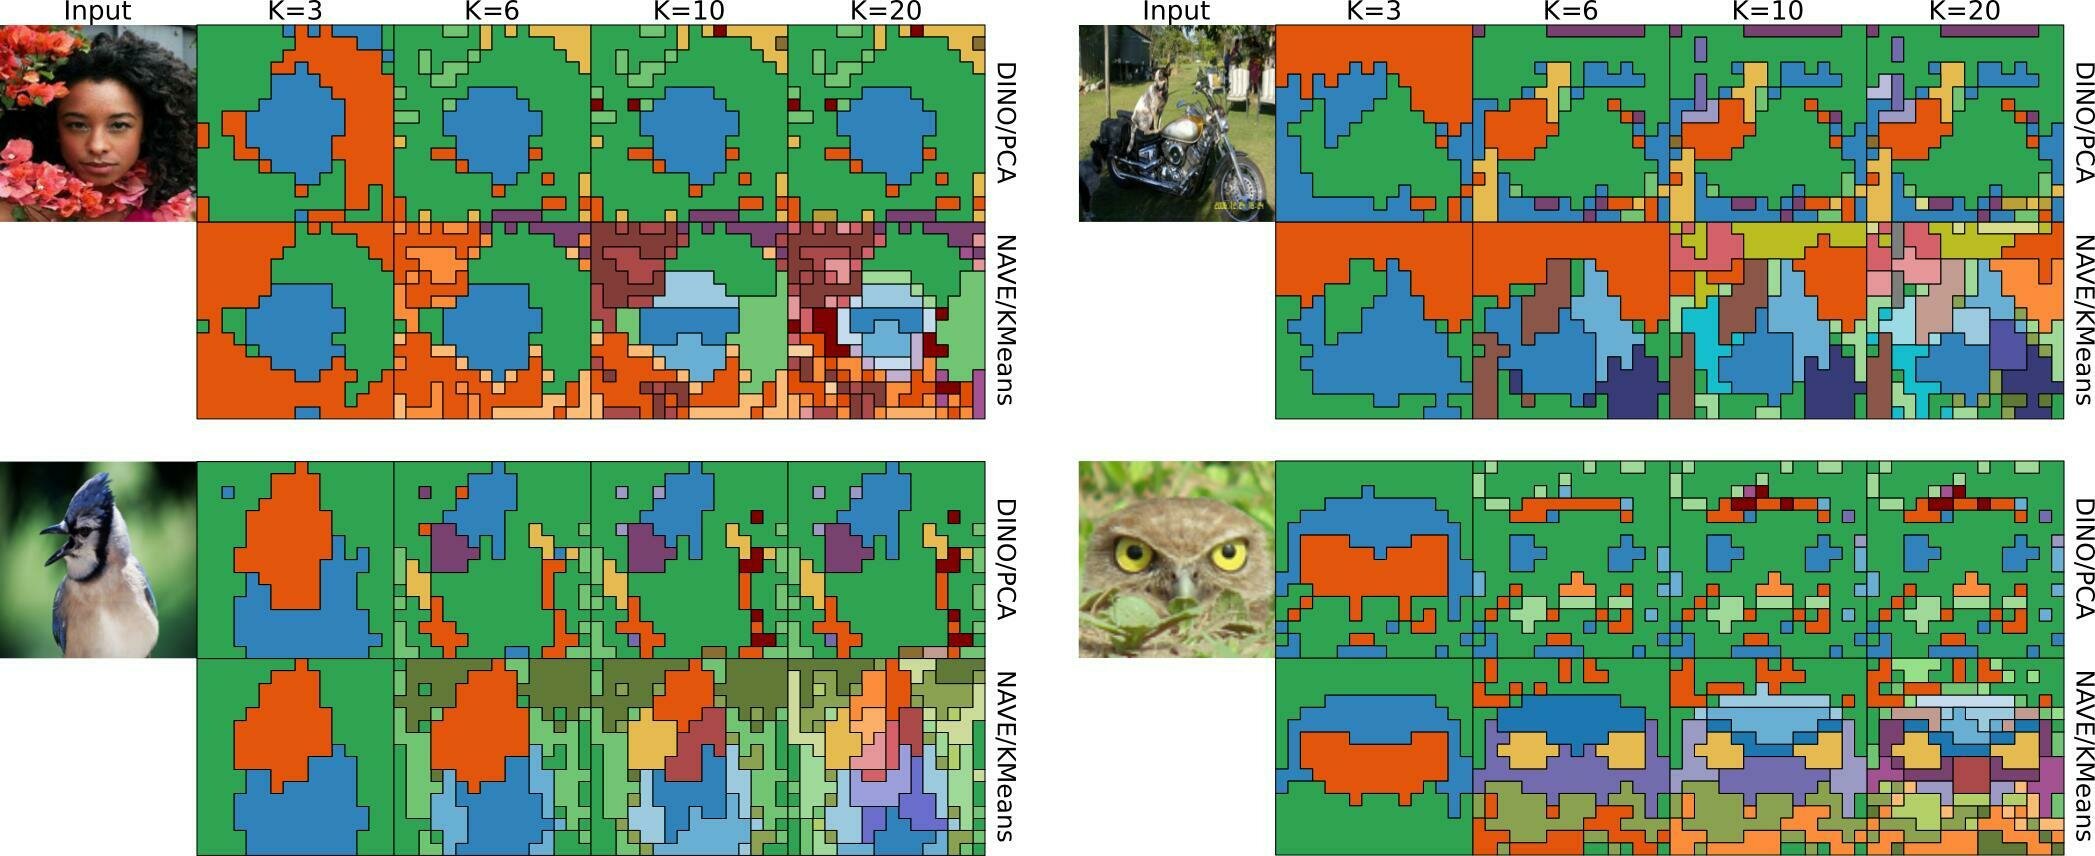
How to see what a model sees?
Seems like a déjà-vu?
One object at a time
Limited to 3 directions
For K=3,
PCA and k-means are similar
K-means provides
some hierarchy!
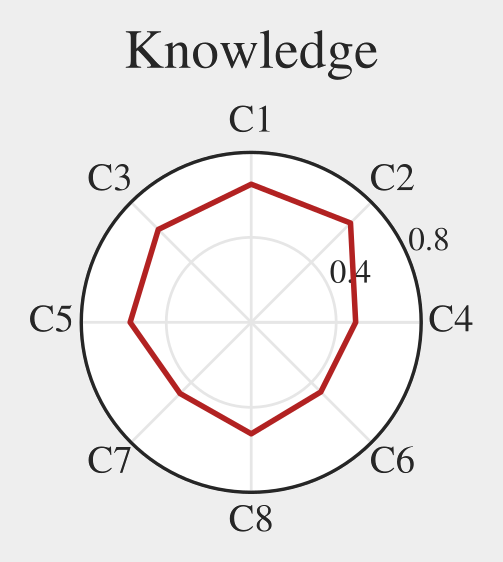
What can we "explain"?
What can we explain?
Explain explanations


IG
LRP
GradCAM
RISE
XRAI
color gradient ~ rank
What can we explain?
Connect Concepts and Semantics


What can we explain?
ECG Explanation
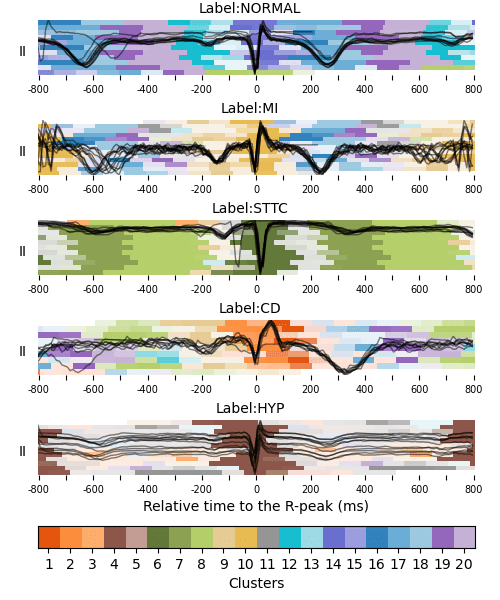
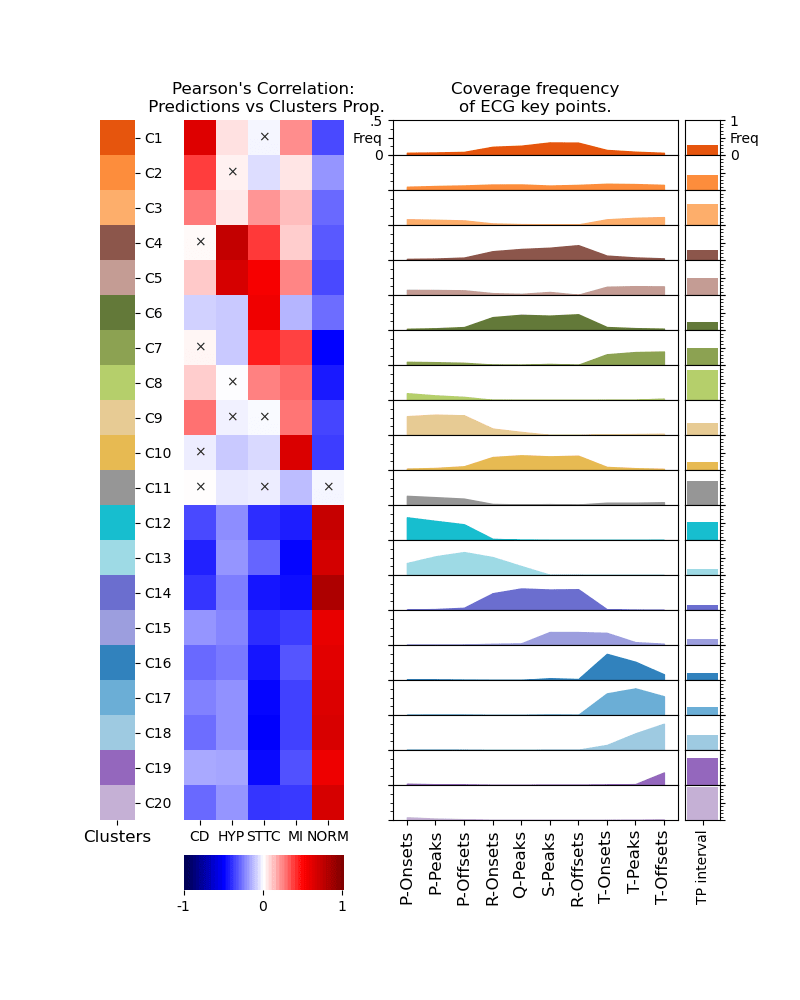
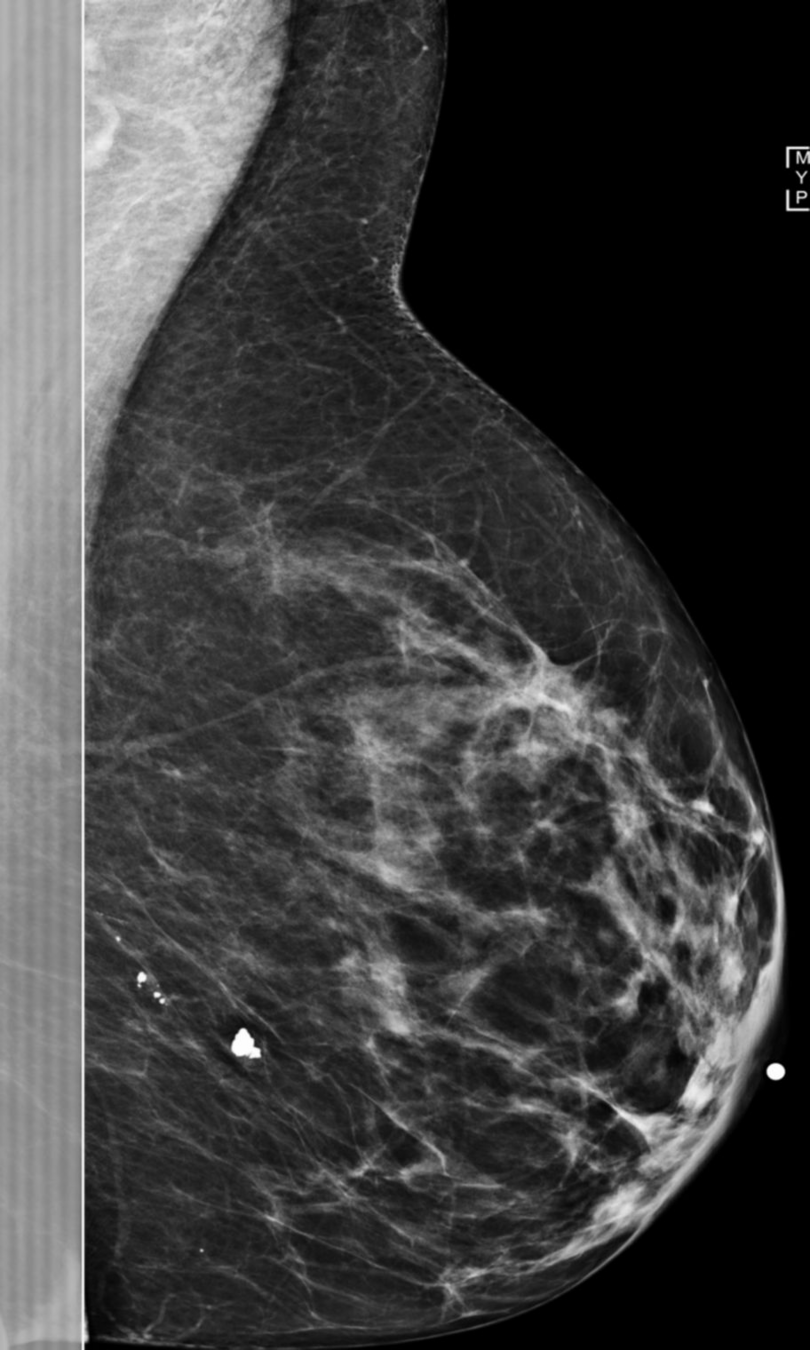
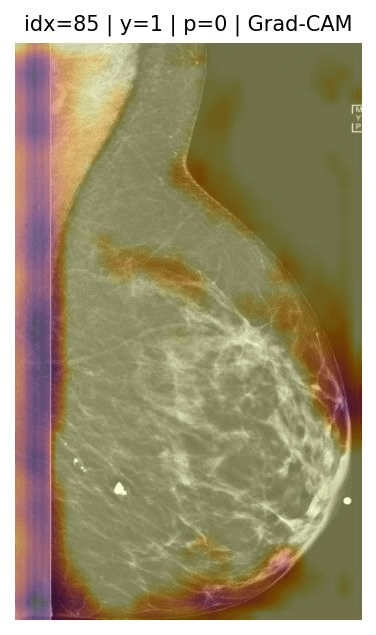
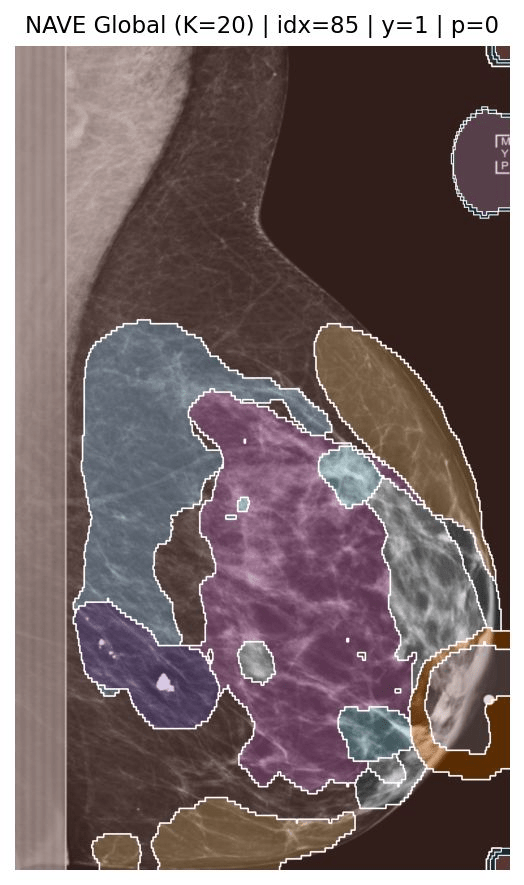
What can we explain?
Annotation Masks
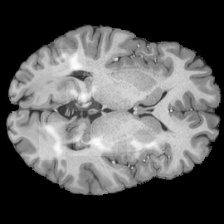
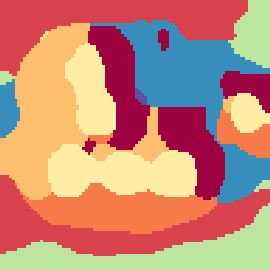
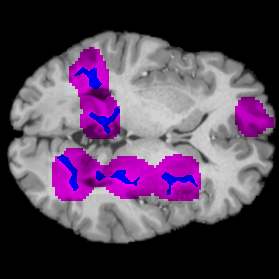
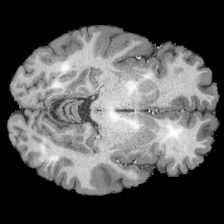
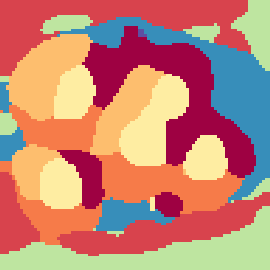
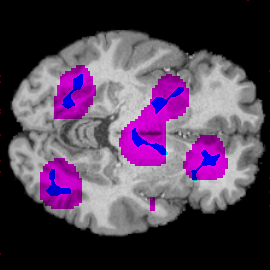
Model train for binary classif.
All lesions recovered
Can we use NAVE for medical annotations?
You need well performing model!
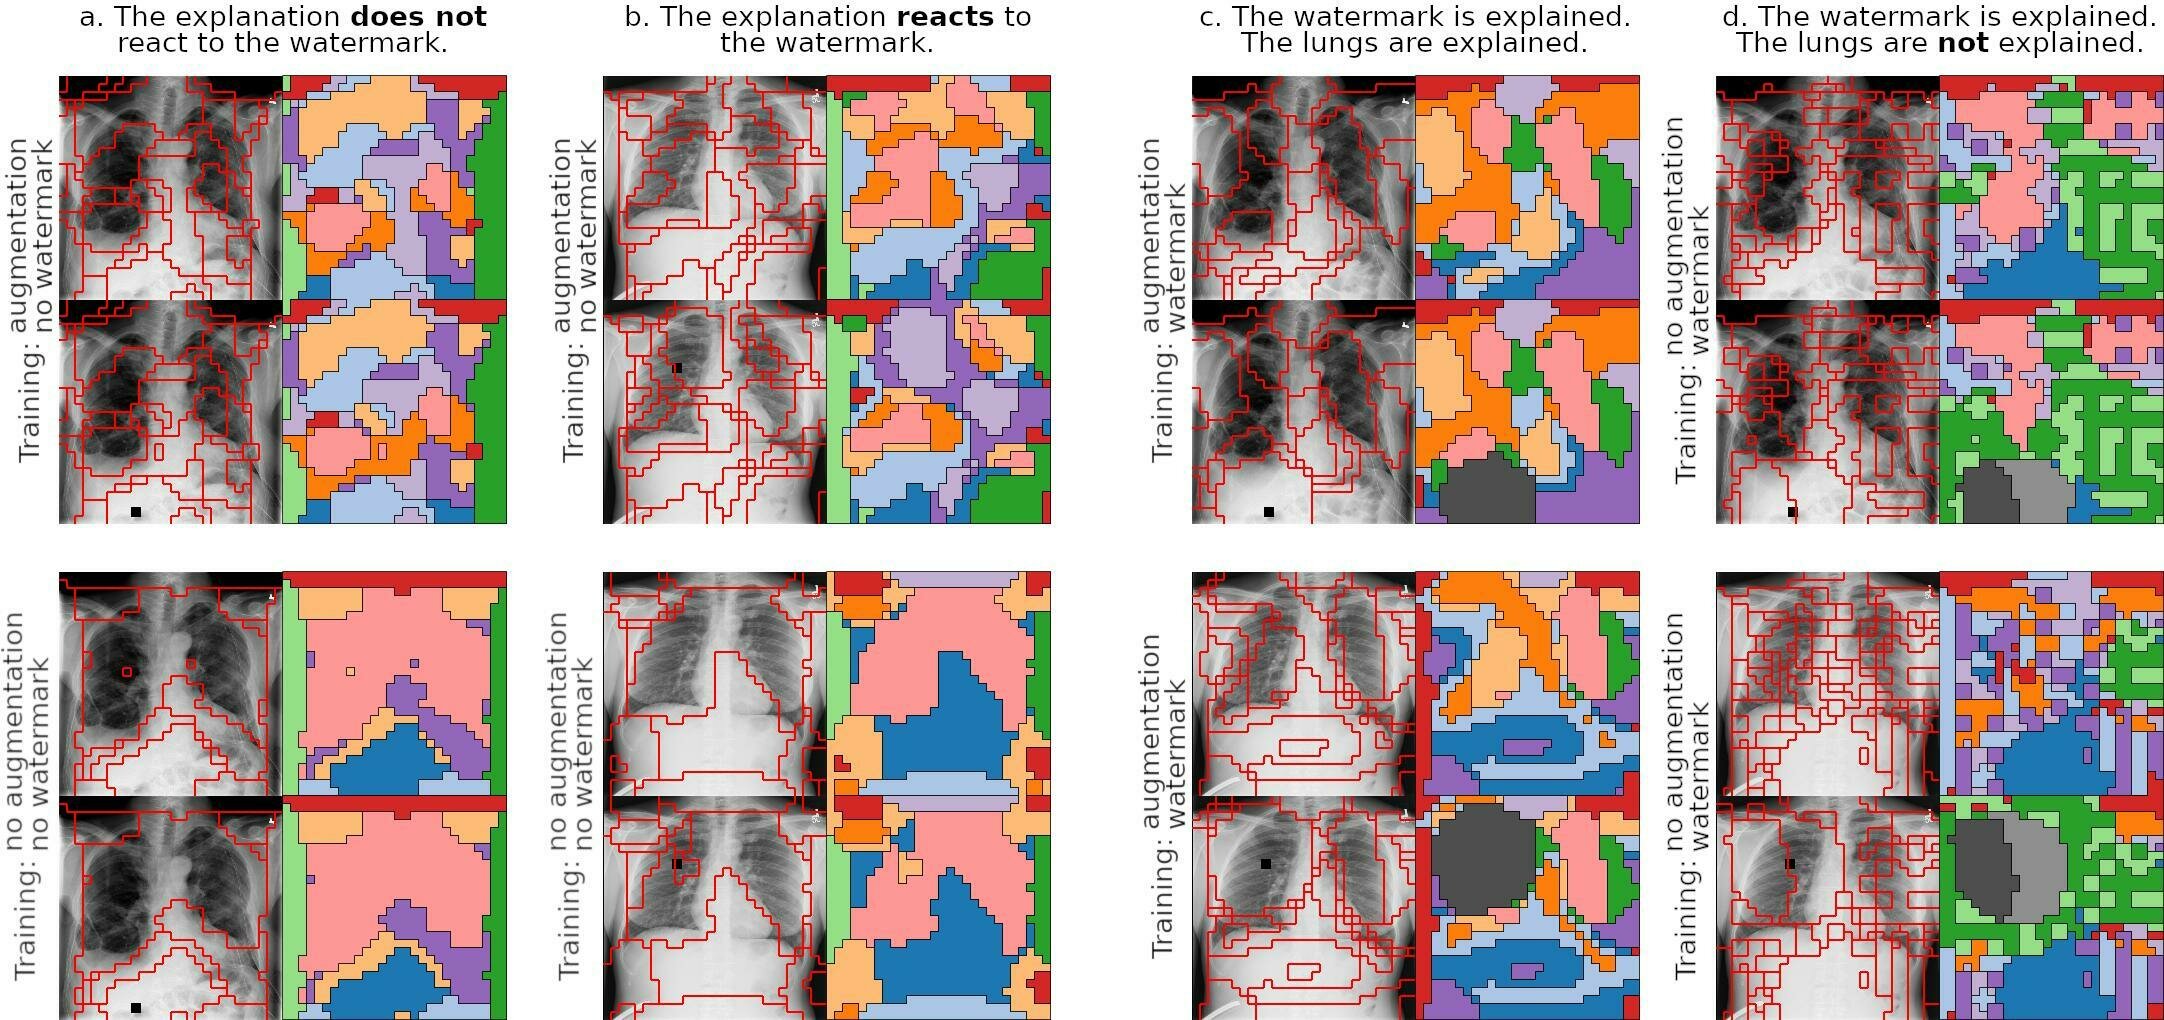
What can we explain?
Inspect Shortcuts Saturation
What else
can we do?
What else can we do?
Unlearning?
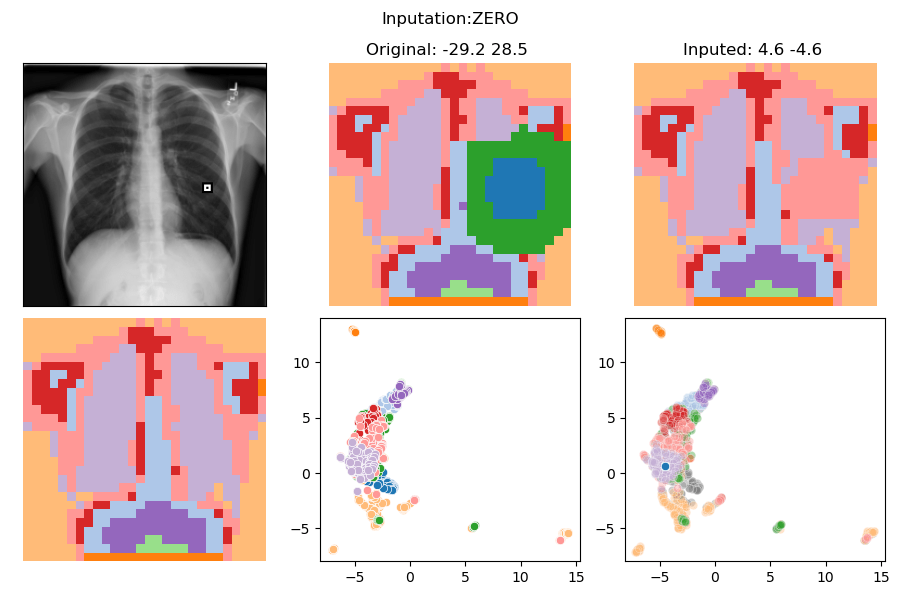
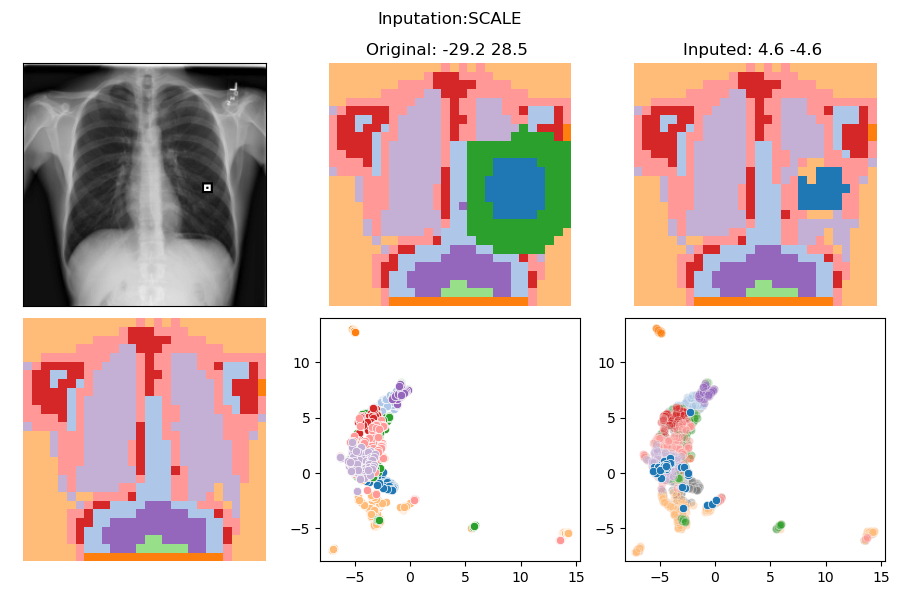
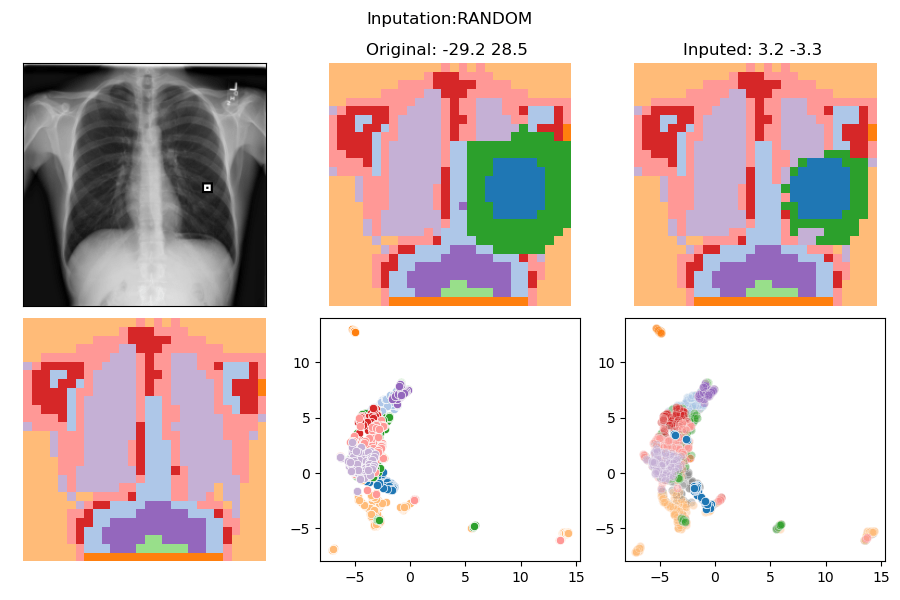
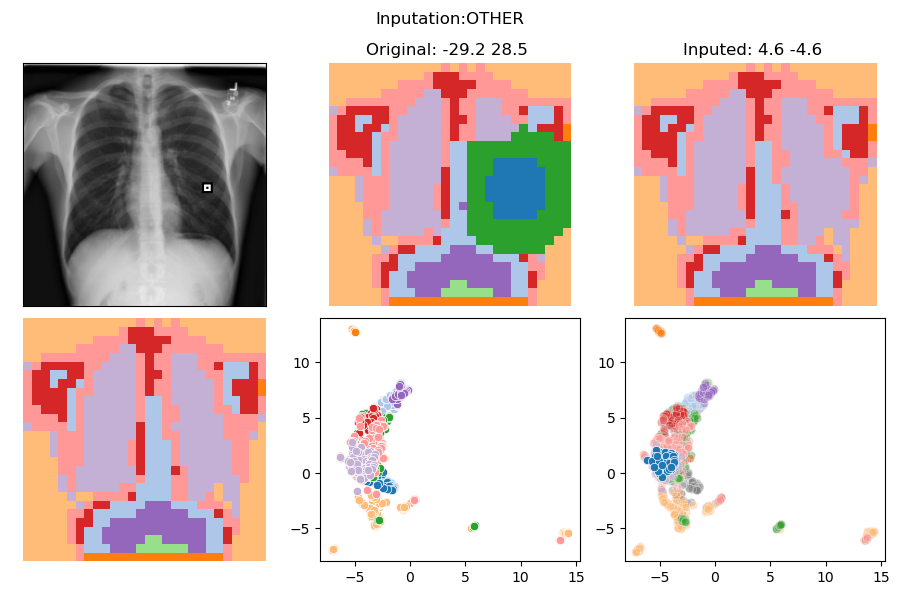
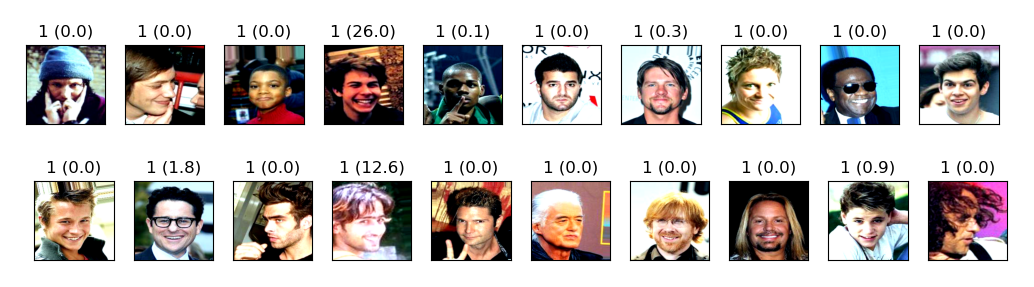
>>> Test set
>>> IMPUTATION: SWAP

>>> Accuracies
                 All    LBL==0  LBL==1
Distribution    176     26.7    73.3
--------------------------------------
Nothing      :  26.7    100.0   0.0
Watermark    :  100.0   100.0   100.0
Wmk and Imput:  26.7    100.0   0.0
--------------------------------------
What else can we do?
In distribution counterfactuals


Future Research
Future Research
Theory
- Health data: ECG and mammography on going.
- Transfer to generative models, RL, LLM.
Applications
- Connect NAVE and feature importance.
- Do causality.
- Counterfactual.
- Unlearning.
How to use NAVE for Fairness and Trustworthiness?
Serra Hunter @ UPC
Ahcène Boubekki
UCPH, Denmark
SerraHunter@UPC
By ahcene


