Mining User Trajectories
in Electronic Textbooks
Ahcène Boubekki
Shailee Jain
Ulf Brefeld
Leuphana, Lüneburg
University of Texas at Austin
Leuphana, Lüneburg
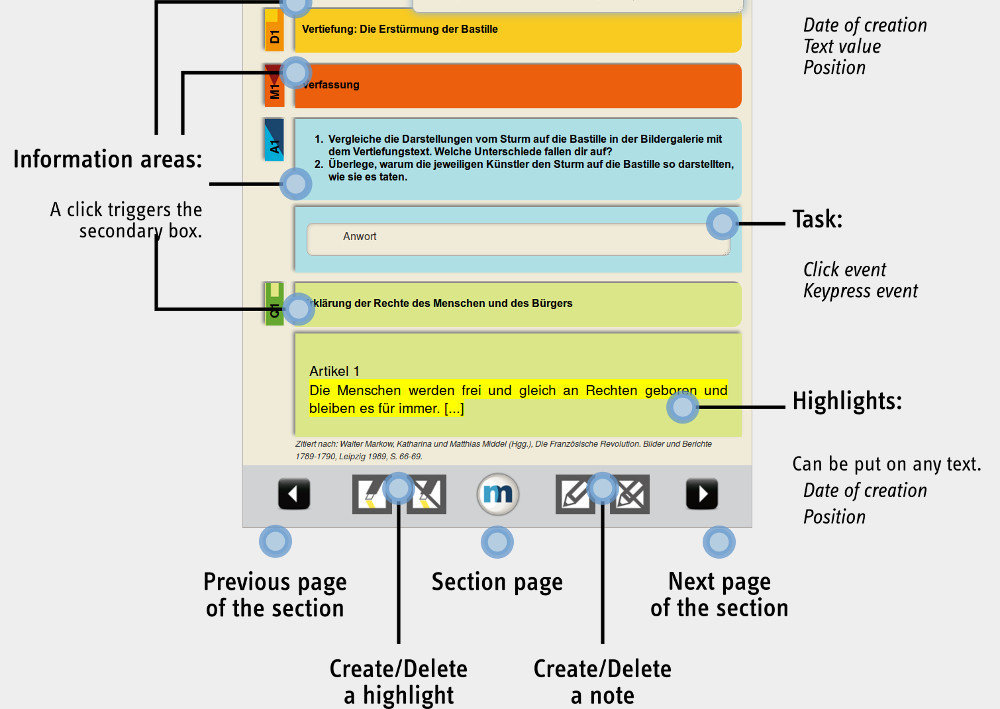
mBook
Multimedia history textbook used in German schools in Belgium.
Since 2013 : 6 chapters
725 pages
478 galleries
3 000 users
37 000 sessions
780 000 clicks
75 tracked events
The Project:

Research questions
Do all the pupils use the textbook the same way?
Is their behavior influenced by their ability in history or IT skills?
Can we predict the pupils ability in history or IT skills from their behavior?
How does the teacher influence these behaviors?
No
Local approach
Markov Chains
Markov Chains


Cluster 1
Cluster 2
Cluster 3
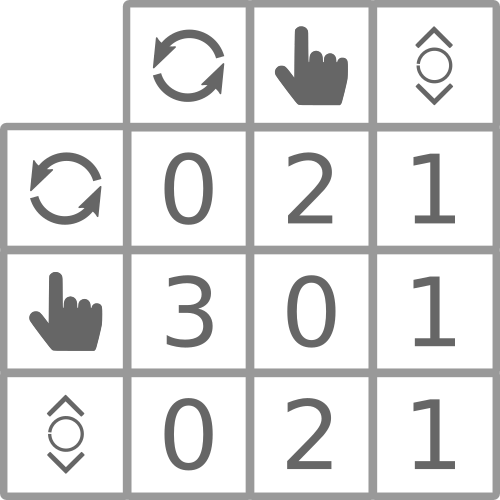
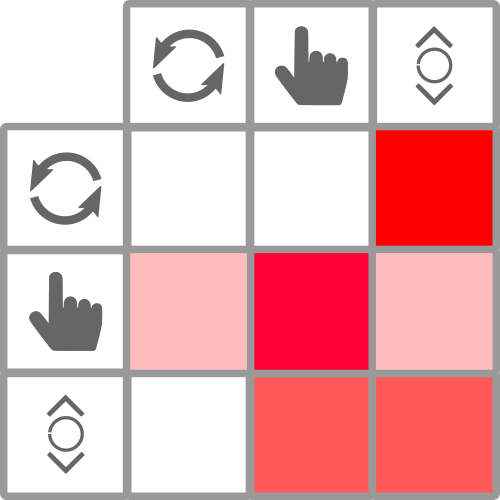
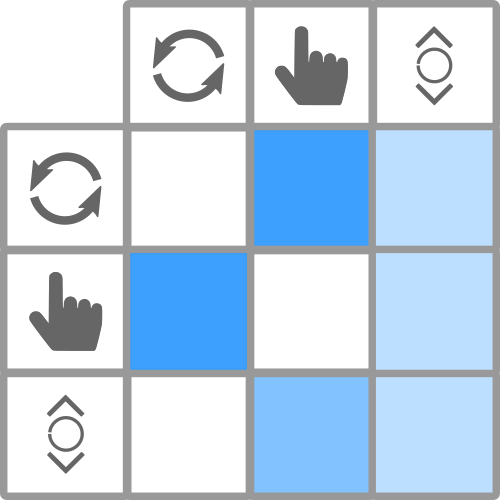
Markov Chains: Tracking
Markov Chains: Modeling
Markov Chains: Clustering
Markov Chains: Summary
Advantages
Drawbacks
- Simple,
- It can handle all the events,
- It can be complexified.
- Simple,
- Tend to overfit if complexified,
- It does not handle events duration easily.
Global approach
Trajectories
Trajectories

Trajectories
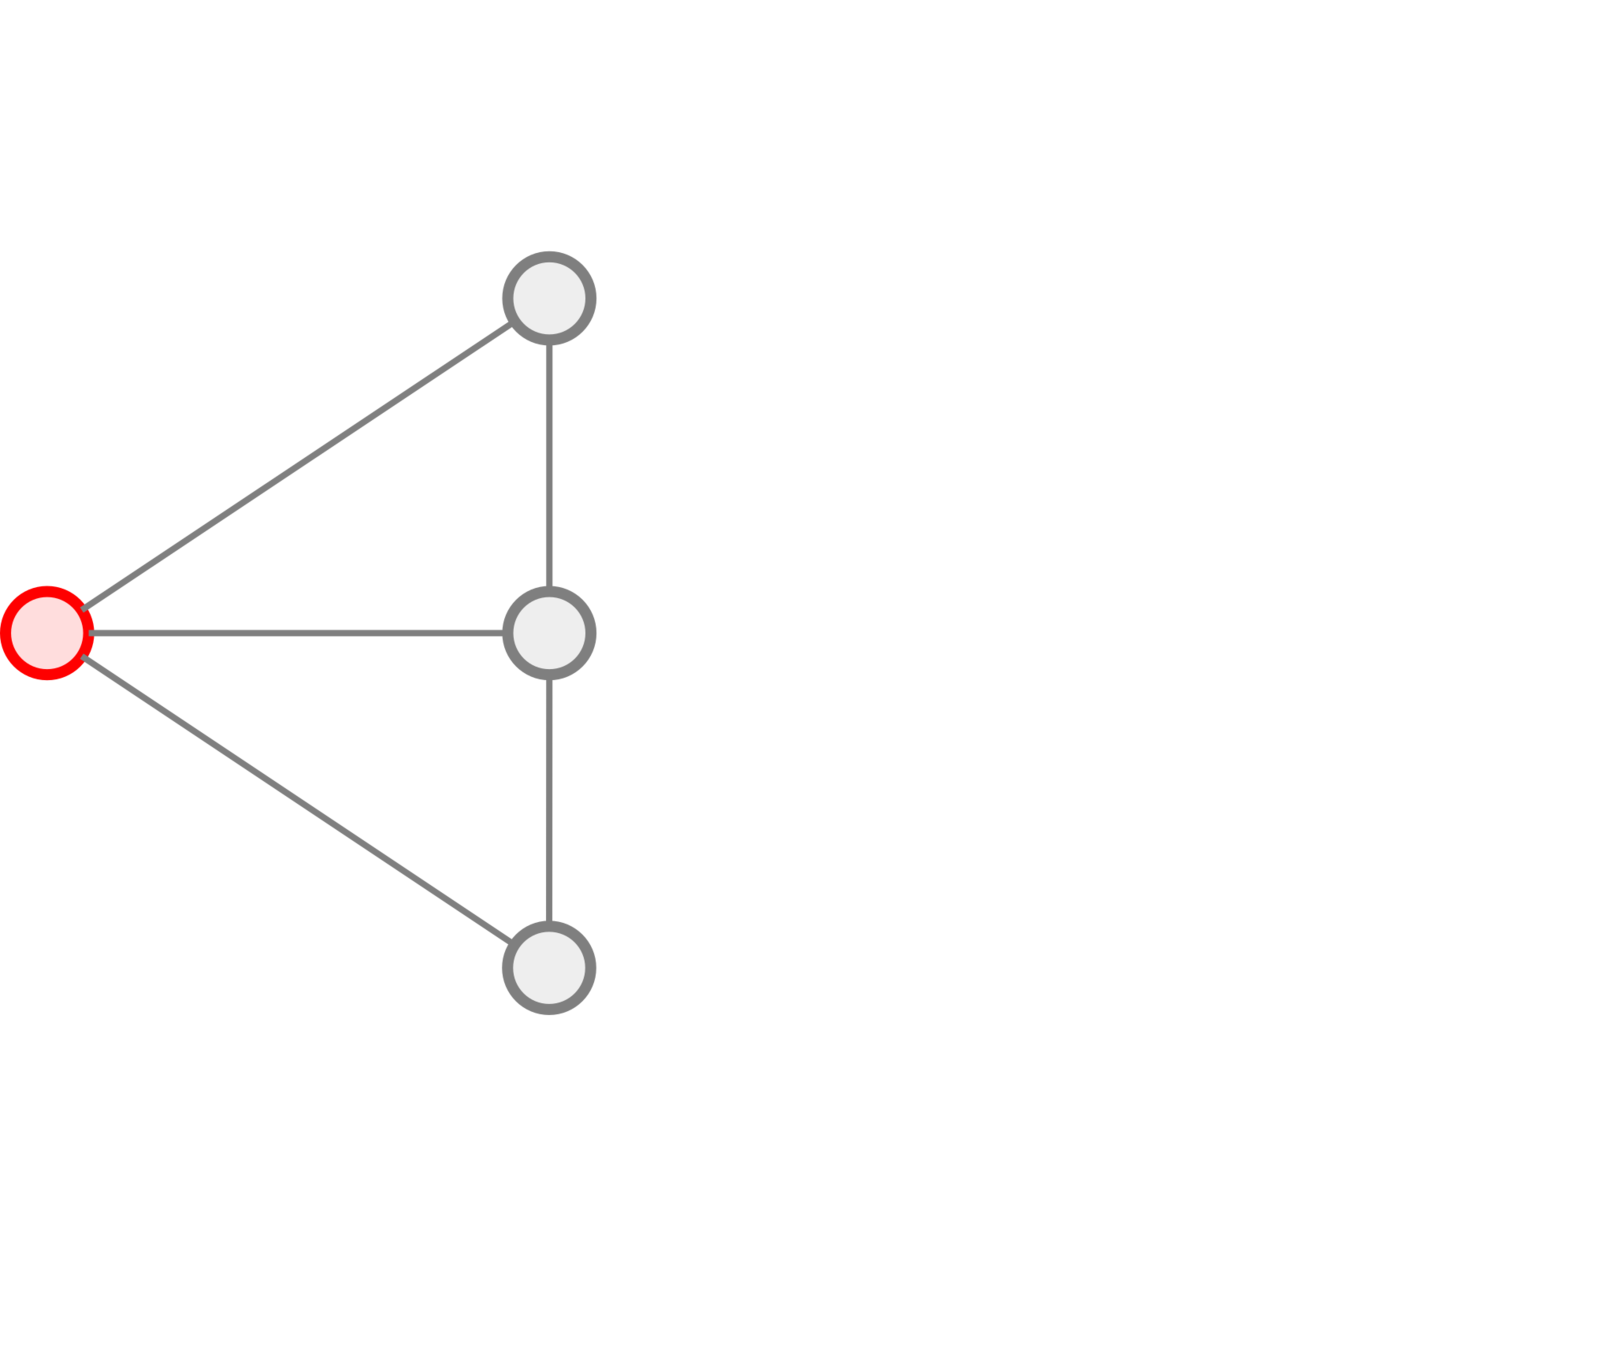
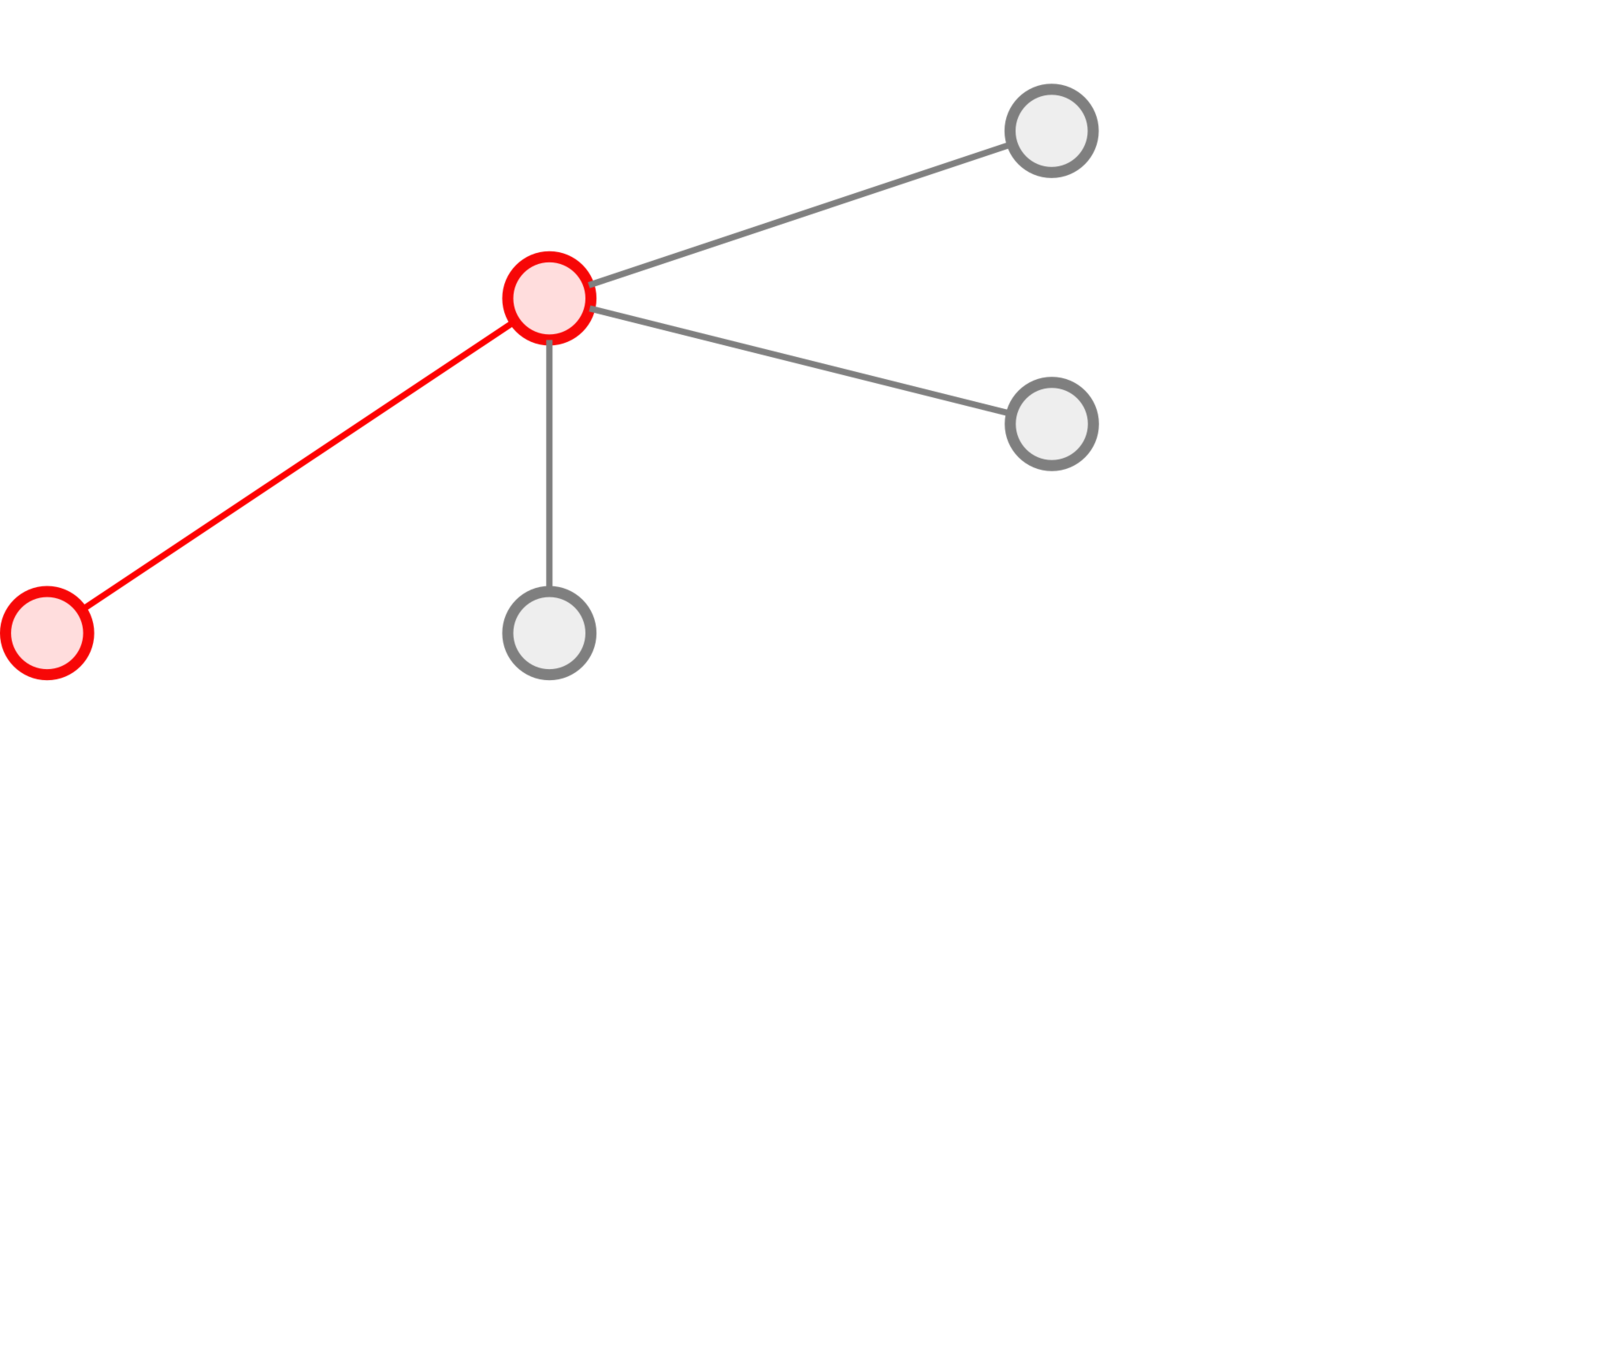
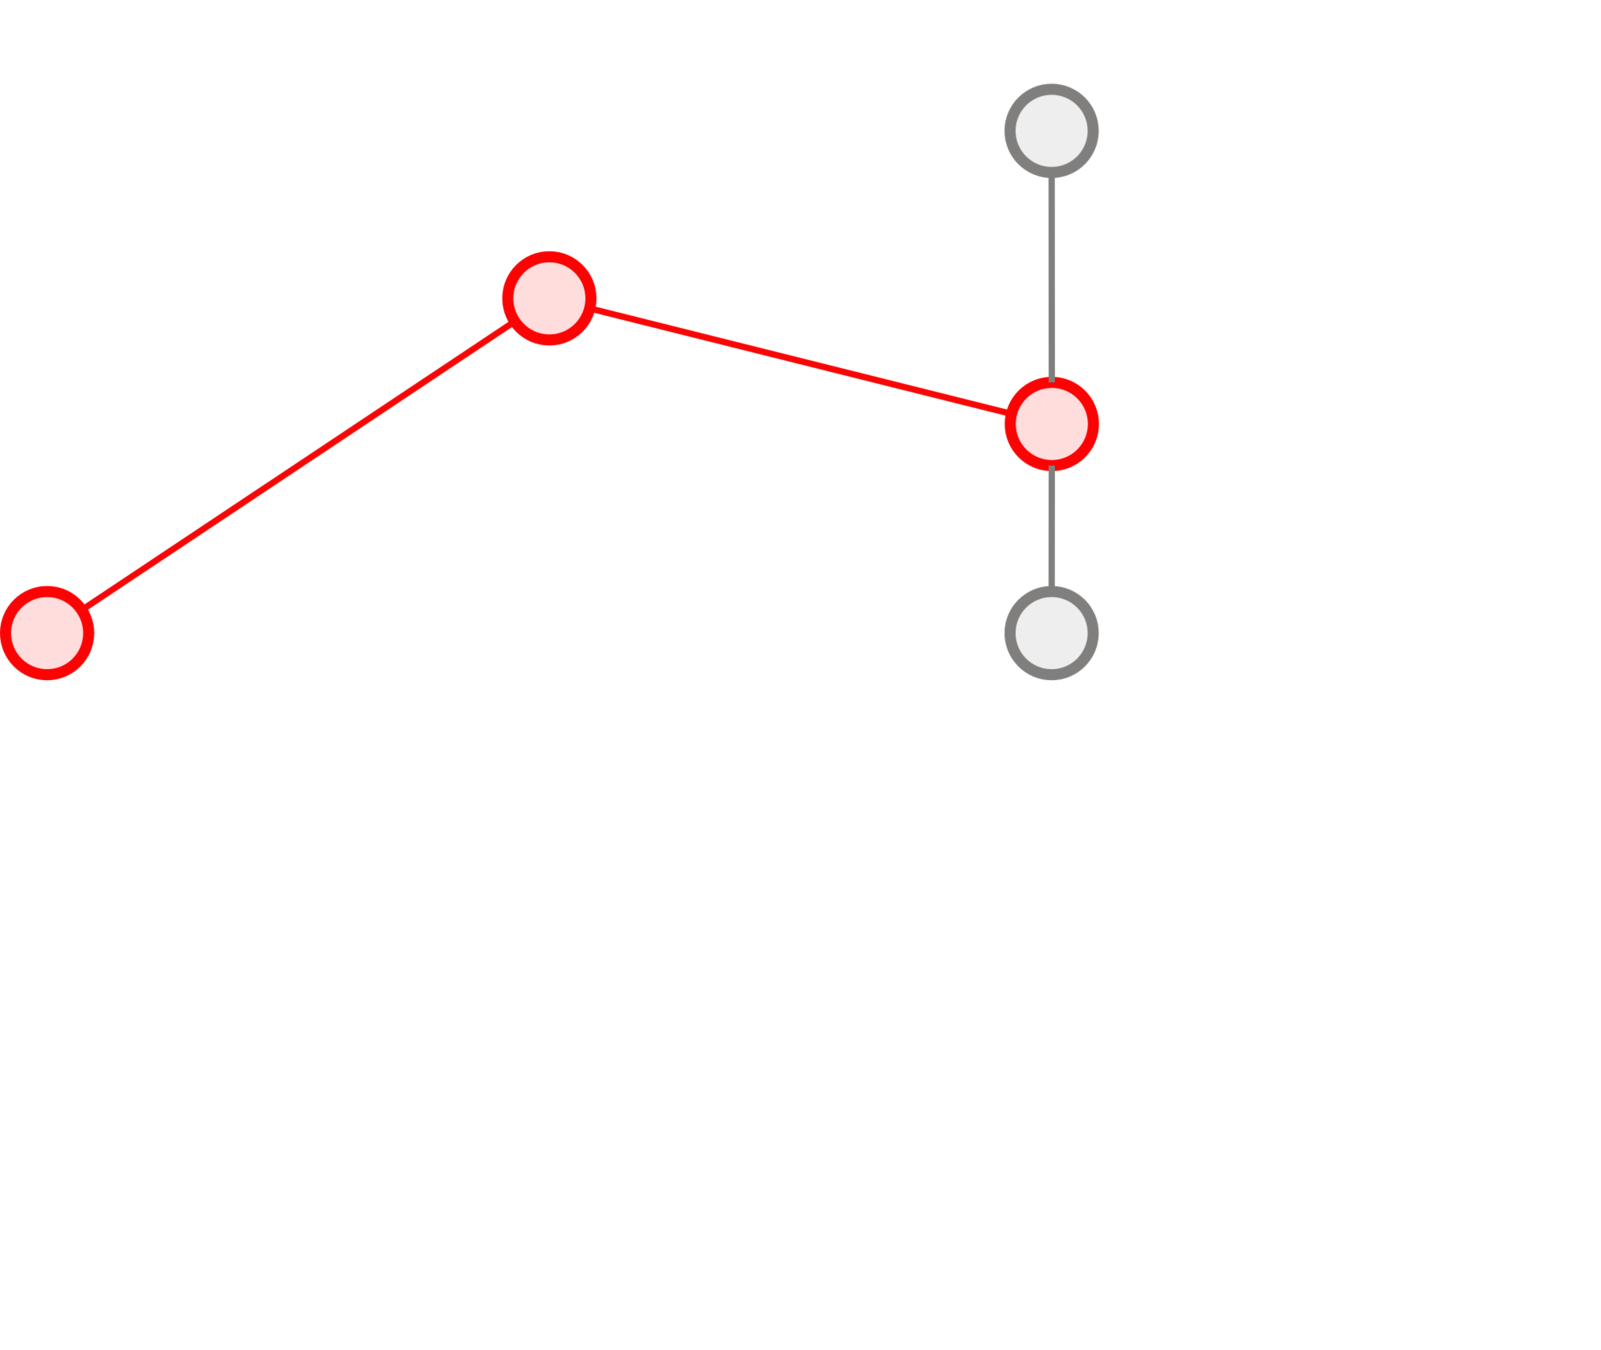
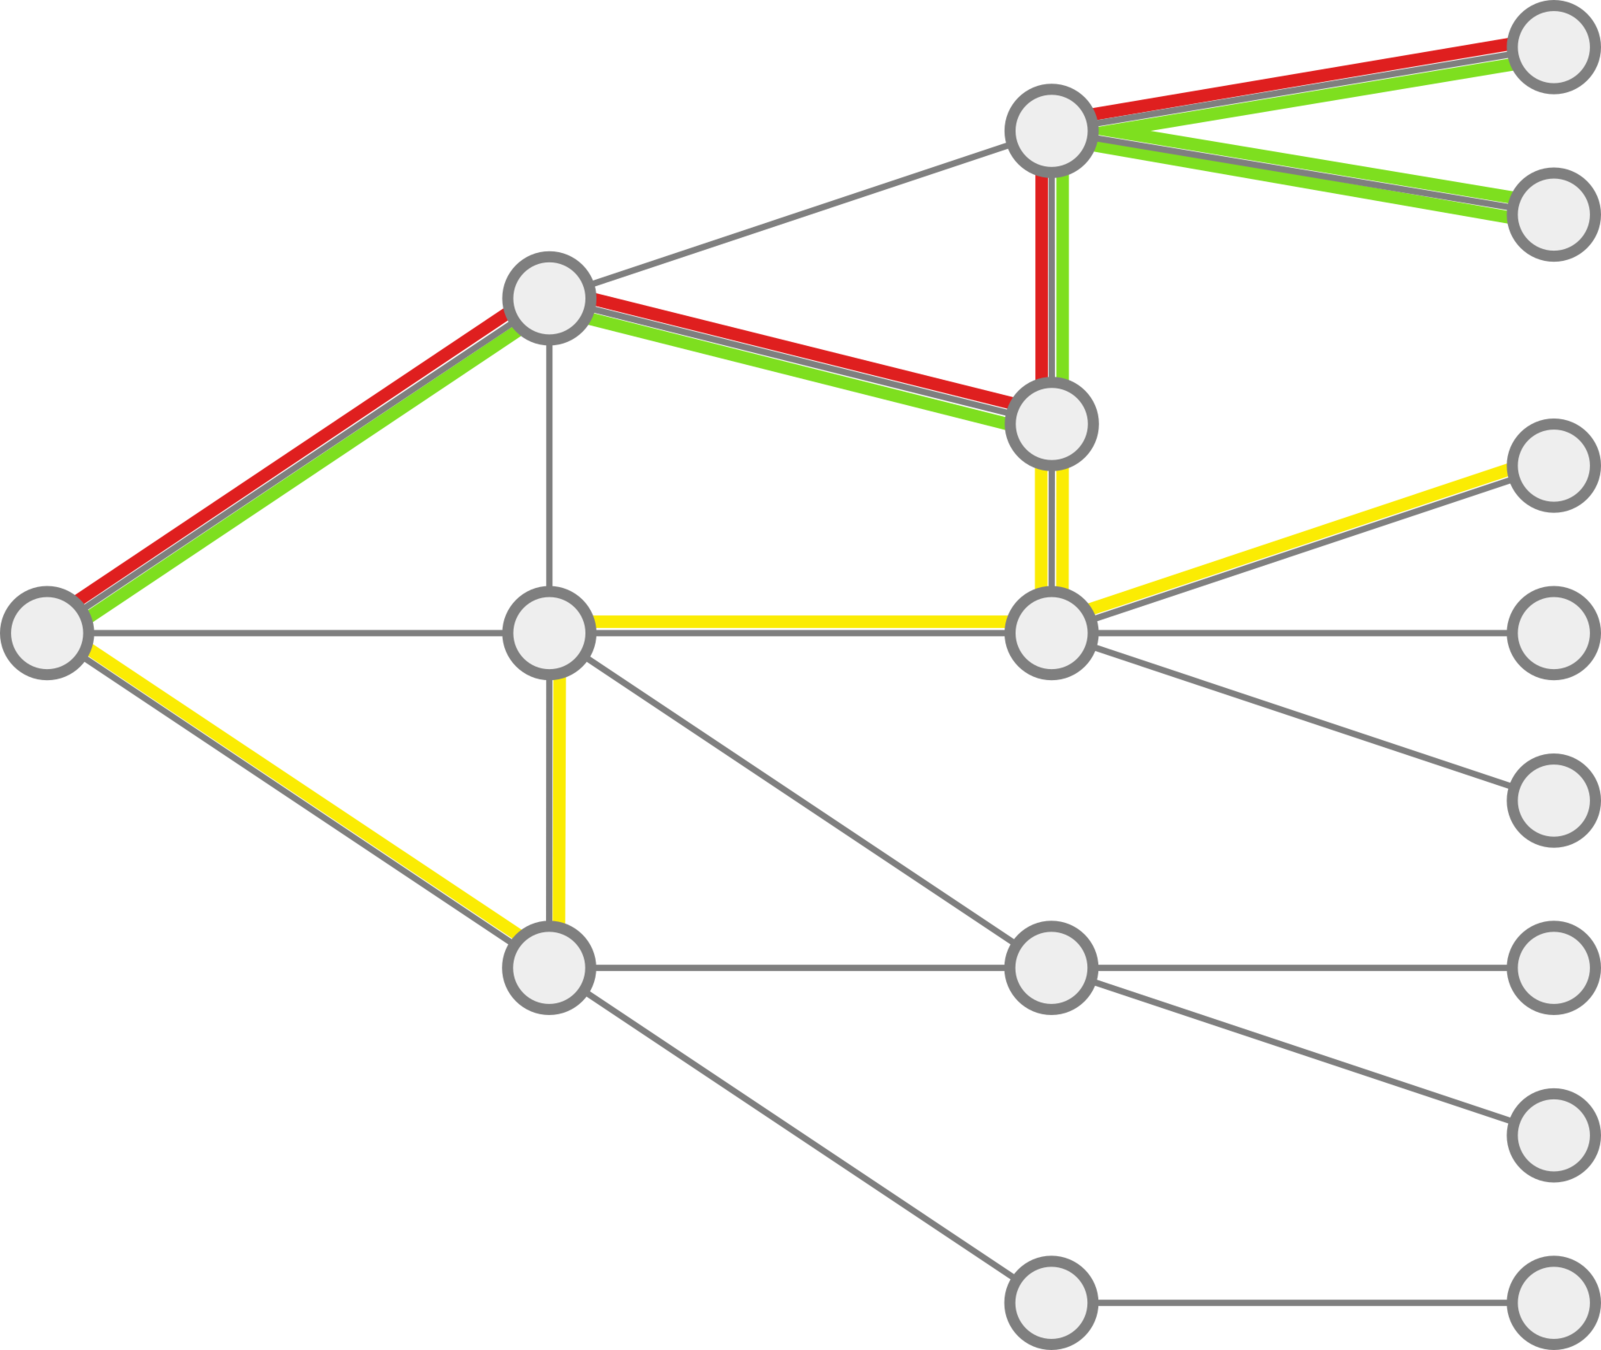
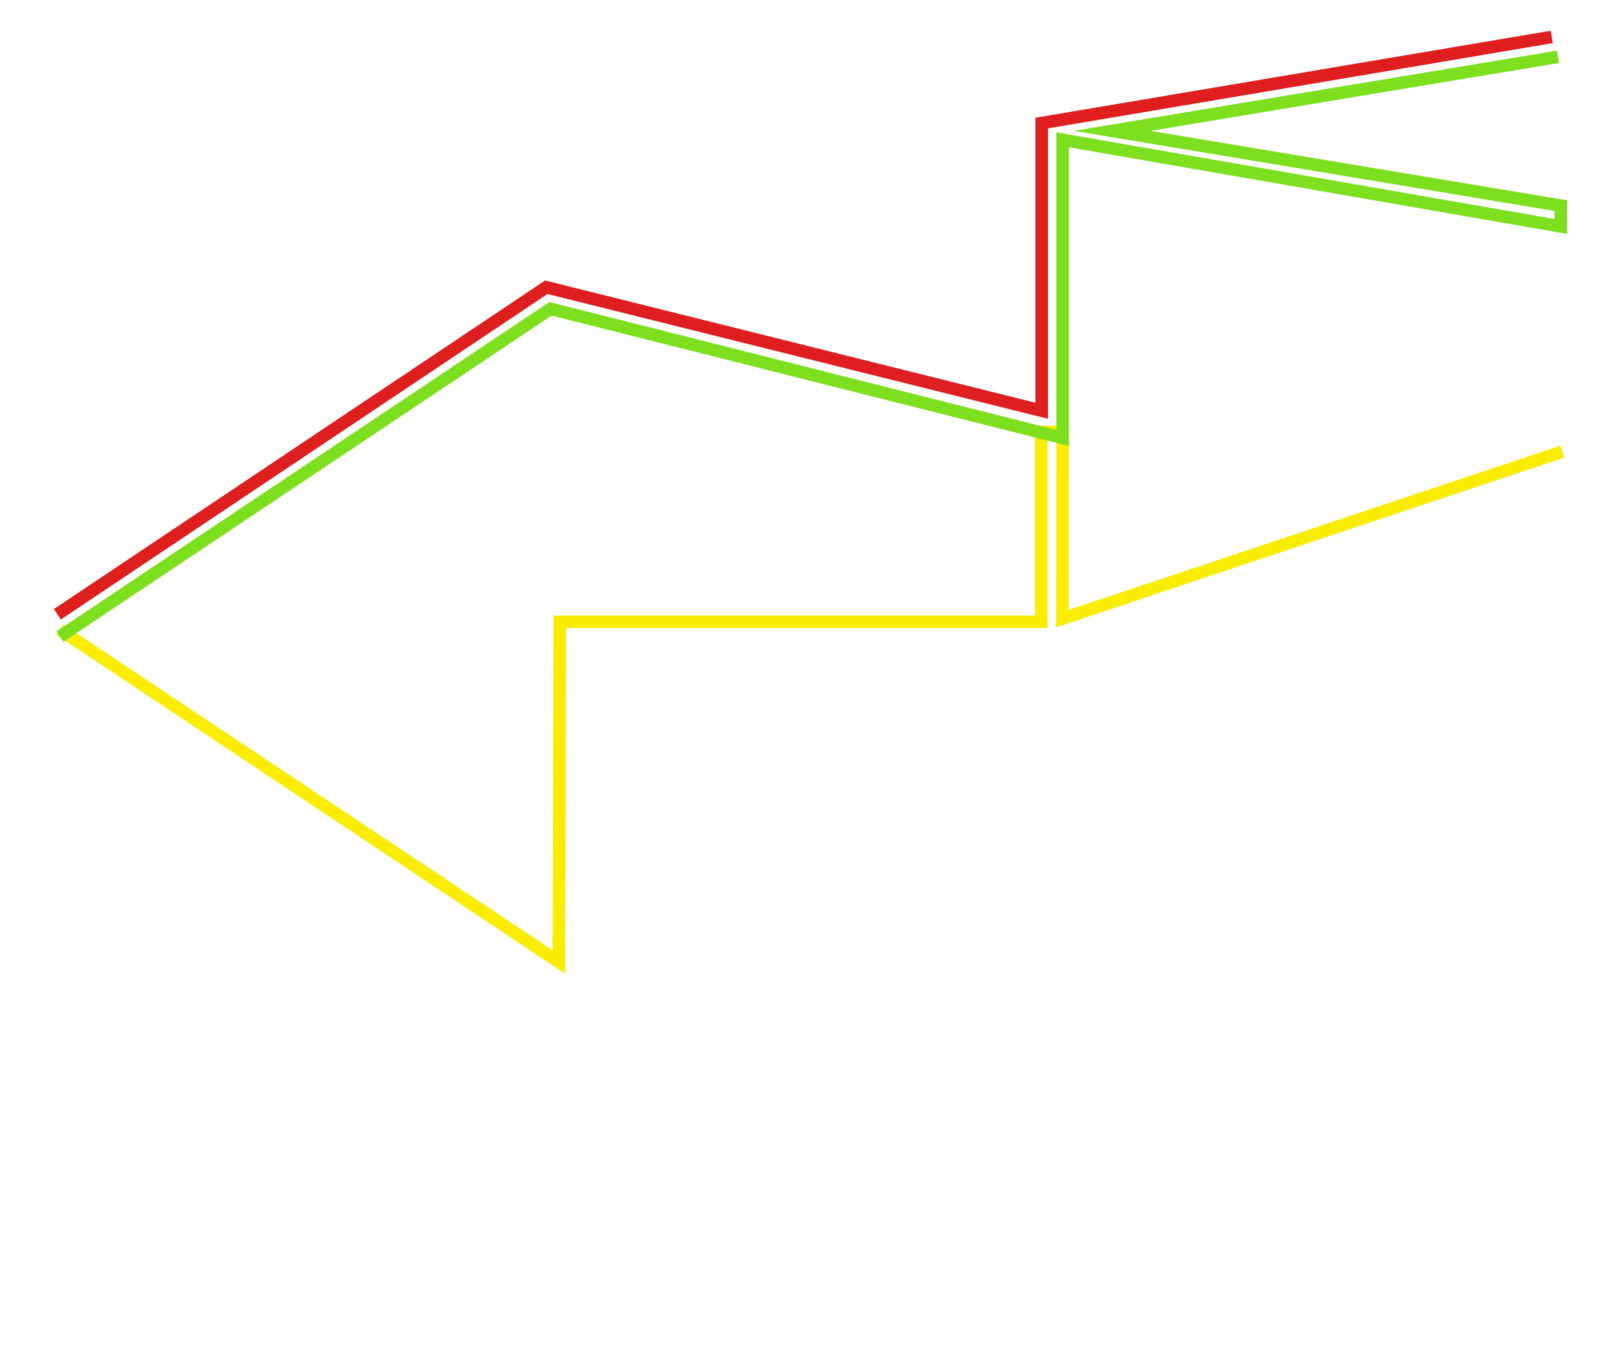
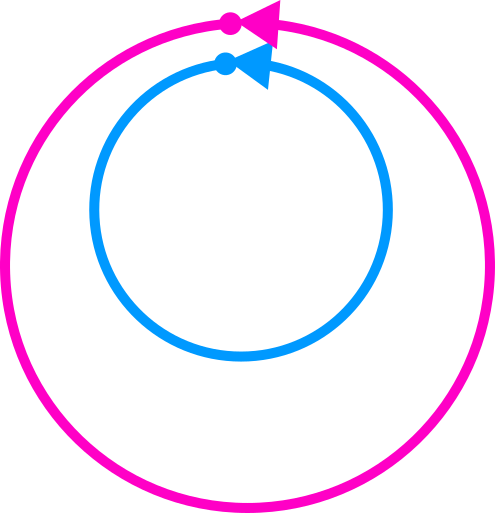
How do we compare paths in a graph?
What do we need:
- a distance between nodes,
- a distance between trajectories,
Shortest path
There are many : Hausdorff, DTW...
We transform them into spatial temporal trajectories.
that satisfies three properties.
There are many : Hausdorff, DTW...
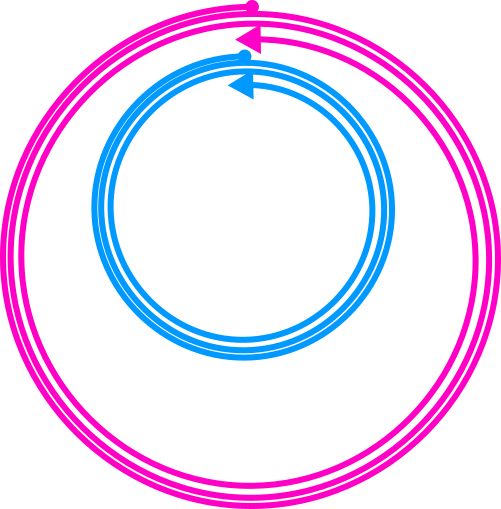
Property 1
The distance can compare two trajectories of different durations.
Property 2
The distance is independent of the speed.
Property 3
Repetition of cycles does not modify the distance.
Hausdorff
d_{\mathrm H}(X,Y) = \max\{\,\sup_{x \in X} \inf_{y \in Y} d(x,y),\, \sup_{y \in Y} \inf_{x \in X} d(x,y)\,\}
Let and be two non-empty subsets of a metric space.
We define their Hausdorff distance by
d_H(X,Y)
X
Y
Definition


Drawbacks
Outliers govern the distance.
Independent from time/duration.
Dynamic Time Warping
\begin{array}{l}
w_k = (x_i,y_j), \: 1 \leq i \leq N , \: 1\leq j \leq M , \\
w_1 = (x_1,y_1) , \\
w_K = (x_N,y_M) , \\
d(w_k) = d(x_i,y_j), \\
w_k = (x_i,y_j) \Rightarrow w_{k+1} \in \left\lbrace \begin{array}{c}
(x_i,y_{j+1}) \\ (x_{i+1},y_{j}) \\ (x_{i+1},y_{j+1})
\end{array} \right\rbrace. \\
\end{array}
Given two trajectories and , dynamic time warping (DTW) computes an alignment
X=(x_i)_N
Y=(y_i)_M
Definition

W=(w_k)_K
Finally the distance between and is then given by:
X
Y
\mathrm{DTW}(X,Y) = \min_{W} \sum_{k=1}^{|W|} d(w_k).
with the following properties:

Drawbacks
Very slow.
Temporal order broken.
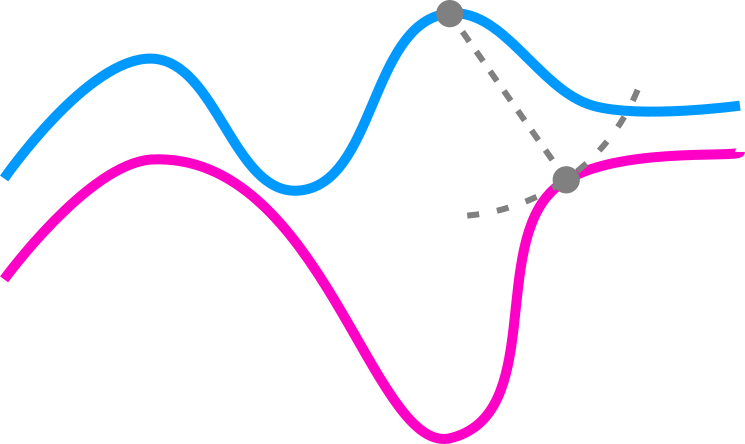
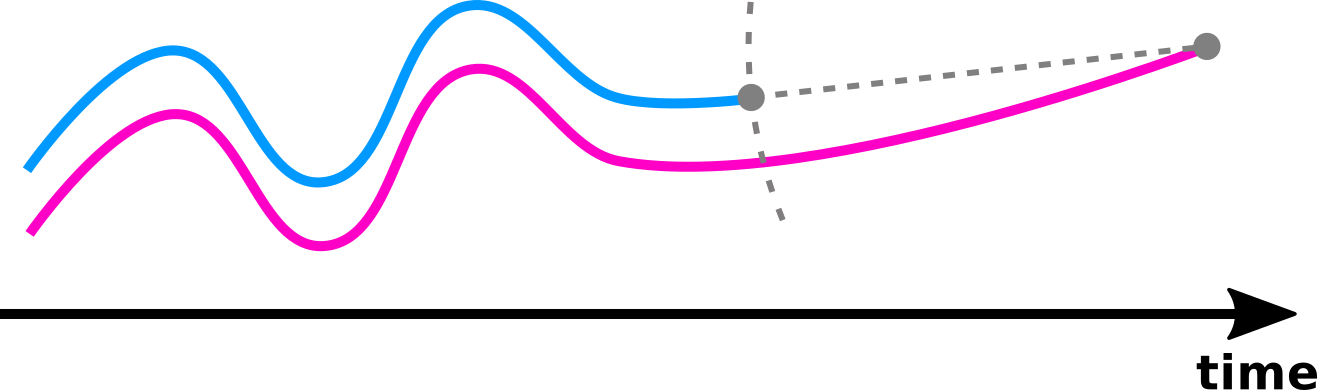
Let's build a distance
Property 1
Stop the comparison when the shortest trajectory ends.
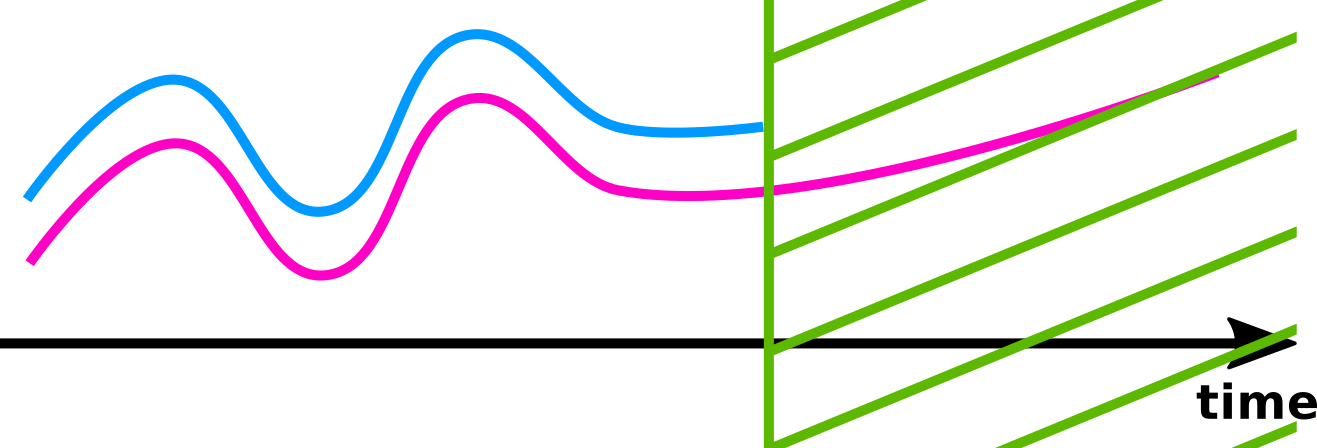
\Delta(X,Y) \quad \quad = \quad \quad\Delta(X,\mathrm{trunc}(Y))
The distance can compare two trajectories of different durations.
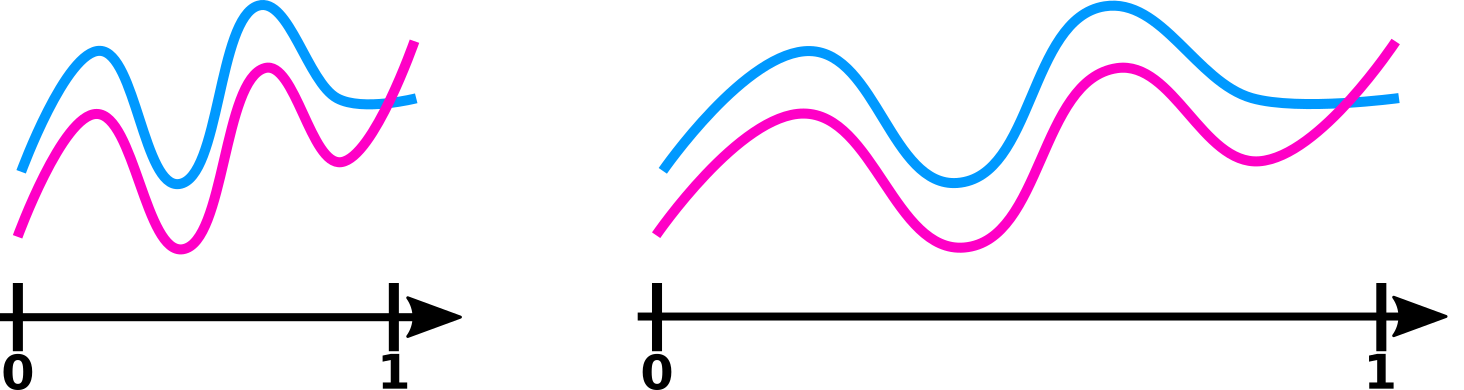
Property 2
The distance is independent of the speed.

\Delta(X,Y) \quad \quad = \quad \quad\Delta(X',Y')
Normalize the duration.
Property 3
Repetition of cycles does not modify the distance.
\Delta(X,Y) \quad \quad = \quad \quad\Delta(X',Y')
Normalize the duration.
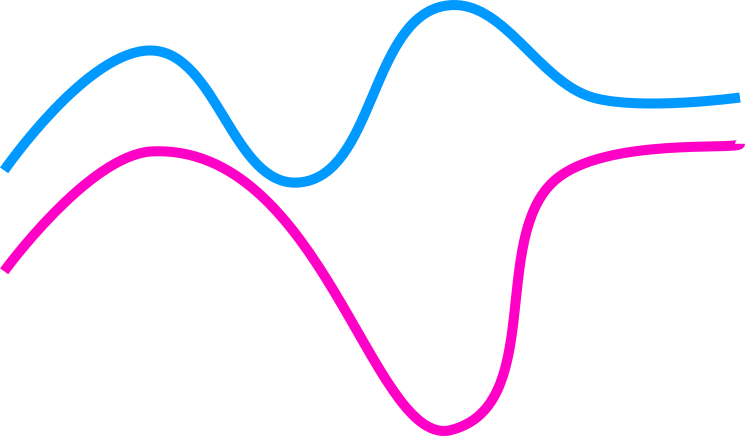
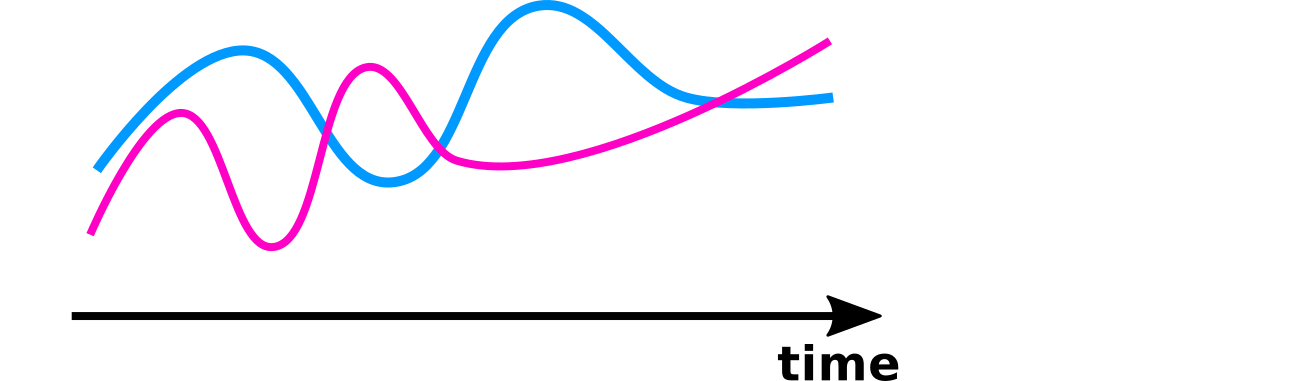
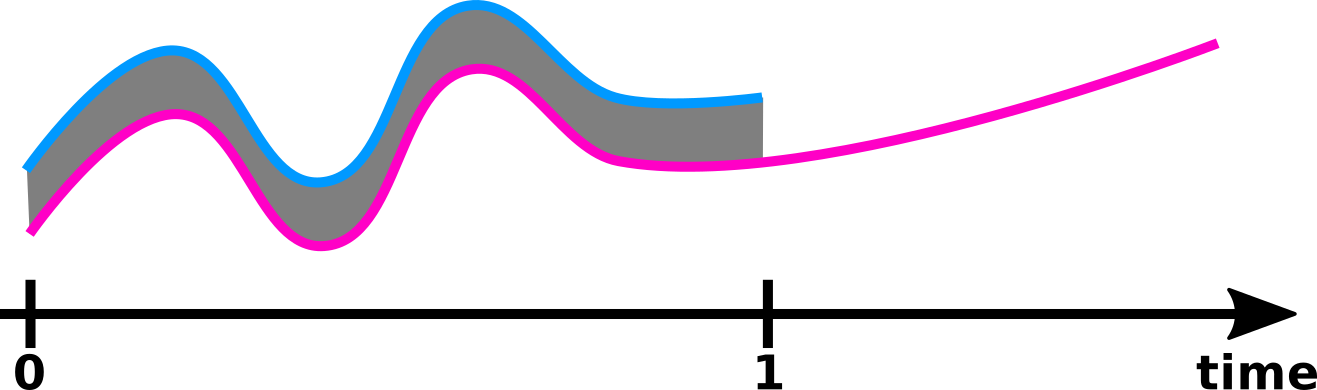
distance
Definition:
is defined as the normalized area spanned between and until the shortest one ends.
\Delta
\Delta(X,Y)
X
Y


Distance comparison
Comparison
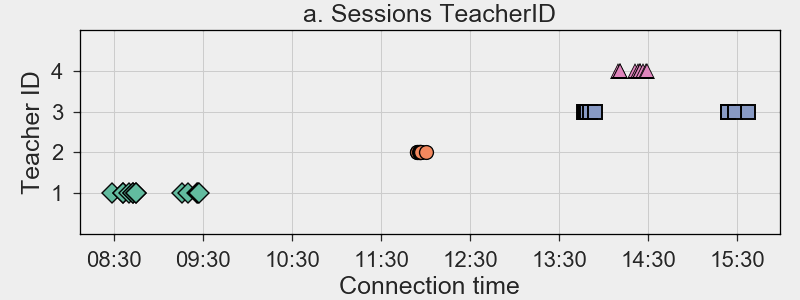
Setting
- 1 day,
- 41 session,
- 37 users,
- 4 teachers,
- 6 classes/groups.
WW2
Antiquity
Reformation
Hypothesis
Pupils in the same class, should be grouped together.
Algorithm
k-means with up to 20 clusters.

| Hausdorff | DTW | Delta | |
|---|---|---|---|
| # Clusters | 8 | 9 | 10 |
| Homogeneity | 0.39 | 0.97 | 0.97 |
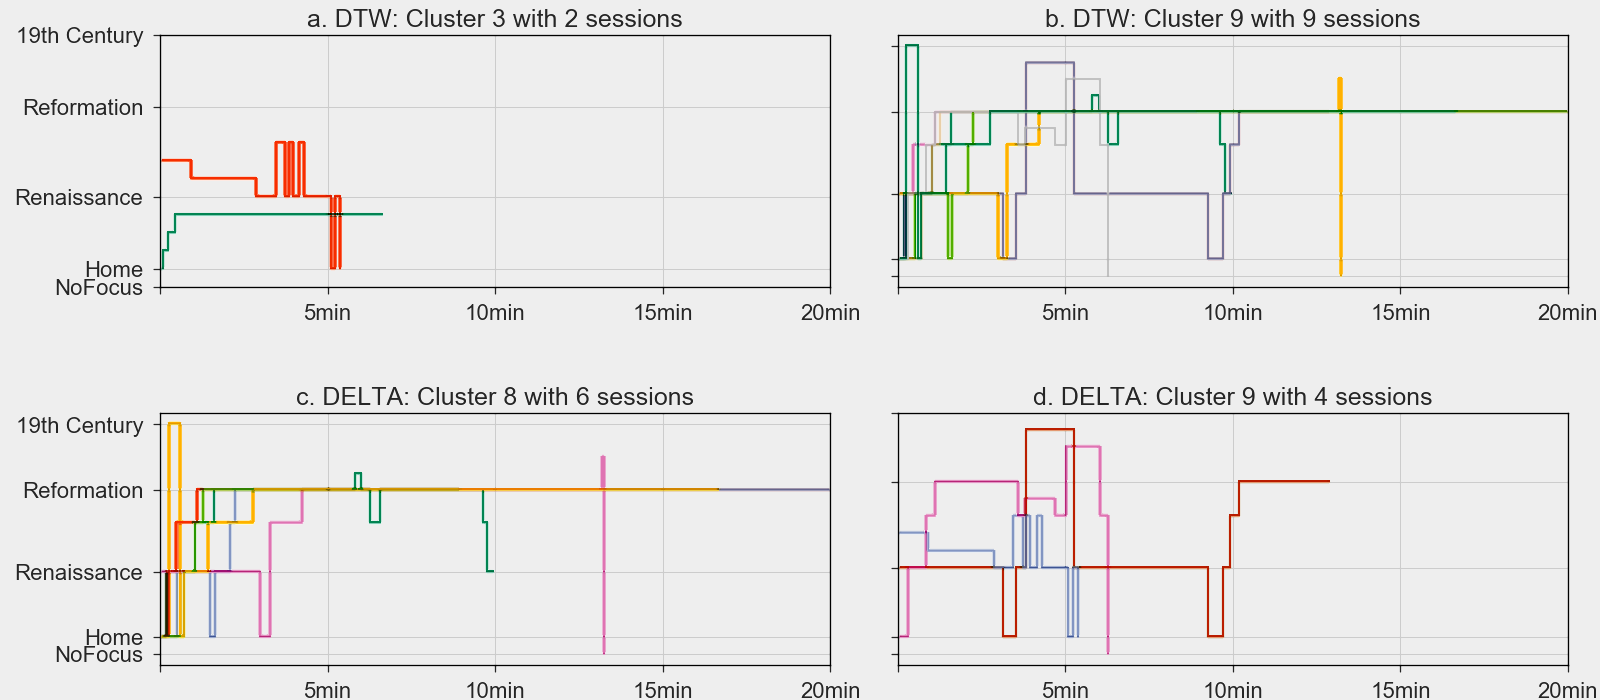
- Both successfully detects topics.
- also detects similar/divergent behaviors.
\Delta
Correlations
Can Δ be used as a psychometrics indicator?
Can Δ be used as a teaching style indicator?
Correlations
Definitions:
\psi_\Delta(u,\mathcal{C})
is the average distance between one pupil and her classmates during one class session .
u
\mathcal{C}
\psi_\Delta(u,\mathcal{C}) = \frac{1}{\#\mathcal{C}}\sum_{c \in \mathcal{C}} \Delta(u,c)
Correlations
Five psychometrics scores:
| Competency | Knowledge | Motivation | IT Access | IT Skills | |
|---|---|---|---|---|---|
| 0.179 | 0.096 | -0.17 | 0.023 | 0.092 | |
| PPM | 0.145 | 0.133 | 0.039 | -0.002 | 0.019 |
| EPM | 0.184 | 0.156 | -0.065 | -0.022 | 0.063 |
| Competency | Knowledge | Motivation | IT Access | IT Skills | |
|---|---|---|---|---|---|
| -0.224 | -0.165 | -0.096 | -0.069 | -0.357 | |
| PPM | -0.232 | 0.049 | 0.111 | 0.188 | -0.156 |
| EPM | -0.232 | -0.141 | -0.142 | 0.081 | 0.059 |
| Competency | Knowledge | Motivation | IT Access | IT Skills |
|---|
Activity Indicators
PPM: Pages per minutes
EPM: Events per minutes
: Average distance between one pupil and her
classmates
\psi_\Delta
Settings:
400 class sessions between Feb. and July 2017.
Two teachers in two different schools.
Teacher B
Teacher A
p-value < 5% marked in bold face
\psi_\Delta
\psi_\Delta
Correlations
Can Δ be used as a psychometrics indicator?
Yes
Can Δ be used as a teaching style indicator?
Correlations
Definitions:
\psi_\Delta(u,\mathcal{C})
is the average distance between one pupil and her classmates during one class session .
u
\mathcal{C}
\psi_\Delta(u,\mathcal{C}) = \frac{1}{\#\mathcal{C}}\sum_{c \in \mathcal{C}} \Delta(u,c)
\Psi_\Delta(\mathcal{C})
is the average of during one class session .
\psi_\Delta
\mathcal{C}
\Psi_\Delta(\mathcal{C}) = \frac{1}{\#\mathcal{C}}\sum_{u \in \mathcal{C}} \psi_\Delta(u,\mathcal{C})
Correlations
The greater the more freedom is given to the pupils.
Correlations
Correlations
| Competency | |
|---|---|
| 0.179 | |
| PPM | 0.145 |
| EPM | 0.184 |
| Competency | |
|---|---|
| -0.224 | |
| PPM | -0.232 |
| EPM | -0.232 |
Teacher B
Teacher A
The difference is significant.
\psi
\psi
| 4.48 |
| 5.76 |
\Psi
\Psi
Pupils diverging from the teaching style perform worst.
All correlations are significant.
Correlations
Can Δ be used as a psychometrics indicator?
Yes
Can Δ be used as a teaching style indicator?
Yes
Yes
Summary
Summary
- Track users using spatio-temporal trajectories.
- Built a distance between trajectories:
- Usual clustering algorithms can used
- Interpretable and meaningful clusterings
- Pupils: a -based indicator correlates with psychometrics scores
- Teachers: a -based indicator captures teaching style.
\Delta
\Delta
\Delta
Mining User Trajectories
in Electronic Textbooks
Ahcène Boubekki
Shailee Jain
Ulf Brefeld
Leuphana, Lüneburg
University of Texas at Austin
Leuphana, Lüneburg
Mining User Trajectories in Electronic Text Books
By ahcene


