Analysis of User Behavior
Ahcène Boubekki
Leuphana, Lüneburg
UiT, Tromsø
in Educational Science

The mBook Project
The mBook Project
Objectives
Evaluate the use of an electronic textbook for history in middle school
Bring new methods to Educational Science
The mBook Project
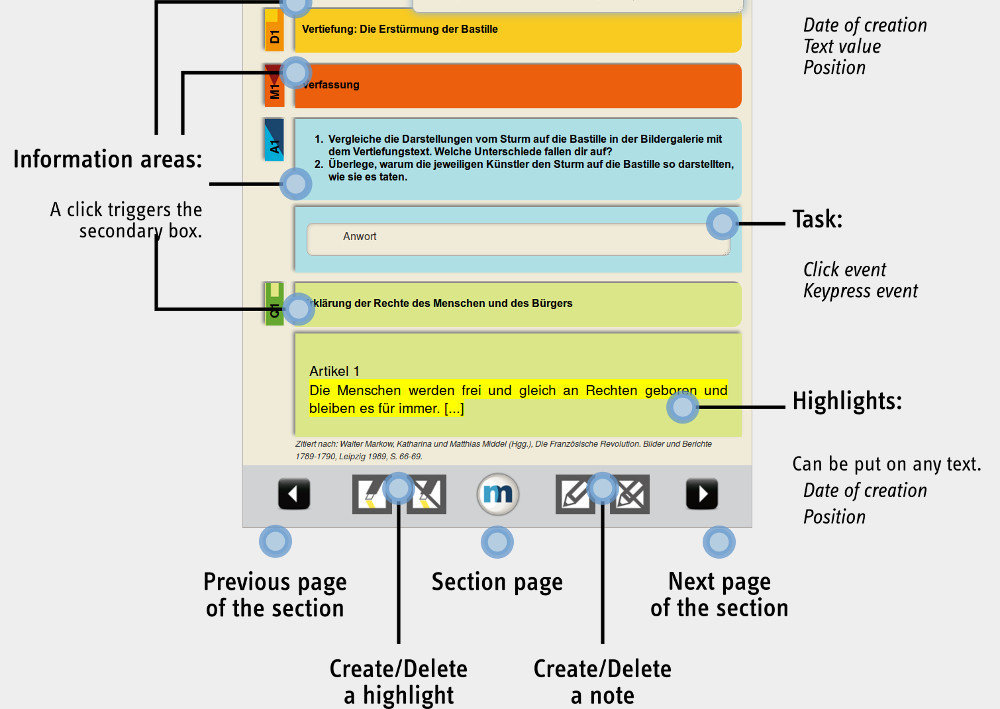
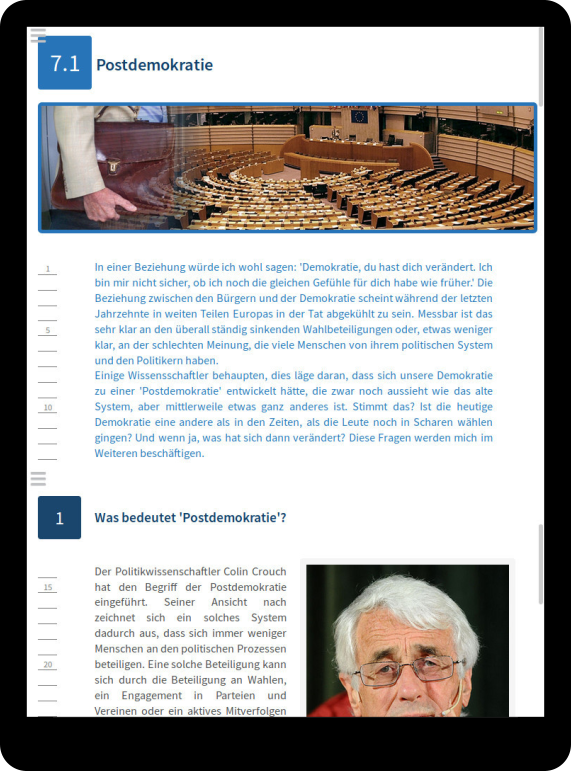
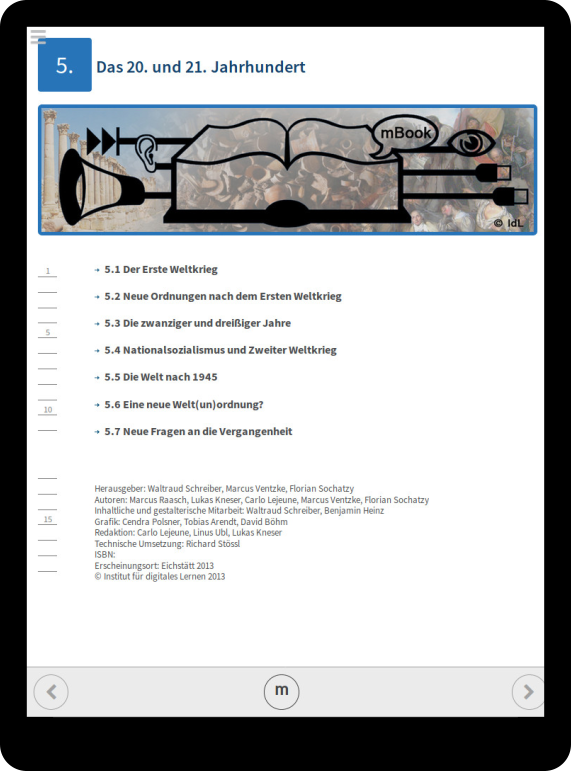
The mBook

The mBook Project
Some statistics

From January 31st to July 11th 2017
2,197 sessions
400 users
195 pupils (537 sessions)
The mBook Project
Classical Approaches
Bi-variate factor analysis

Markov Chains
Contributions
Summary
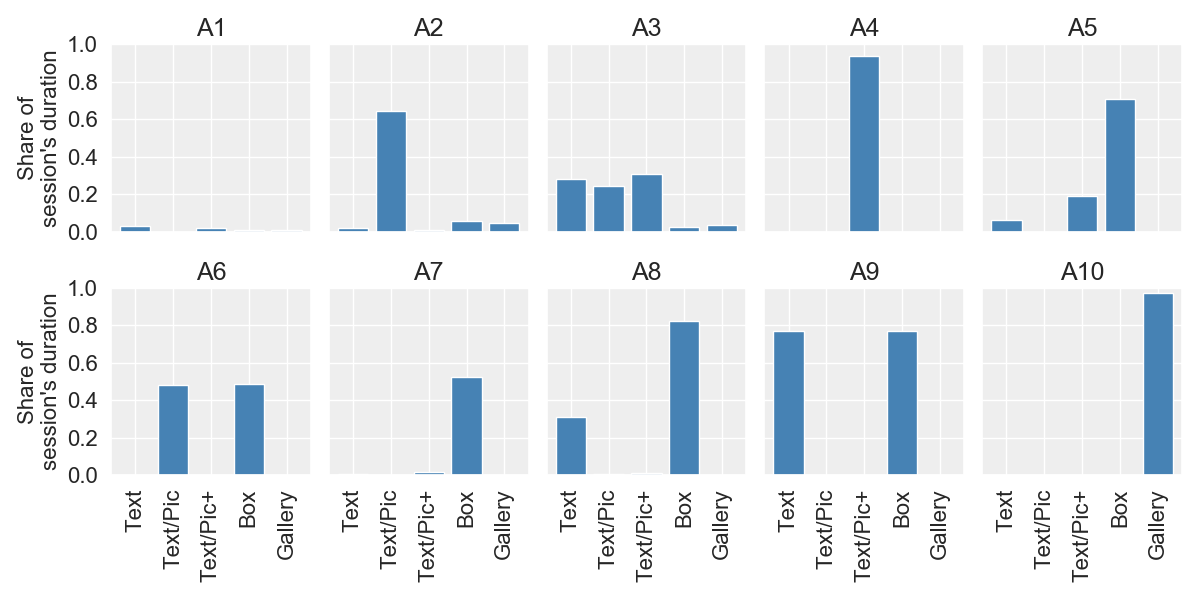
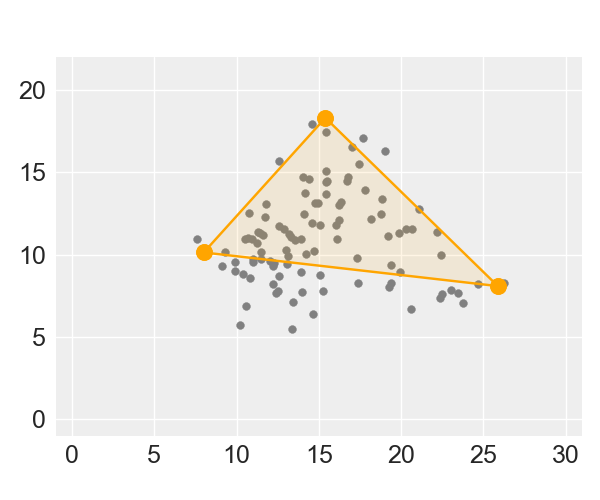
Archetypal Analysis
Content Analysis
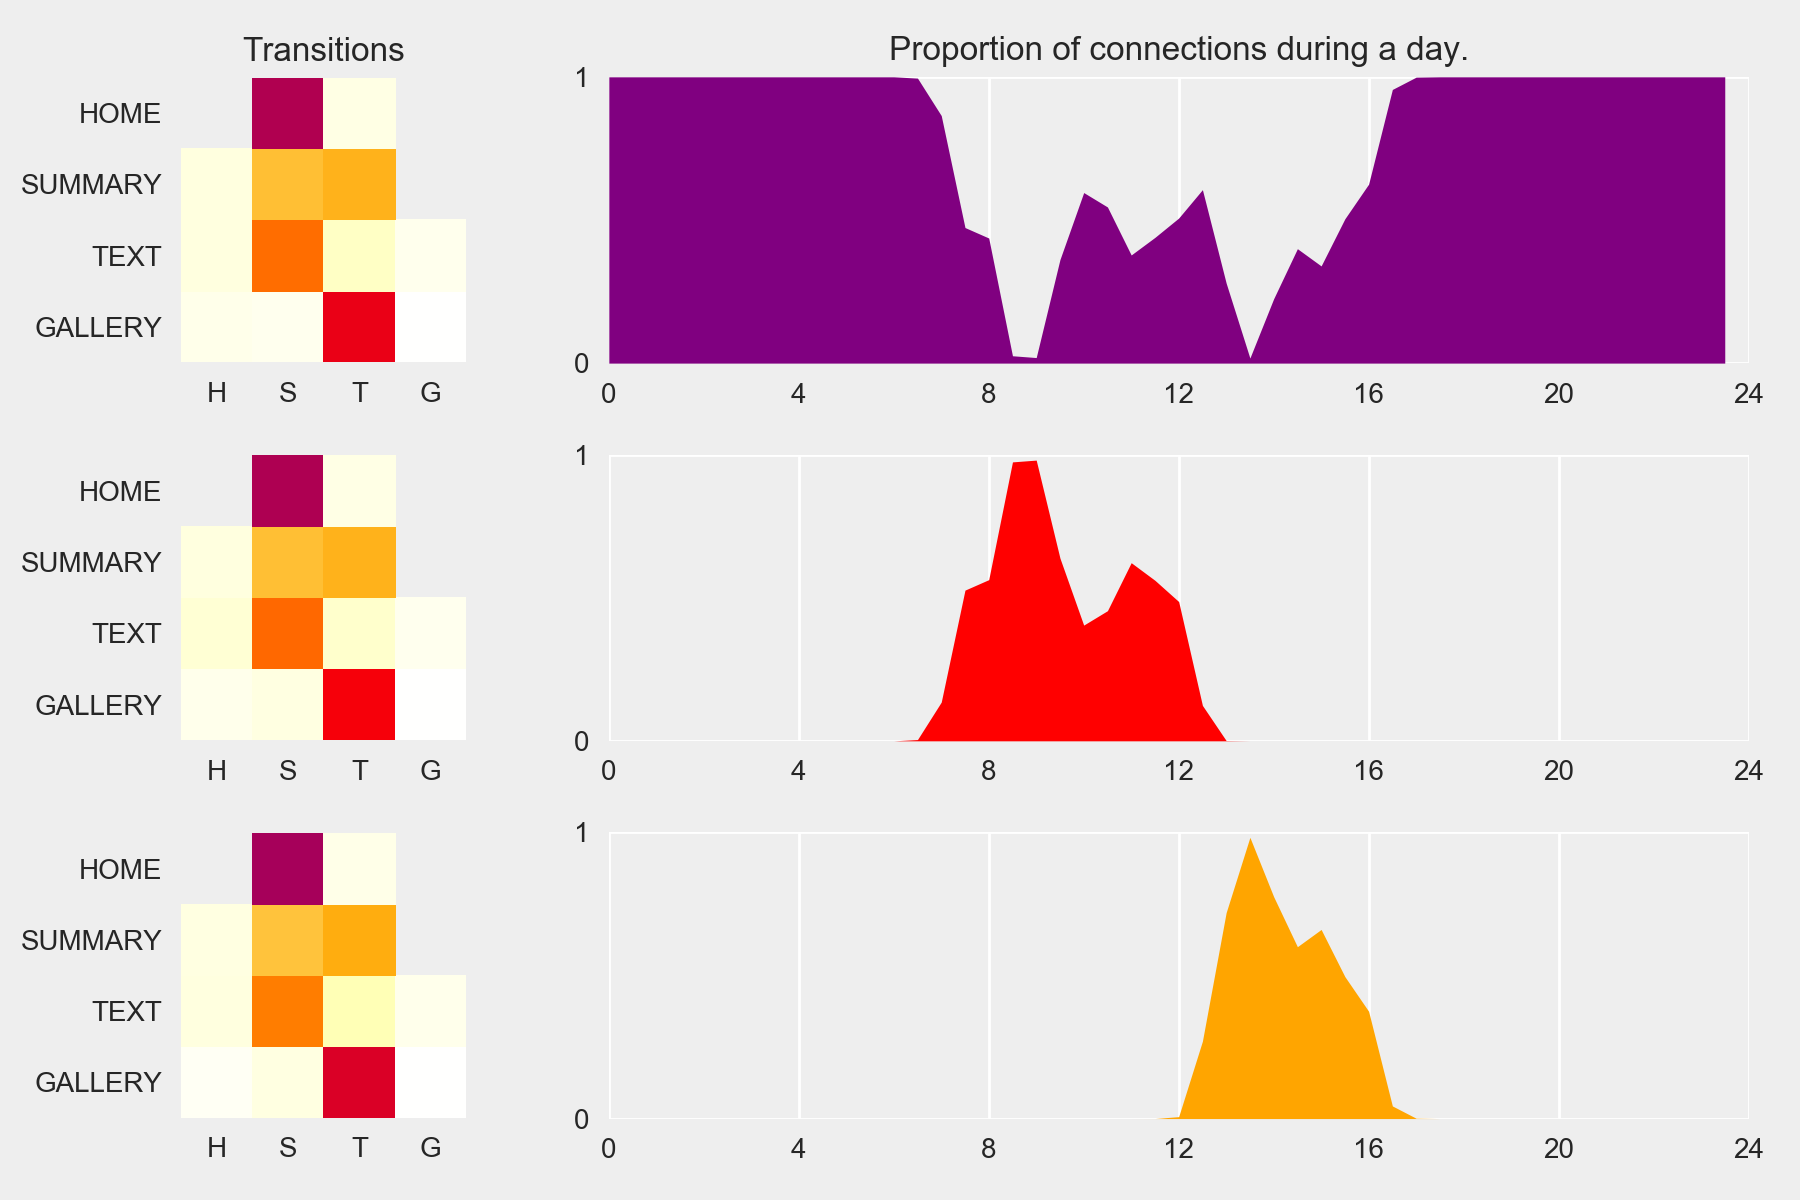
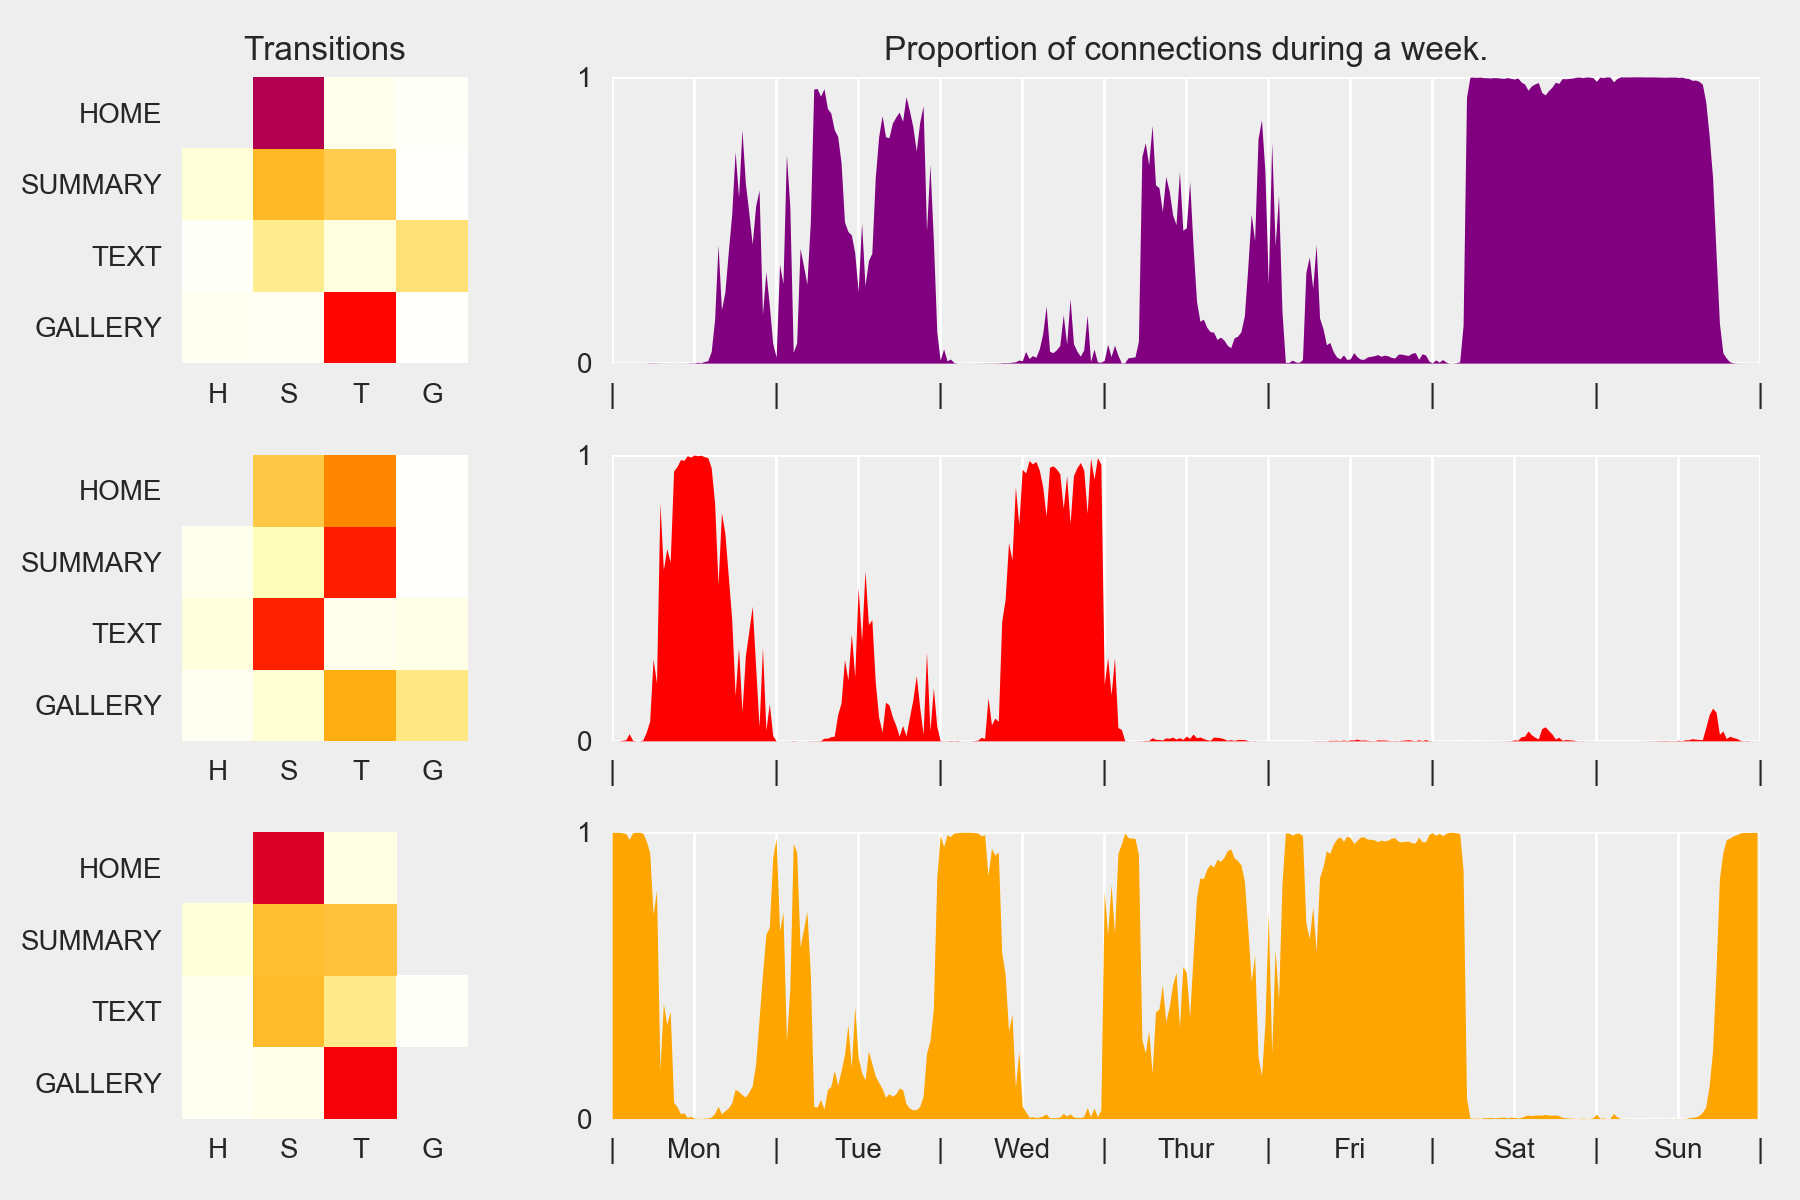
Markov Chains
Periodic Behaviors
Bayesian Markov Chains
Scrolling Behaviors
Trajectories
Online Behaviors
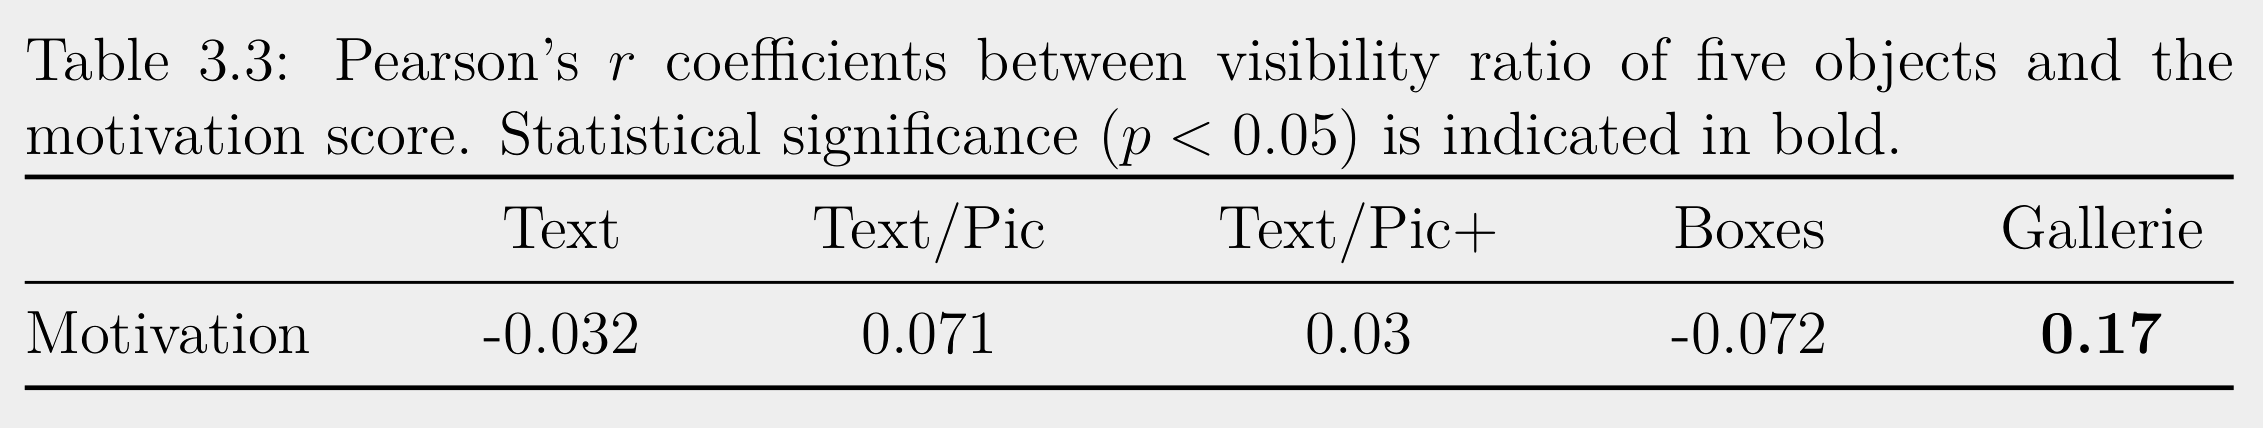
Archetypal Analysis and Content Analysis
Is there a correlation between the visibility time of
highly informative content and motivation?
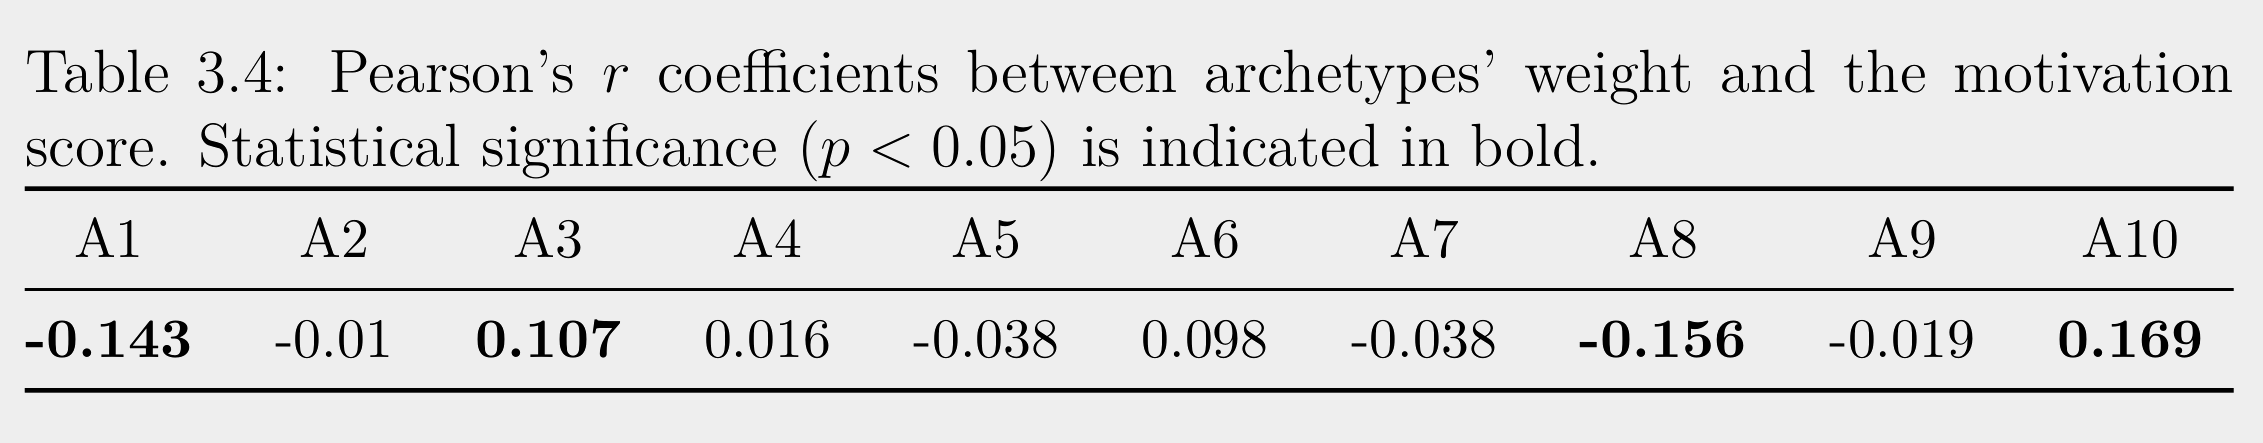

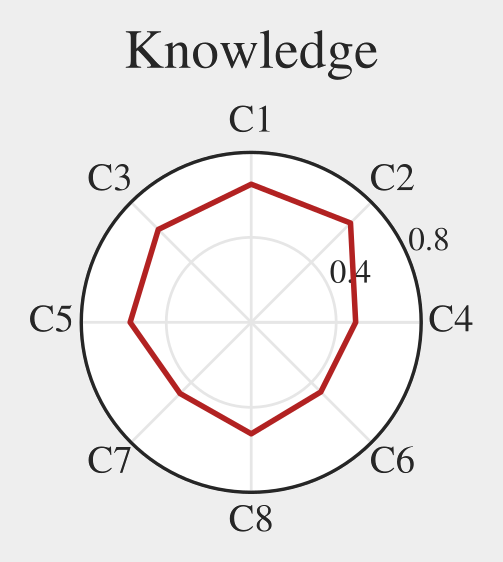
Archetypal Analysis
Strange
\textbf{A8}
\textbf{-0.156}
Explained by the sequences
Objective
To enclose the data within a convex k-polyhedron while minimizing the reconstruction loss.

Simple factor analysis
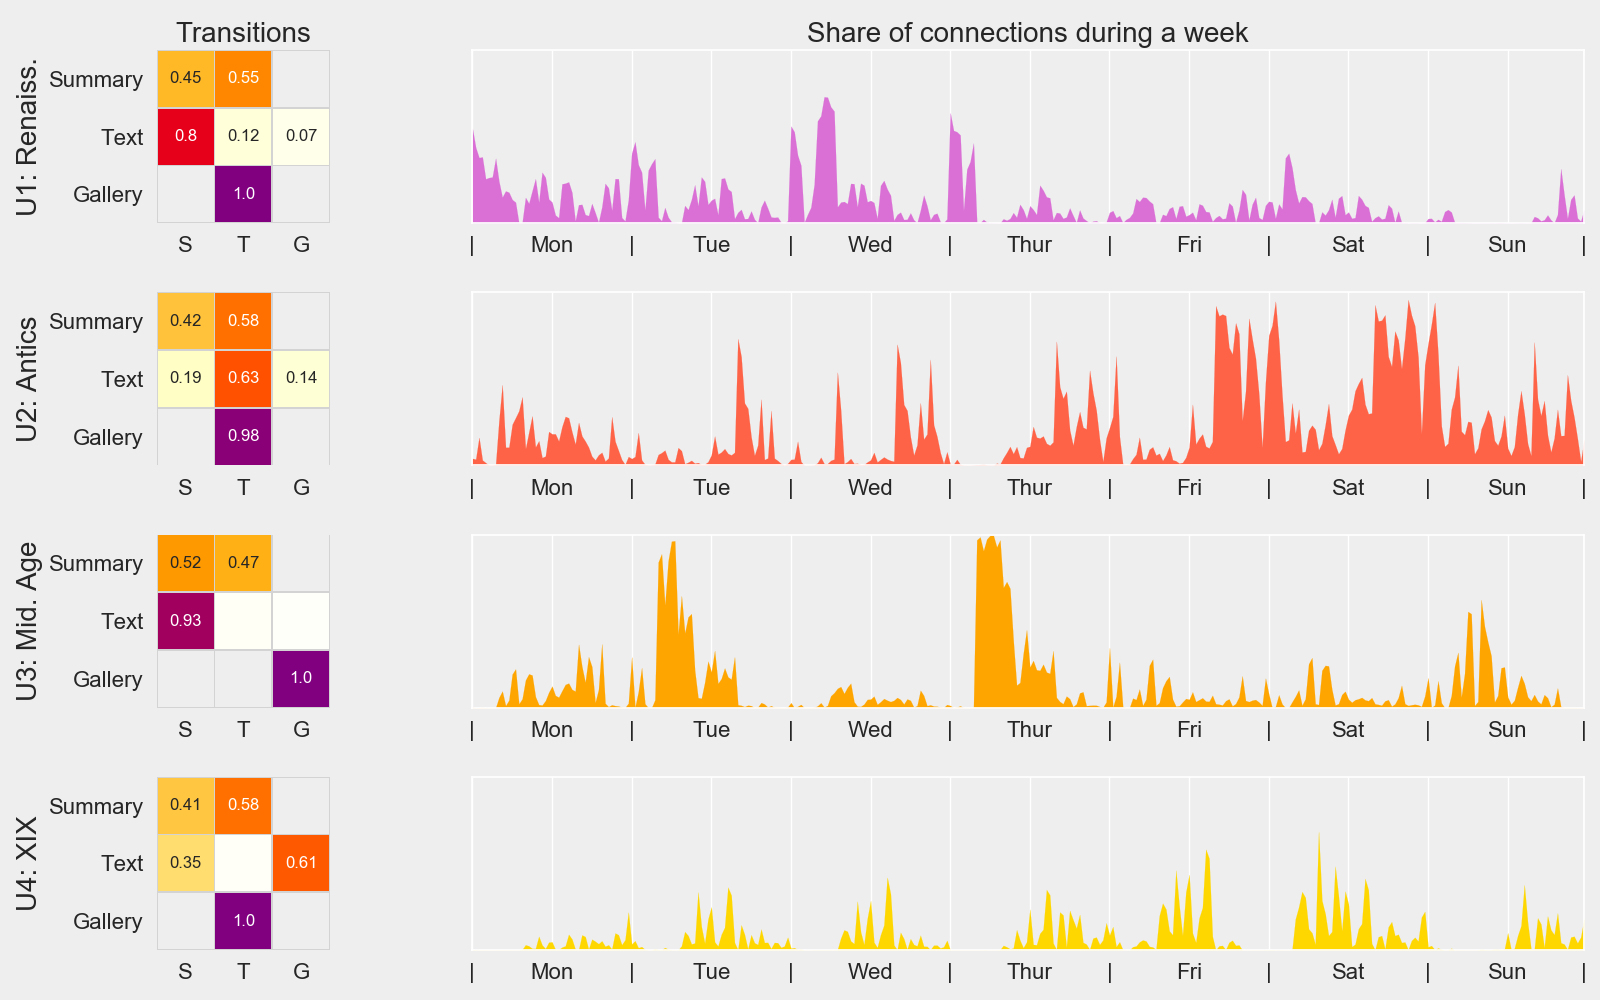
Markov Chains and Periodic Behaviors
Do the pupils use the mBook the same way over the week?
k-means
Nested Mixture of Markov Chains
Influence of
the class or teacher

Time follows a GMM with fixed μ and Σ:
48 daily compo ⇔ 30min
42 weekly compo ⇔ 4h
Truly periodic
Page view conditioned
on the chapter
User model averages
the session model
\text{connection time } t \sim \mathrm{Cat}(\phi^w)+ \mathrm{Cat}(\phi^d)
\text{chapter } c \sim \mathrm{MC}(\theta^c)
\text{page } x|c \sim \mathrm{MC}(\theta^x)
Bayesian Markov Chains and Scrolling Behaviors
One weakness of MMC is the model selection.
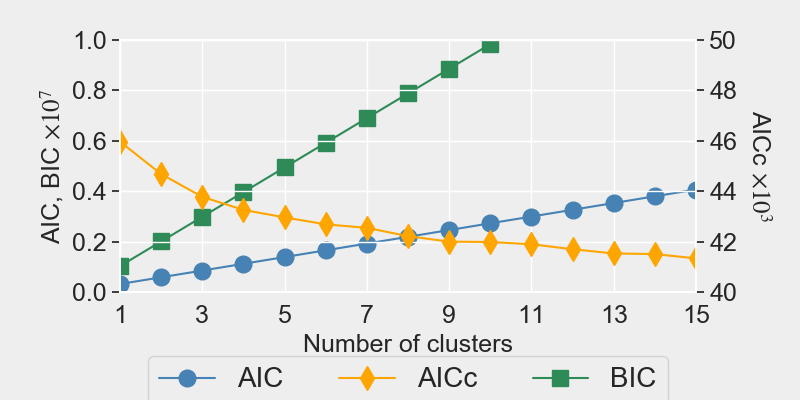
1 \ll K
Dirichlet Processes govern
the number of mixtures and of events.
Infinite Mixture of Markov Chains (iMMC)
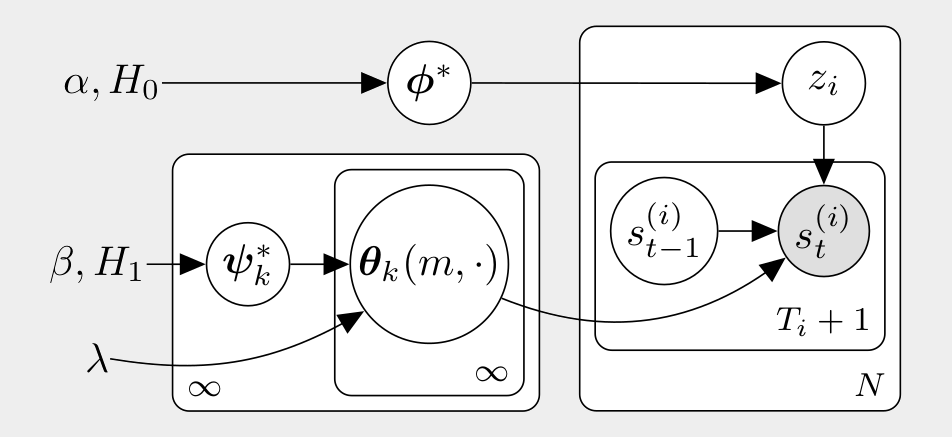
In Practice
Degree k-weak approximations instead of DPs
⇕
Bayesian with
⇓
blocked-Gibbs sampler
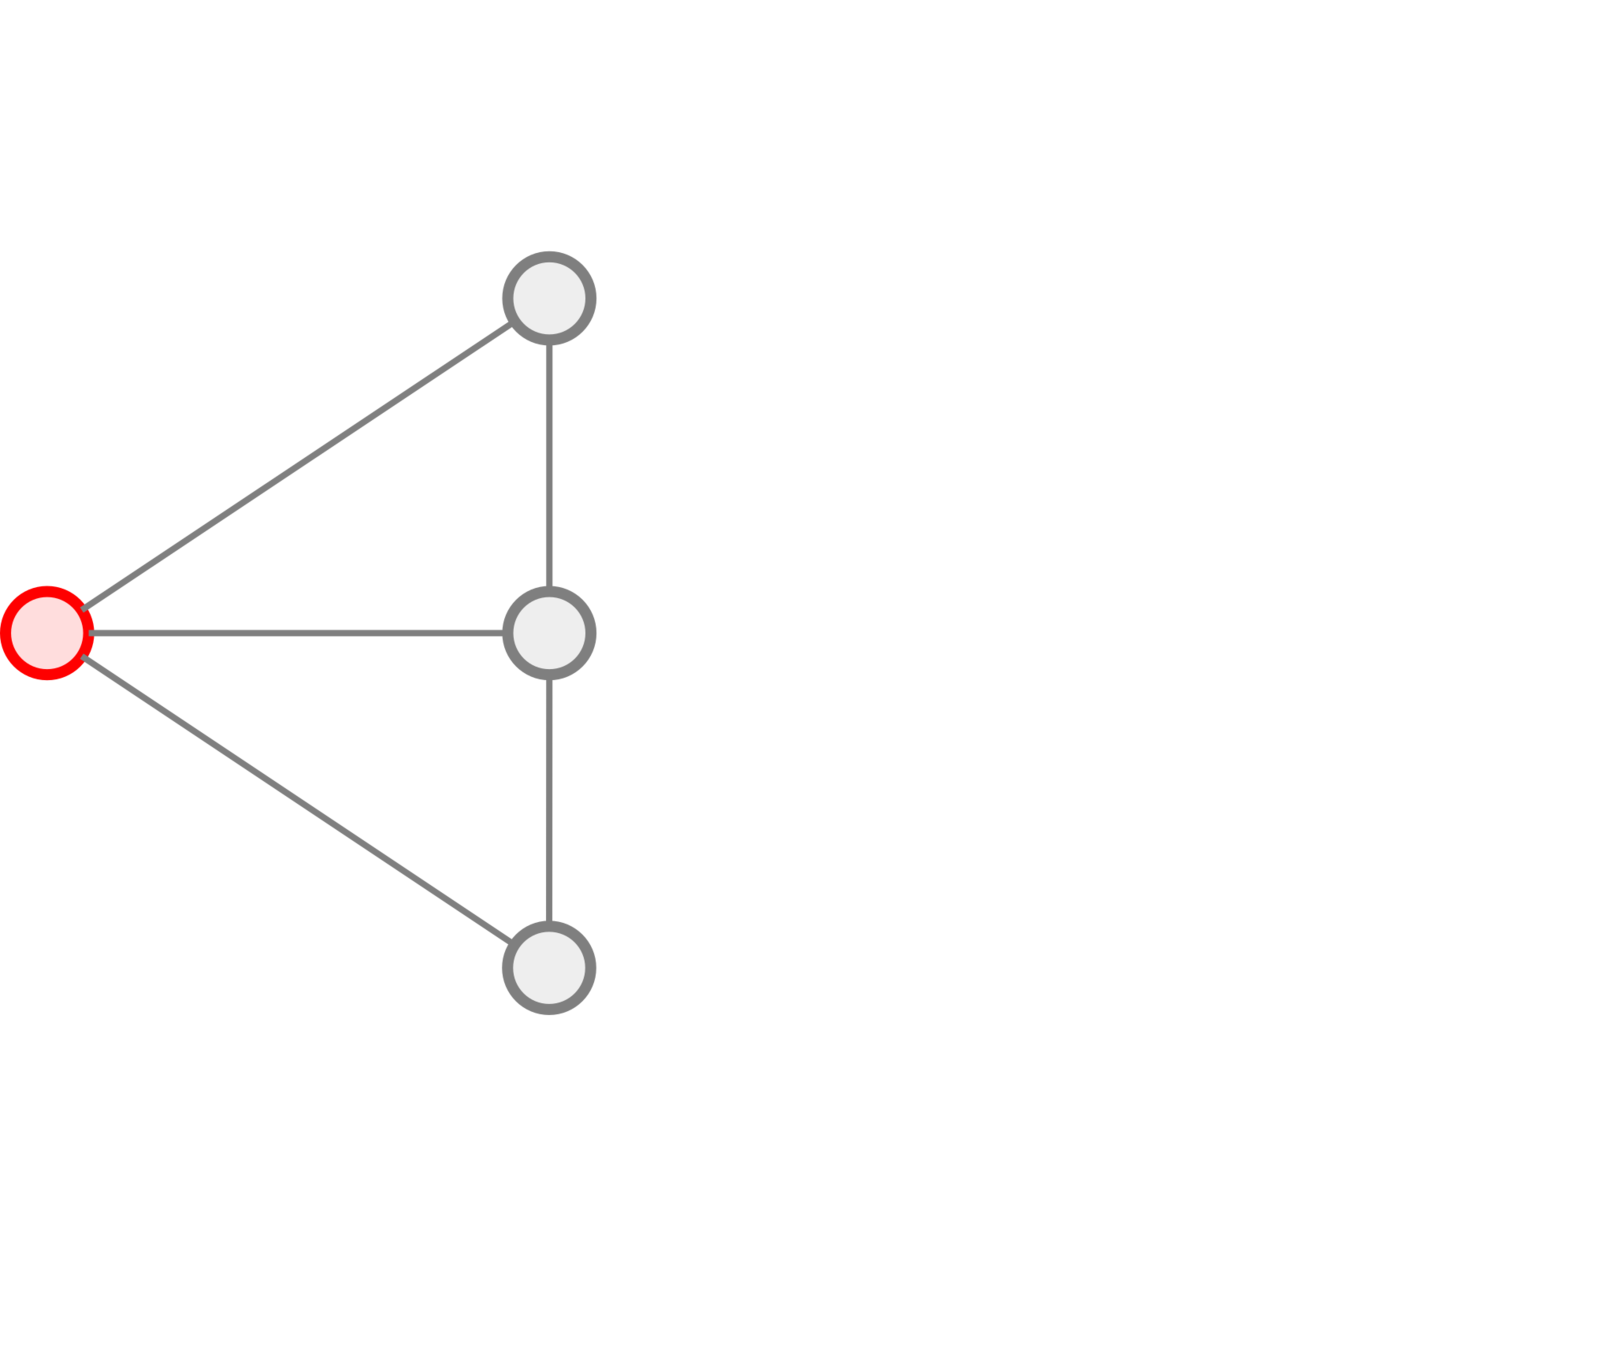
Scrolling Behaviors
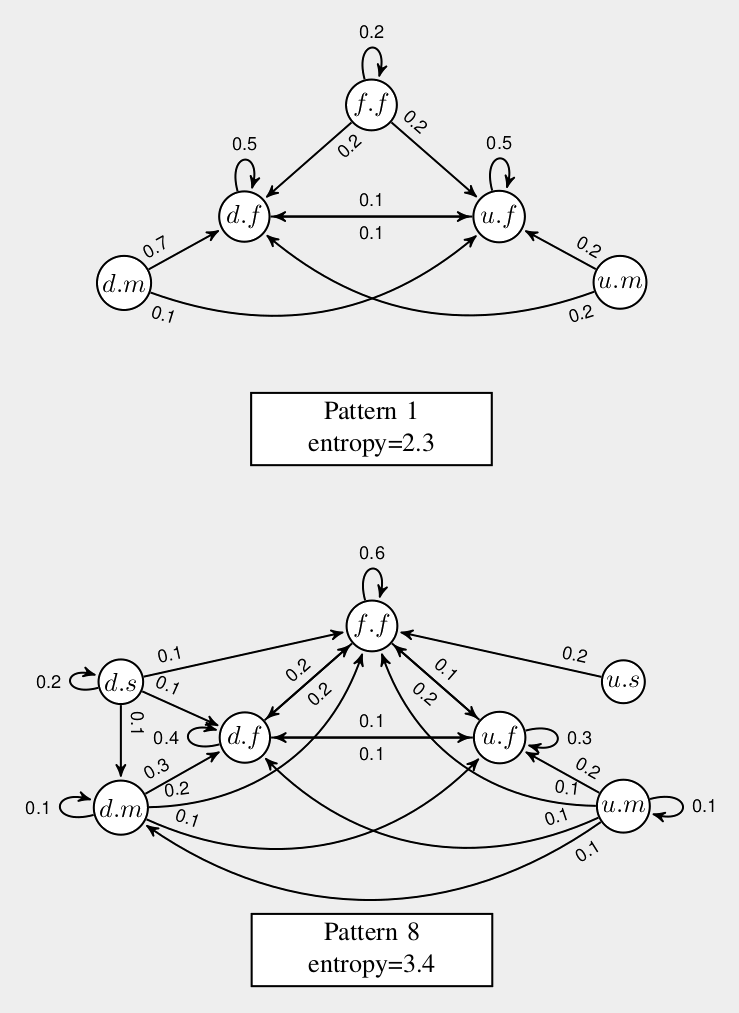
Simple
Pattern
Complex
Pattern
Pupils with higher Knowledge score
have simpler scrolling pattern
Simple
Pattern
Complex
Pattern
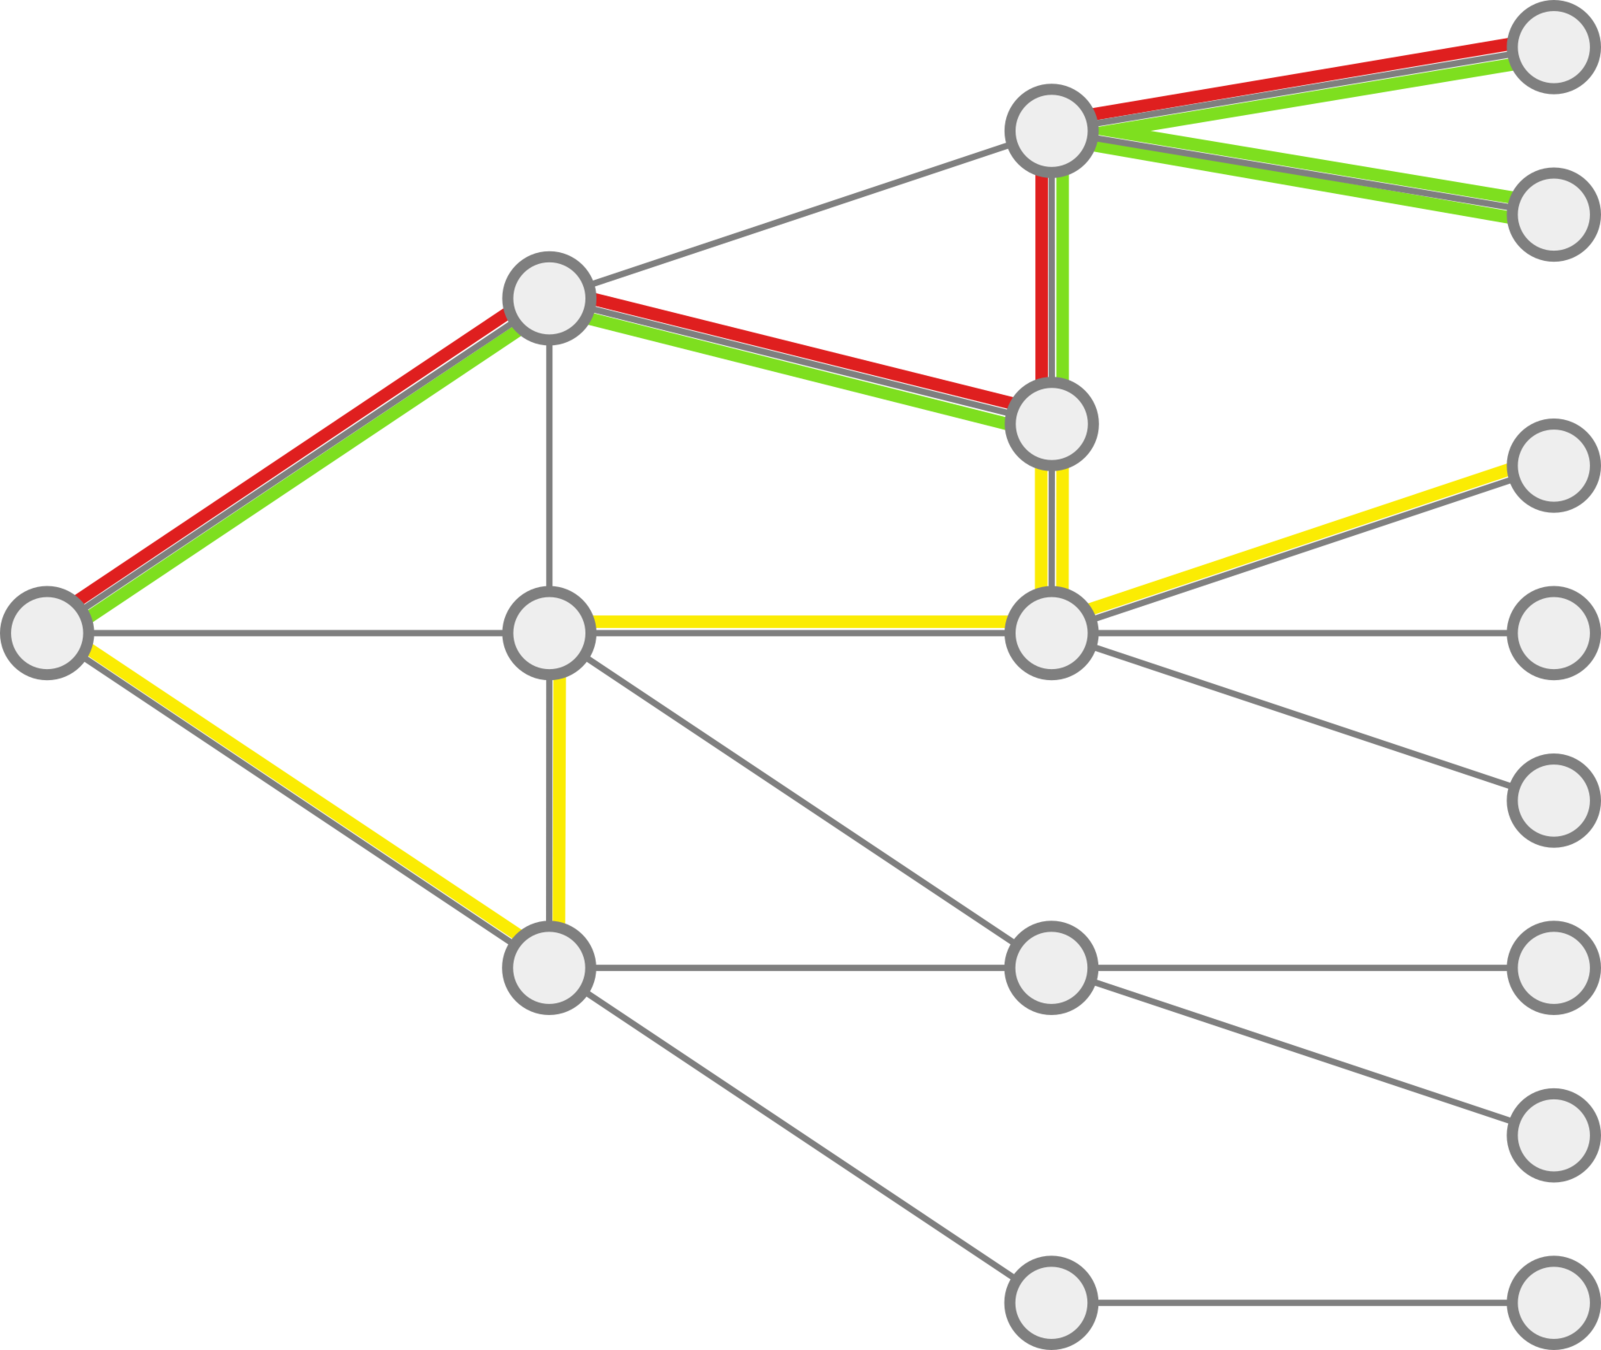
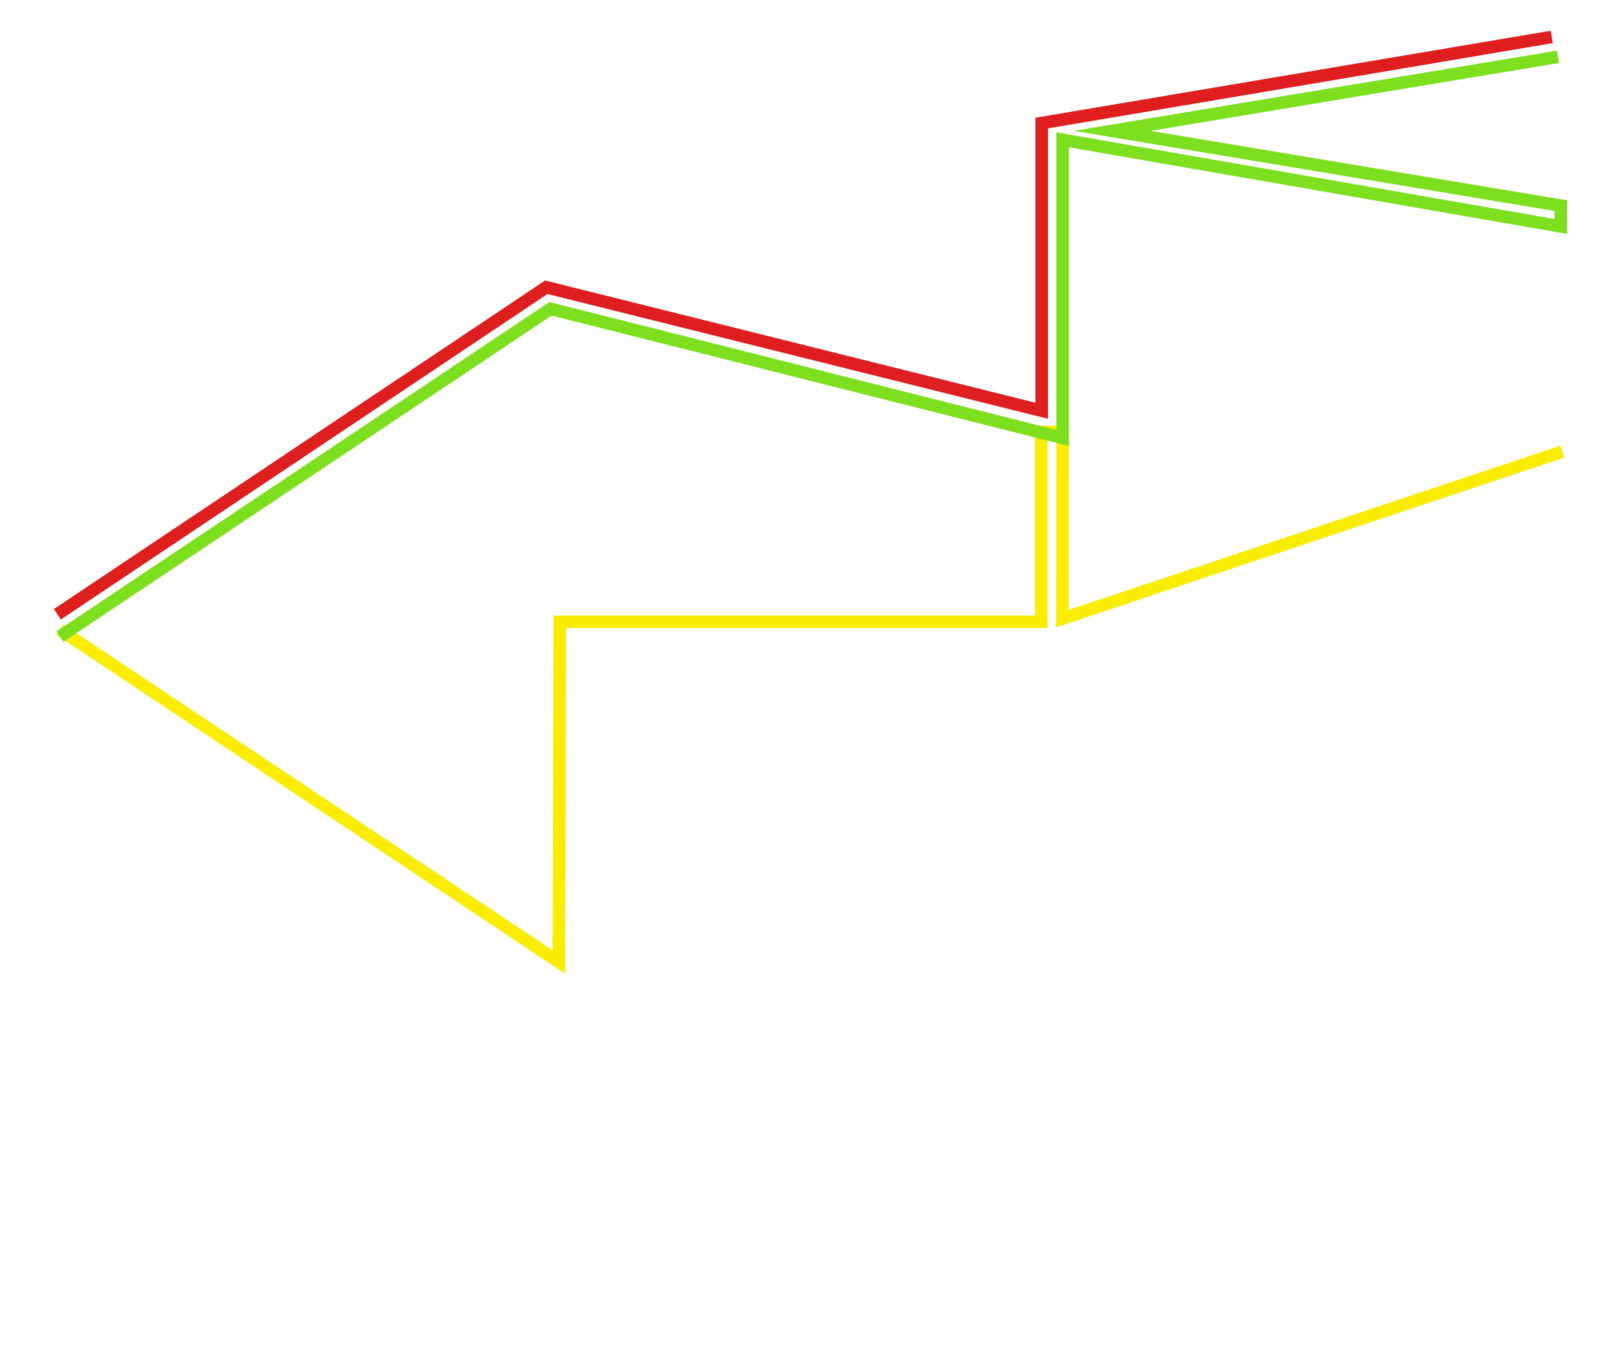
Trajectories and Online Behaviors


Is it relevant to study sessions as
spatio-temporal trajectories?
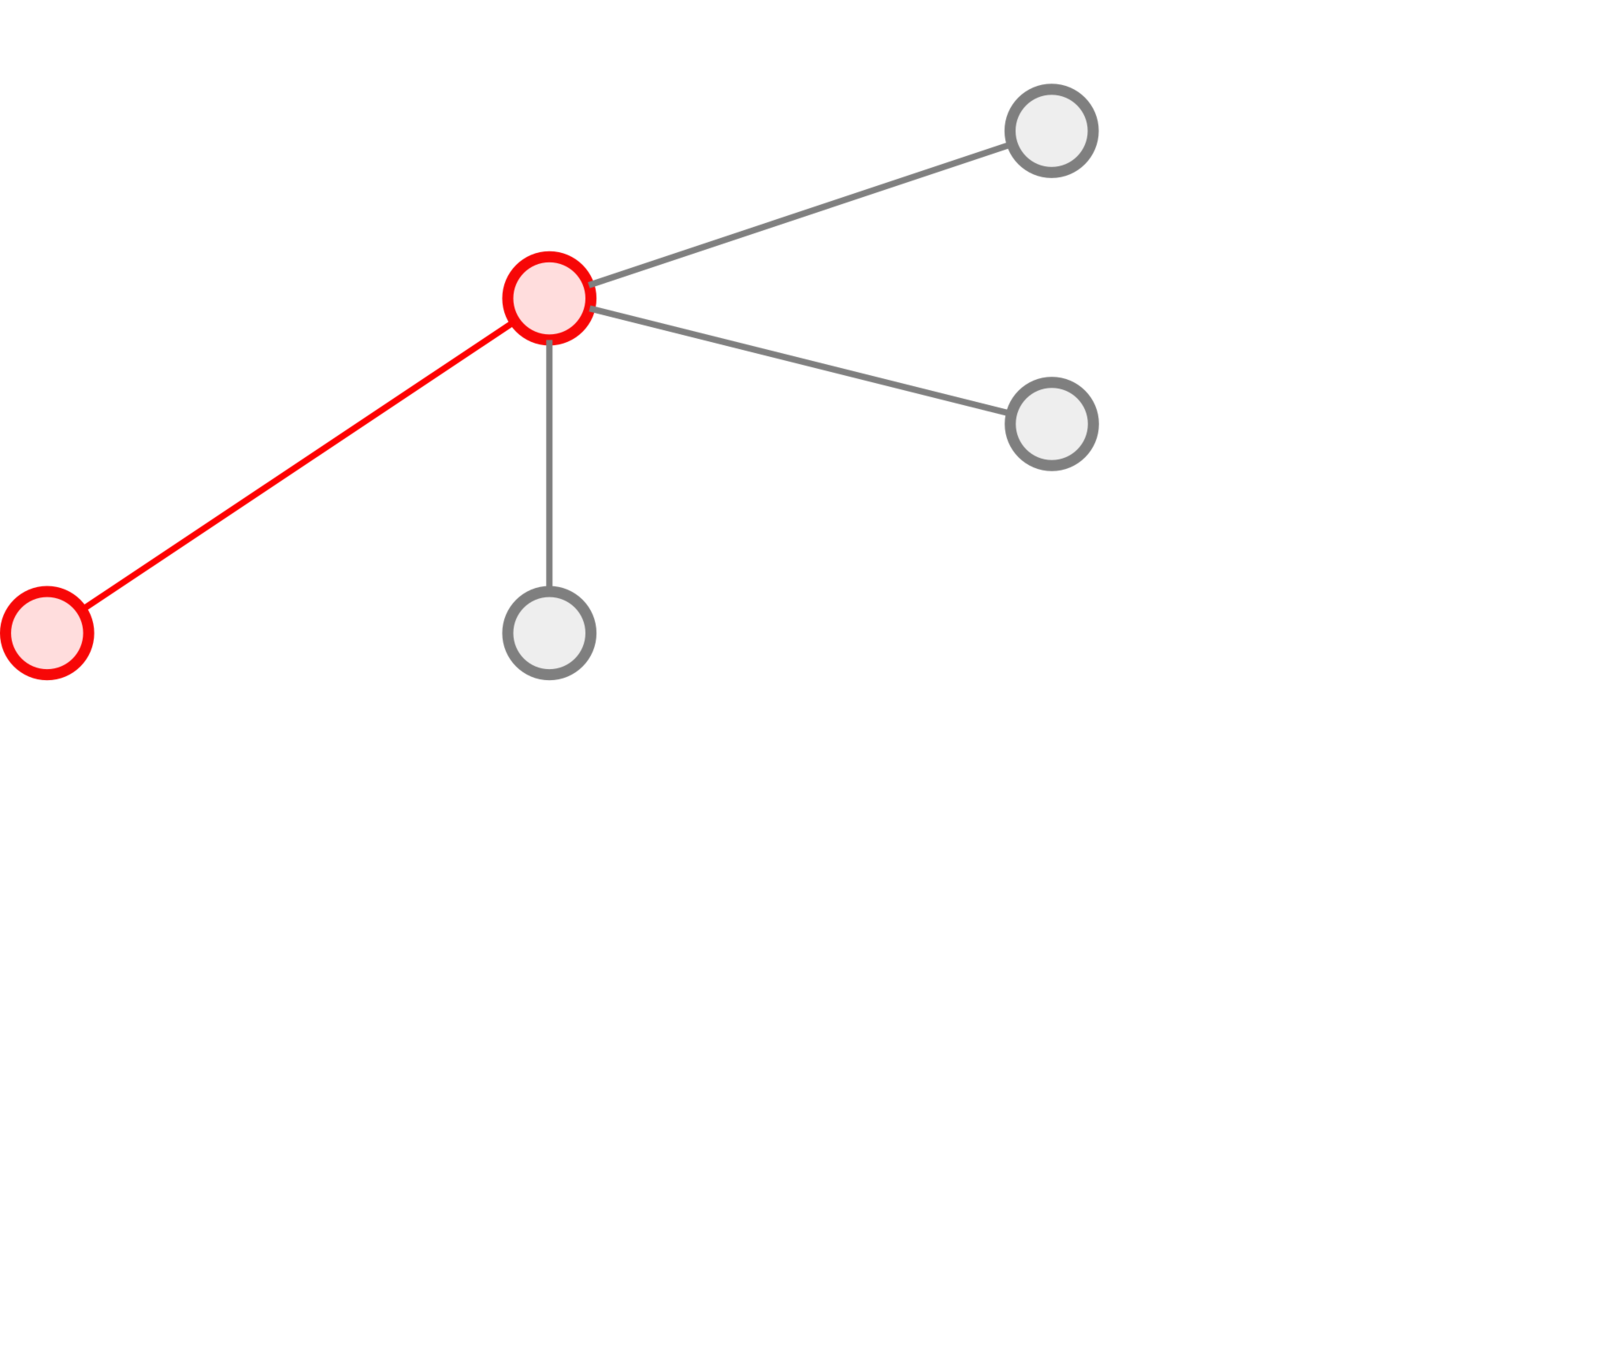
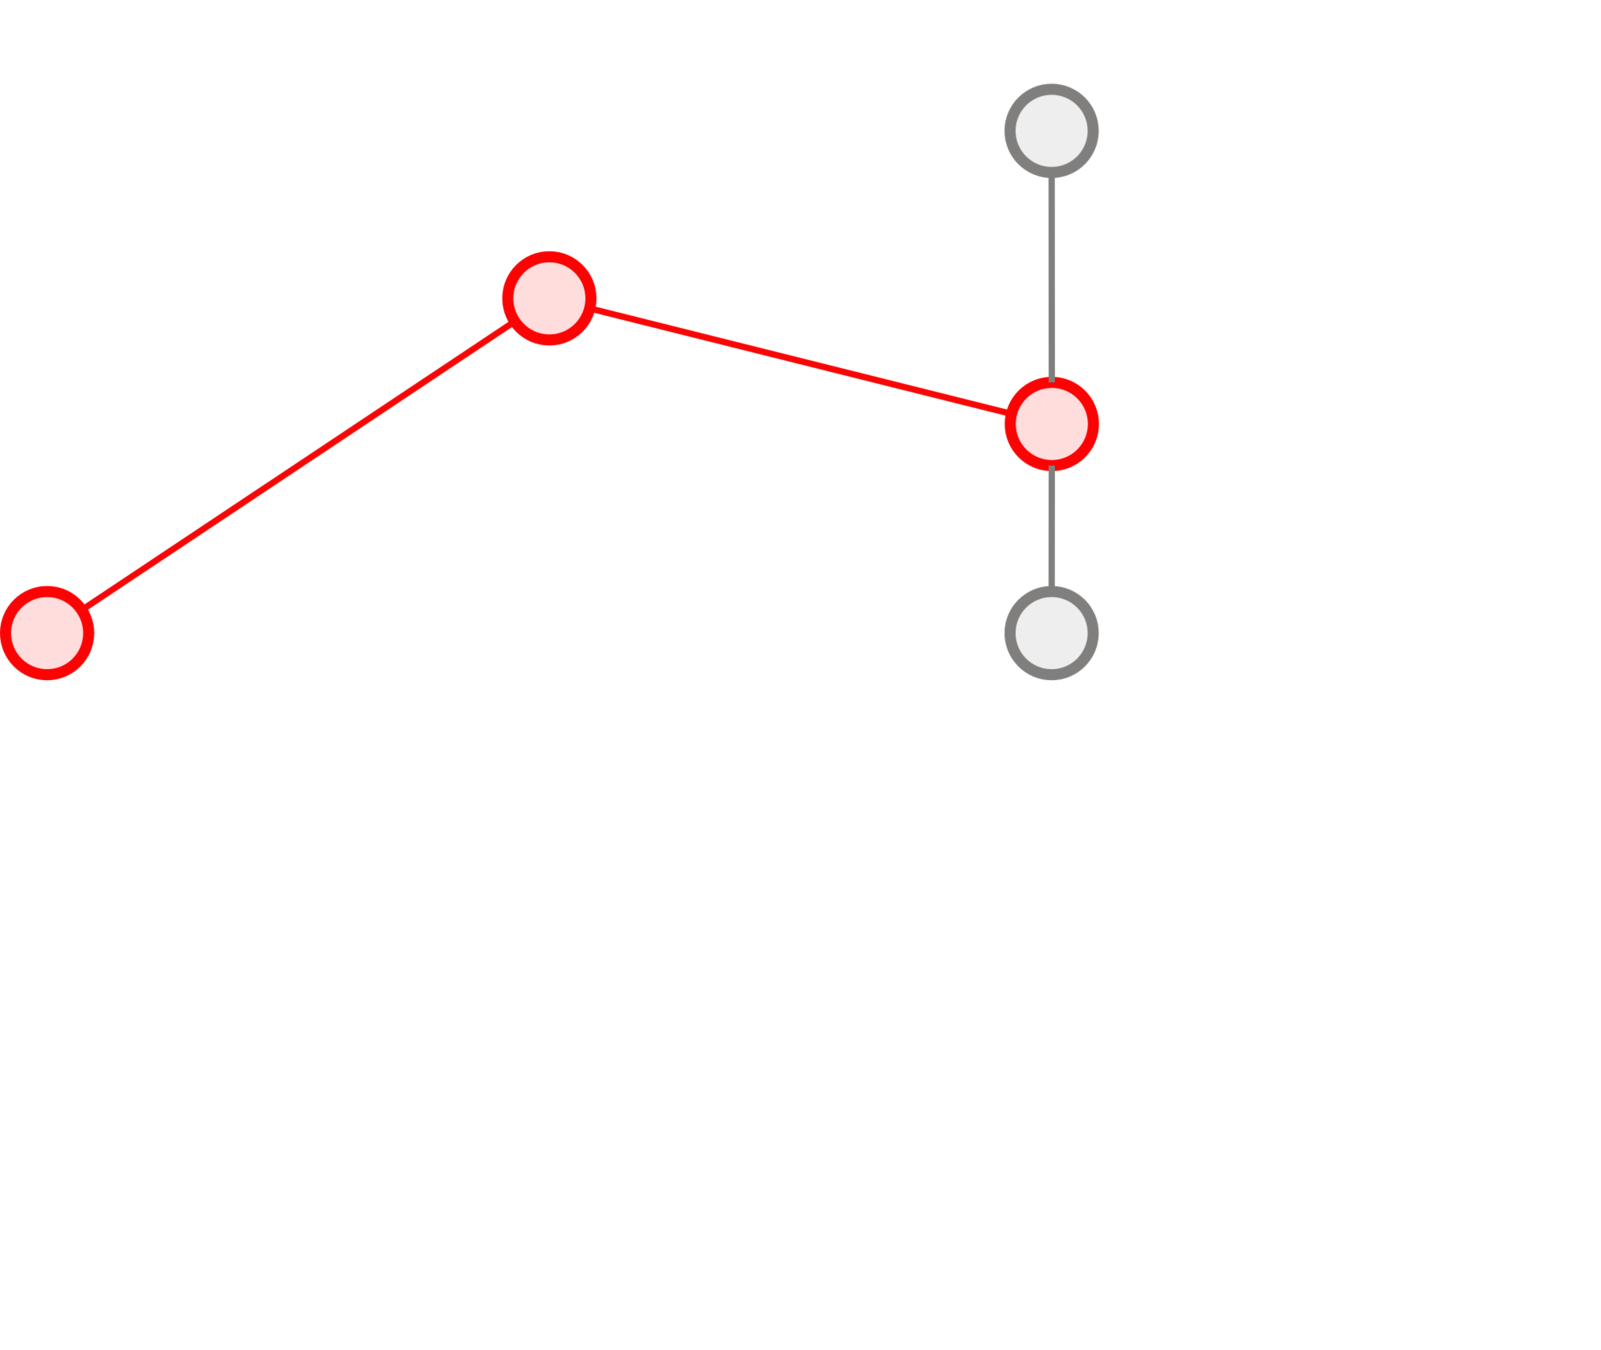
Sequence of pages
↓
Path in the page graph
+
Timestamps
+
Metric on the page graph
↓
Spatio-temporal
trajectory
Construction
Trajectories and Online Behaviors
Extracting Class Groups
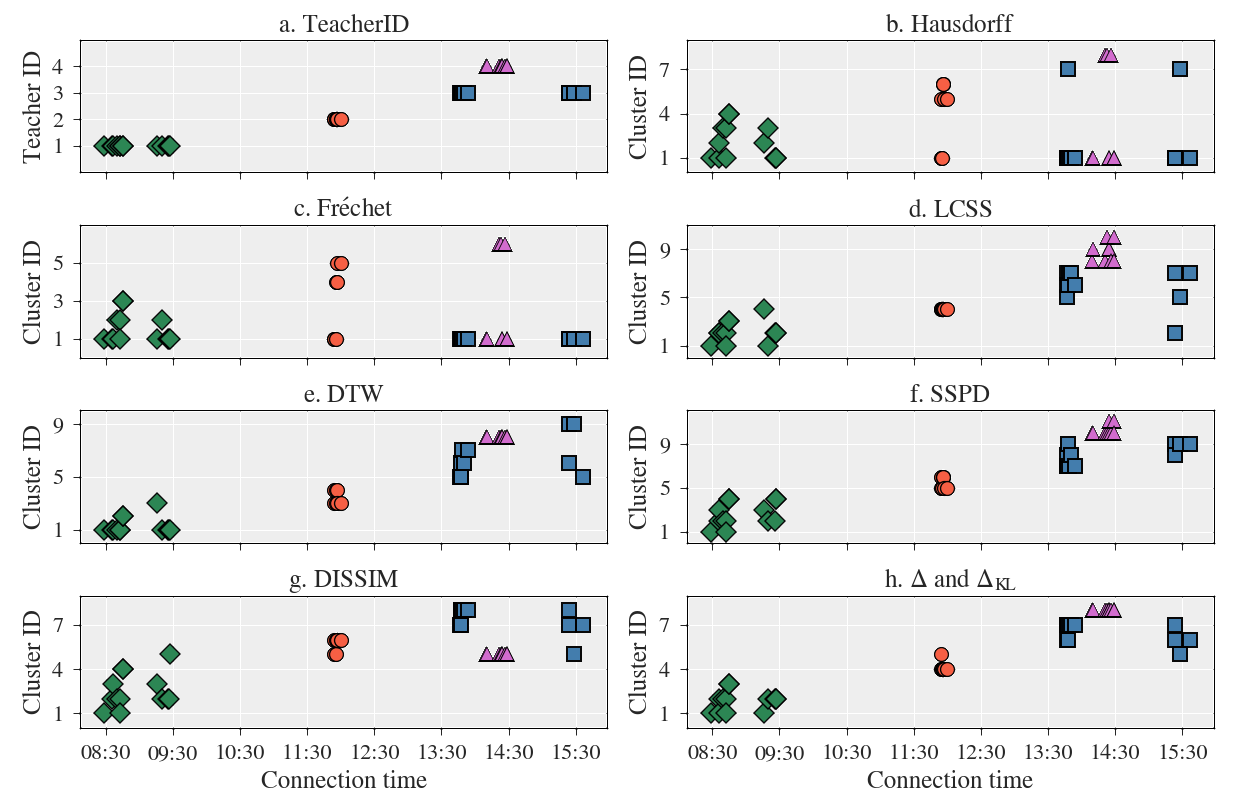
DP-means clusterings for K=20
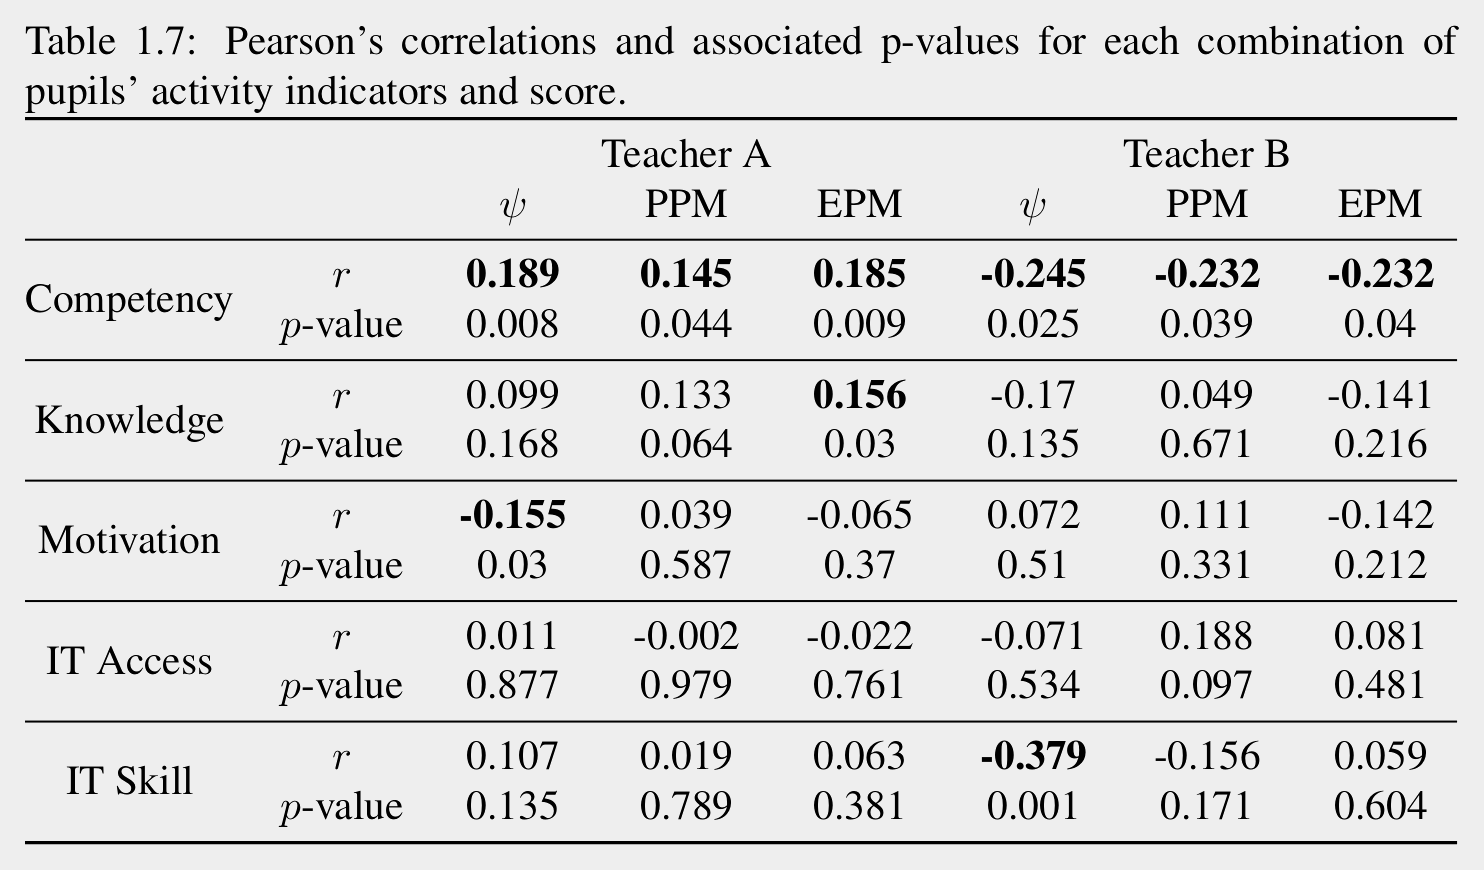
Positive Correlation ↔ High ≈ More freedom
\Psi
Negative Correlation ↔ Low ≈ Less freedom
\Psi
Statistically significant
Activity Indicator
\psi :=
average distance between one pupil
and her classmates
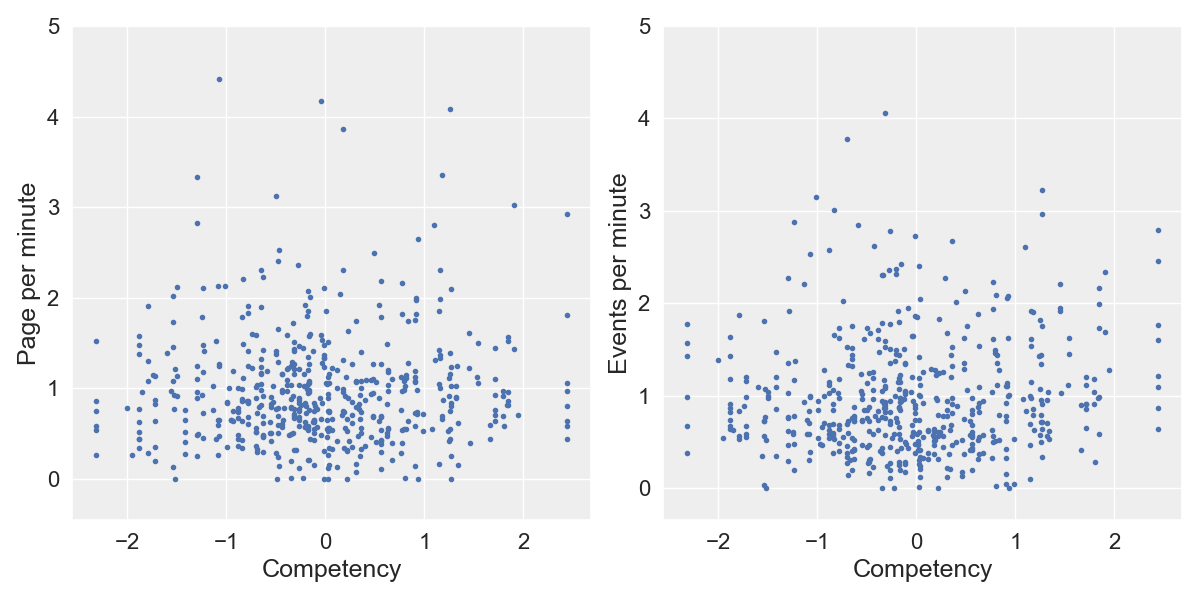
\mathrm{PPM} :=
number of page per minute
\mathrm{EPM} :=
number of event per minute
\text{avg.}\psi

Conclusion
Conclusion
- AA is an alternative to usual factor analysis;
- MC are robust enough to handle fine-grained data;
- Sessions can be represented and processed as
spatio-temporal trajectories;
- Pupils' performance and motivation can be predicted from the data;
- Teachers are moderators in these correlations;
Analysis of User Behavior
Ahcène Boubekki
Leuphana, Lüneburg
UiT, Tromsø
Ed. Science
By ahcene


