Visualizing Content

CRI300 • Week 9

GIFs via Giphy

Project #3

  • Short 2D Motion Graphics Sequence (20%)
  • Due end of Week 9
  • Up to about 5 slots for class critique
  • Format
    • 10 to 15 seconds
    • 1280px by 720px (720p); H.264
      (HD quality, widescreen aspect ratio)
    • Combination of photo-realistic, vector shape, and text elements
    • Must include at least one audio track
  • Must attach a 300-word artist statement

Culminating Project (#4)

  • 30% of your final grade
  • Due end of Week 12 via D2L
  • Up to 20 slots for in-class critique (week 12/13)
  • Free form – Options:
    1. Branded poster campaign (3+ posters)
    2. Web presence (social, blog, website)
    3. 60-seconds of motion graphics
  • Must attach a 300-word artist statement

Week 11/12

  • No lecture, just work periods
  • In-class critiques
  • Quiz #3 (week 11)
  • Ad-hoc work and design sprints
  • Lab space will be open (after hours?)

Life Logging

Life Logging

The process of tracking personal data generated by behavioural ​activities.

  • Exercise, sleeping, eating, etc.
  • Quantitative + Qualitative data

Wearables

Nike+, Fitbit, Jawbone, Apple Watch, Google Glass

  • Social network integration
  • "Lifecaching"

Steve Mann

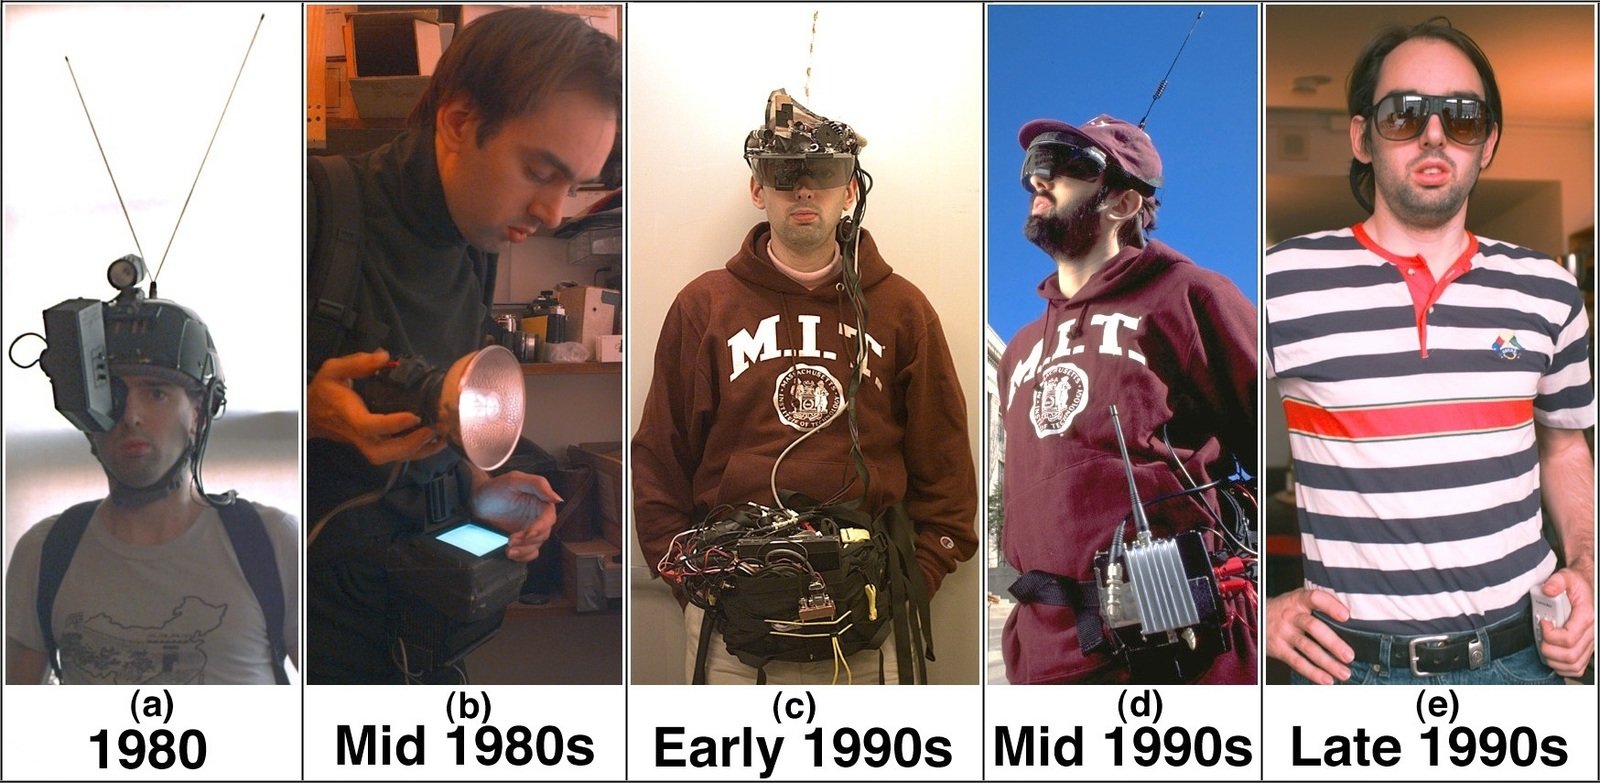
Wearable computer / reality mediator

Quantified Self

Movement to incorporate data acquisition of aspects of a person's daily life.

  • Input: Food & air
  • States: Mood, blood oxygen levels
  • Performance: Mental & physical

MyLifeBits

  • Gordon Bell & Microsoft
  • Collect a lifetime of data and store it
  • Digitizing Bell's physical mementos & documents

Personal Annual Reports

  • Nicholas Felton, New York
  • Infographic Designer
  • Daytum.com
  • Designer of the Facebook Timeline

Infographics

Infographic

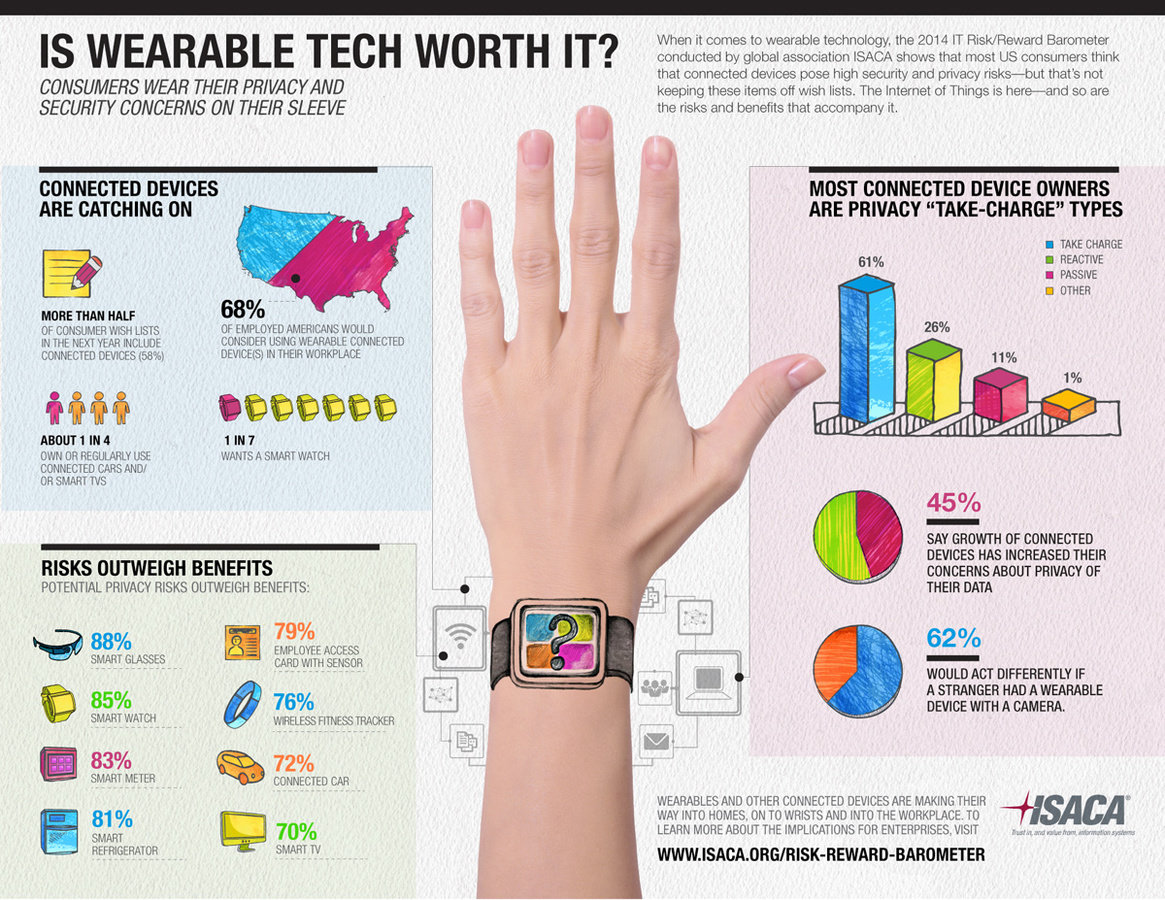
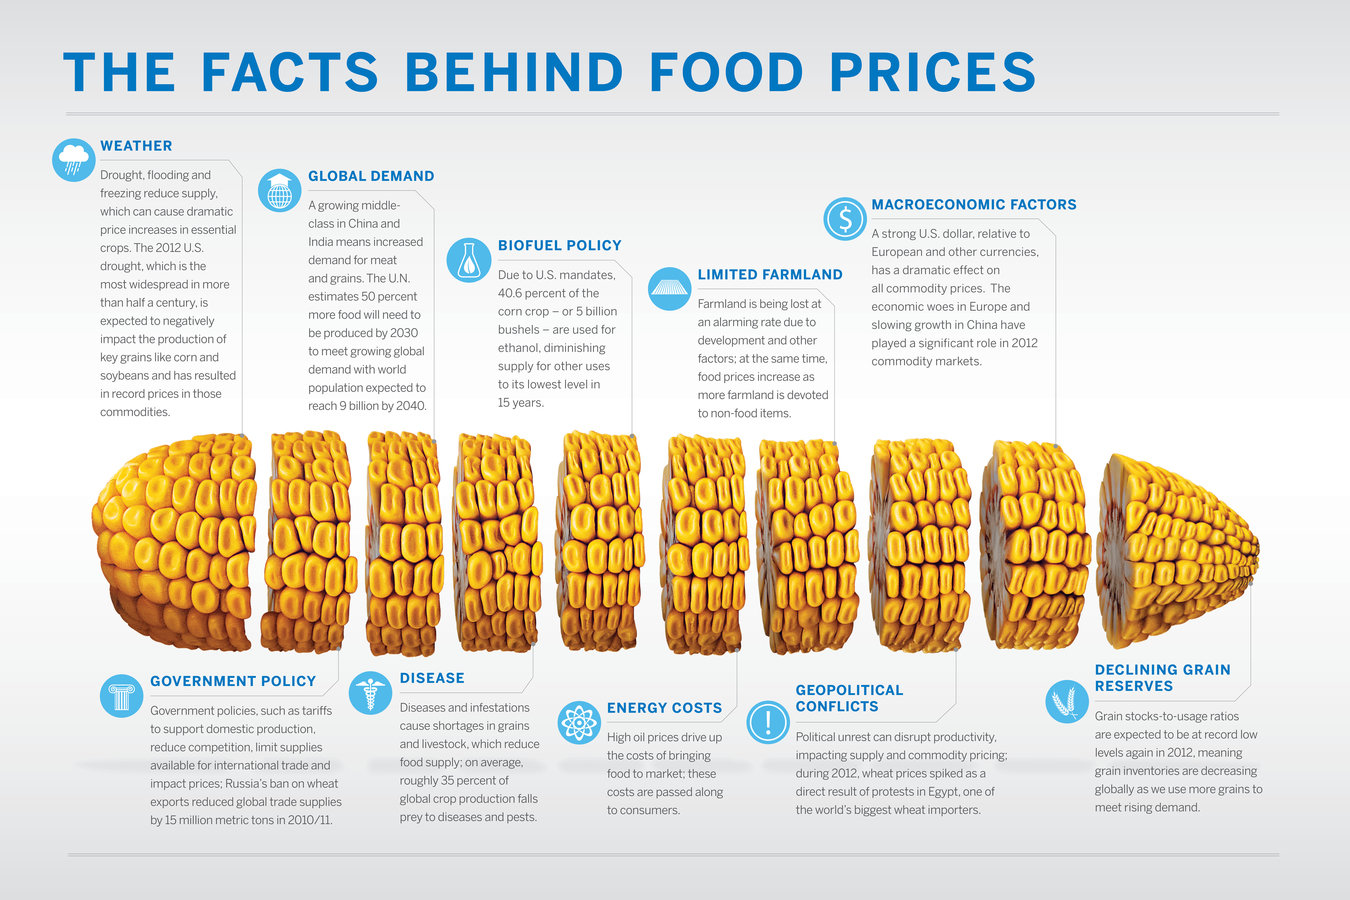
Visual representations of information, data, or knowledge

  • Data → Information → Knowledge → Wisdom
  • Raw → Meaningful → Insightful → Actionable
  • Efficient in communicating trends & meaning
  • Can be static, animated, or dynamic
  • Goes beyond pie charts and graphs

David McCandless

  • InformationIsBeautiful.net
  • Data Journalist
  • Curate, filter, understand, visualize
  • Storytelling through data
  • Solves information problems

Nontraditional CV

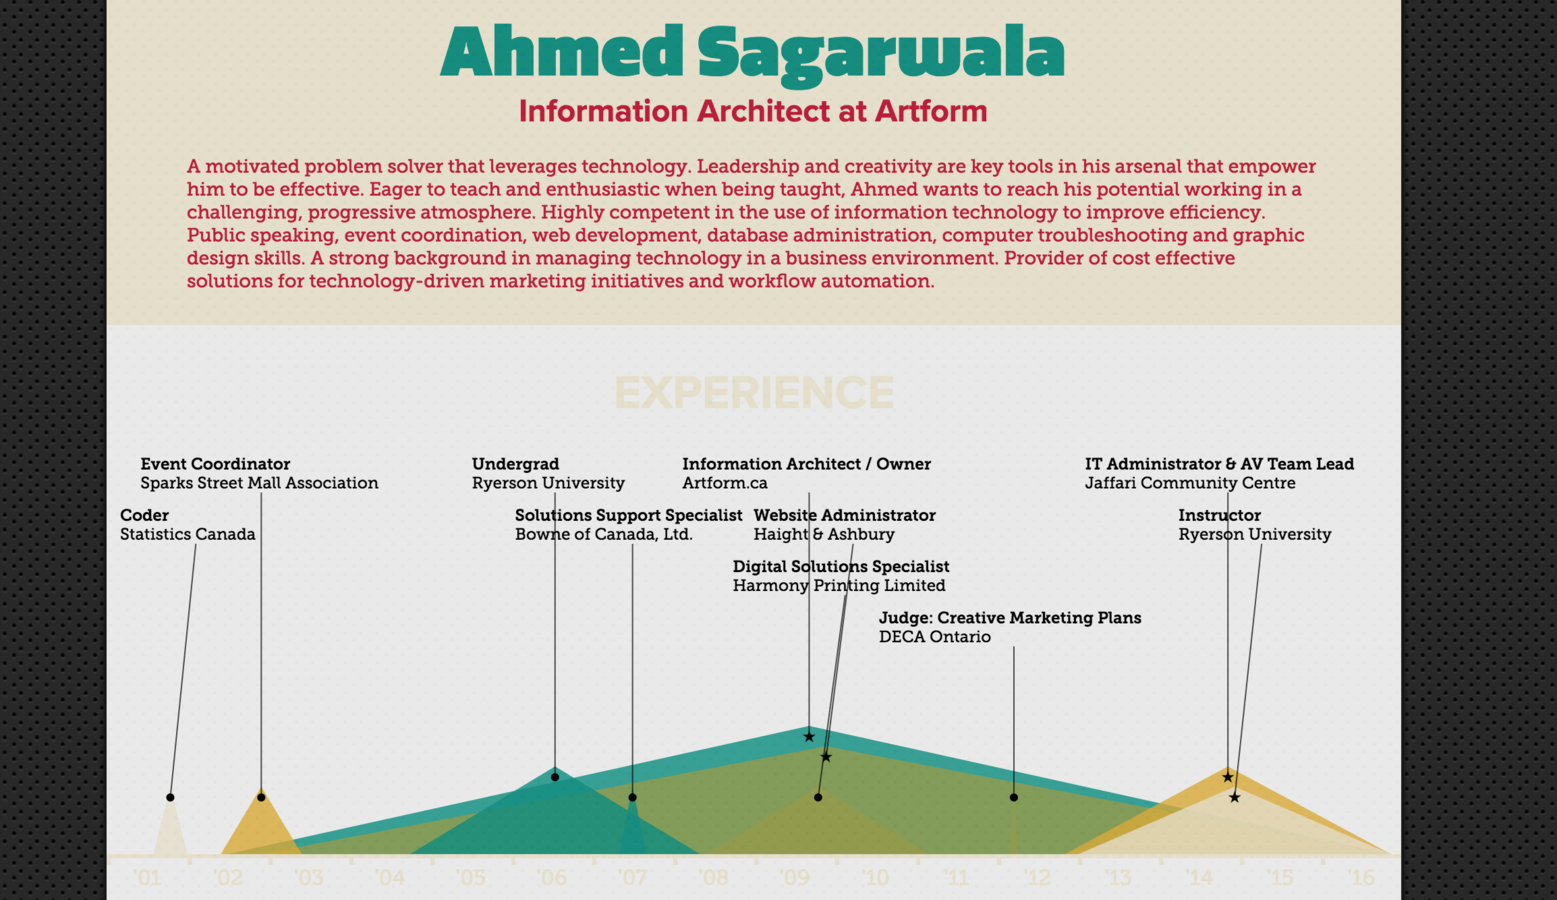
A resumé that includes more than a list of your employment/academic history

  • Focus on visual impact & differentiation
  • Medium, typography, video, imagery
  • The medium is the message
  • Use of infographics – data visualized
  • Not appropriate for traditional industries

CV Visualization Tools

  1. Vizualize.me
  2. Vizify (acquired by Yahoo)
  3. Re.vu (shutting down)
  4. About.me / Flavors.me
  5. Behance.net
  6. LinkedIn

CV Tips

  • Track it using short links
  • Digitize it
  • Landscape?
  • Typographic considerations
  • Minimal makes it content-first
  • Demo reel (video of portfolio)
  • Website

Design Sprint

Part 1

The Challenge

Create a infographic related to Ryerson

Inputs

Overall topic / hypothesis

Statistics to support

Metaphors

CRI300 - Week 9

By Am Sagarwala

CRI300 - Week 9

Lifelogging, Data Visualization, Quantified Self, Emerging Tech

  • 1,061