
Visualización de Redes Geoespaciales con
Dash Sylvereye
Dr. Alberto García Robledo
CentroGeo Querétaro
Semana de las Ciencias de Información Geoespacial

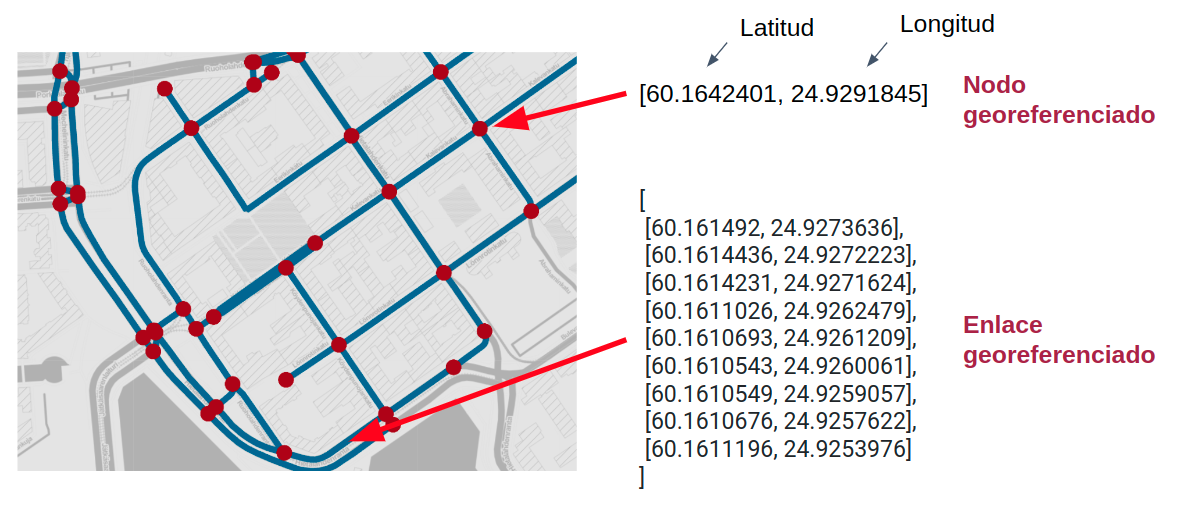
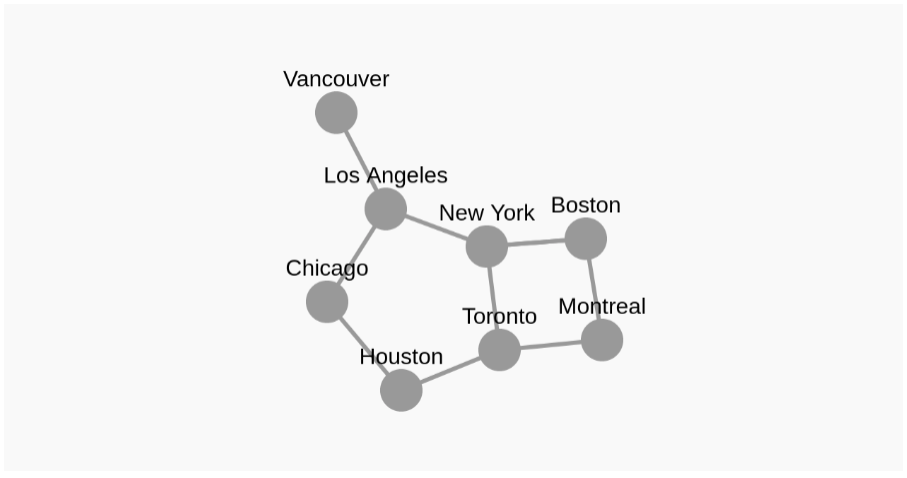
¿Qué es una red geoespacial?
¿Qué es Dash?
¿Qué es Dash?
-
Dash es código abierto, publicado bajo la licencia MIT.
-
Está disponible para múltiples lenguajes:
-
Python
-
R
-
Julia
-
.NET
-

Componentes Dash de terceros
-
Dash provee herramientas para que puedas desarrollar tus propios componentes
-
Básicamente, un componente Dash no es más que un envoltorio de un componente React.js
-
Dash goza de una nutrida comunidad de desarrolladores que han creado sus propios componentes Dash
Dash Cytoscape
-
Sin soporte de dibujo de poli-líneas para los enlaces
-
Sin soporte de coordenadas geográficas
-
Sin soporte de mapas web
-
Sin aceleración por GPU
Estado del Arte
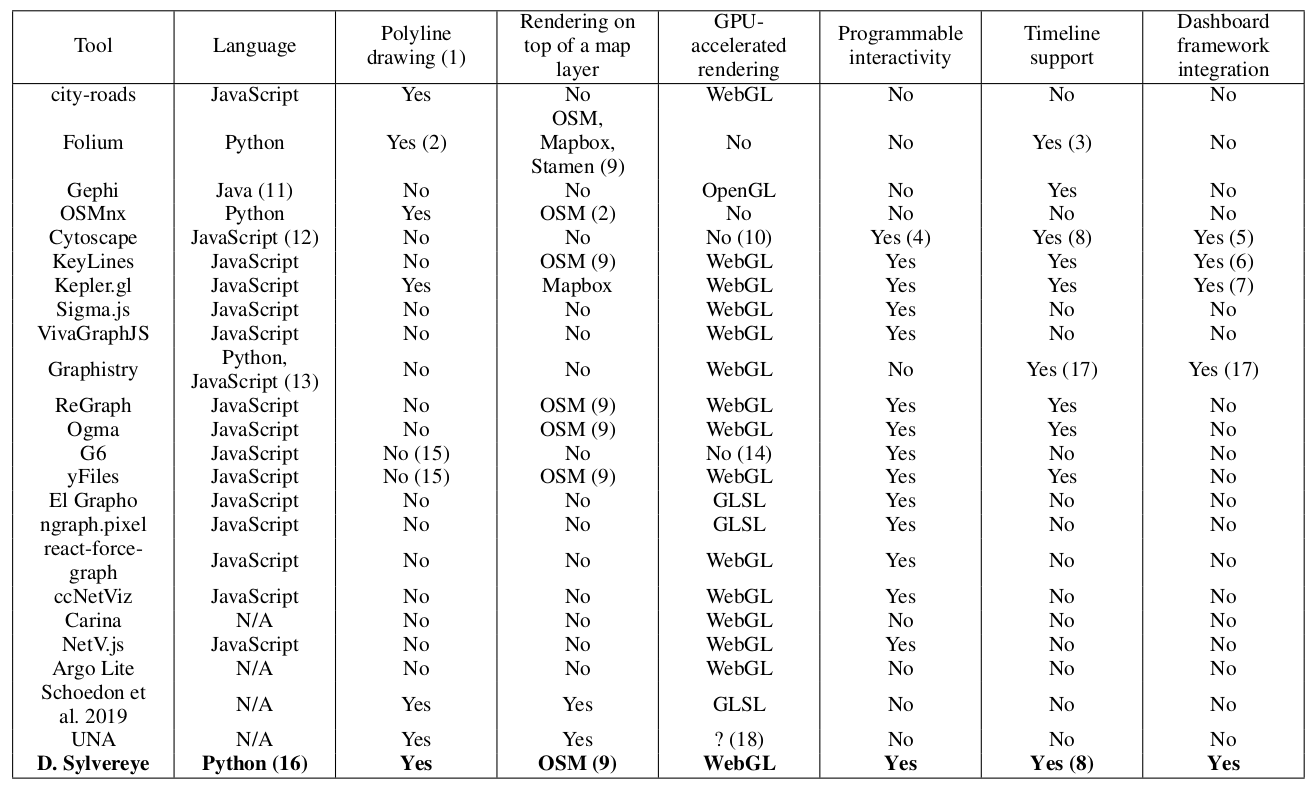
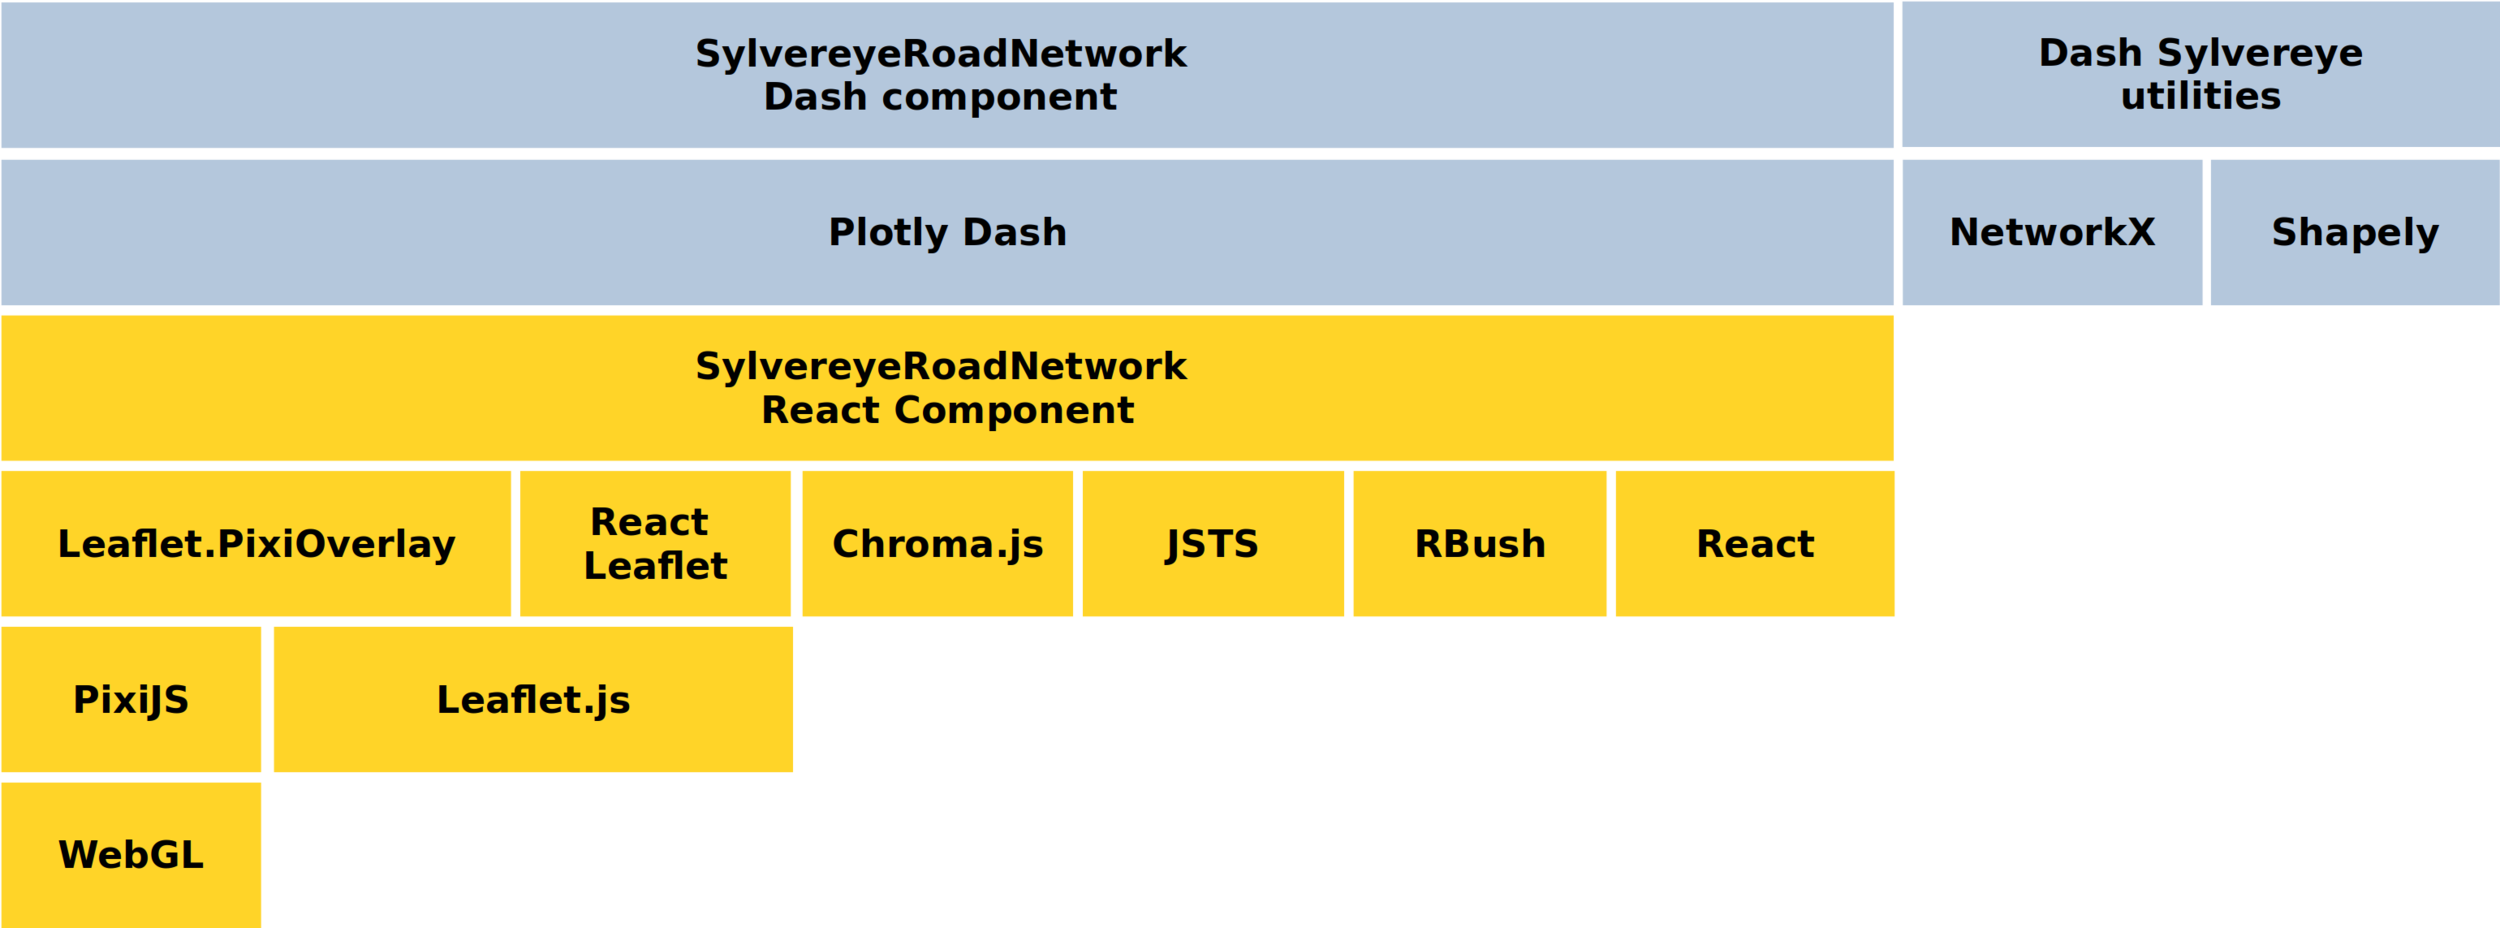
Dash Sylvereye
-
Biblioteca Dash desarrollada en CentroGeo.
-
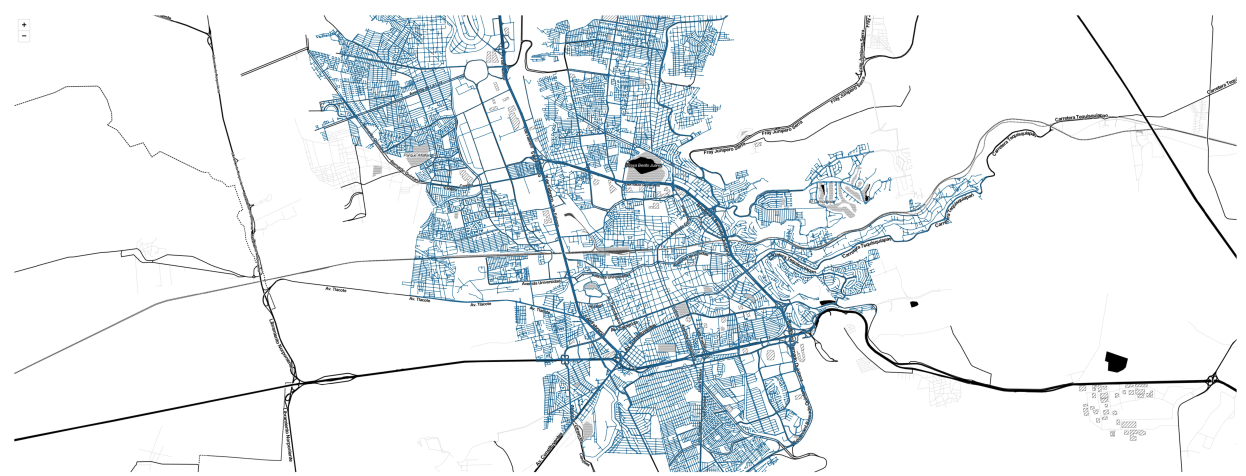
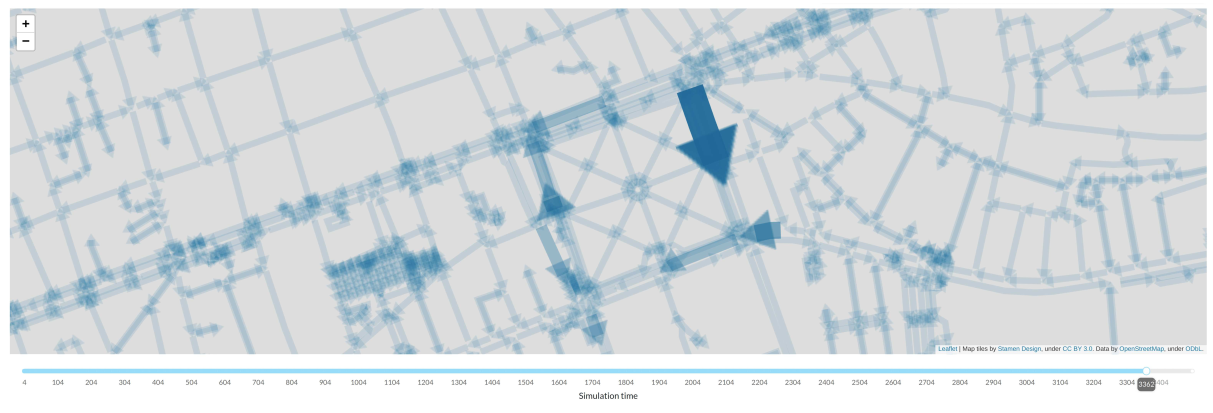
Permite la visualización de redes de caminos grandes utilizando WebGL.
-
Las visualizaciones son altamente personalizables.
-
Eventos de click para nodos y enlaces de la red.

Incrustación en un tablero Dash
-
Dash Sylvereye permite incrustar la visualización de una red de caminos en tu tablero Dash
-
La topología de una red de caminos puede ser obtenida desde OSM a través de la biblioteca OSMnx
-
Dash Sylvereye permite la configuración de la capa de mapa web sobre la que se dibuja la red de caminos
Ejemplo 1: Visualización de una red de caminos
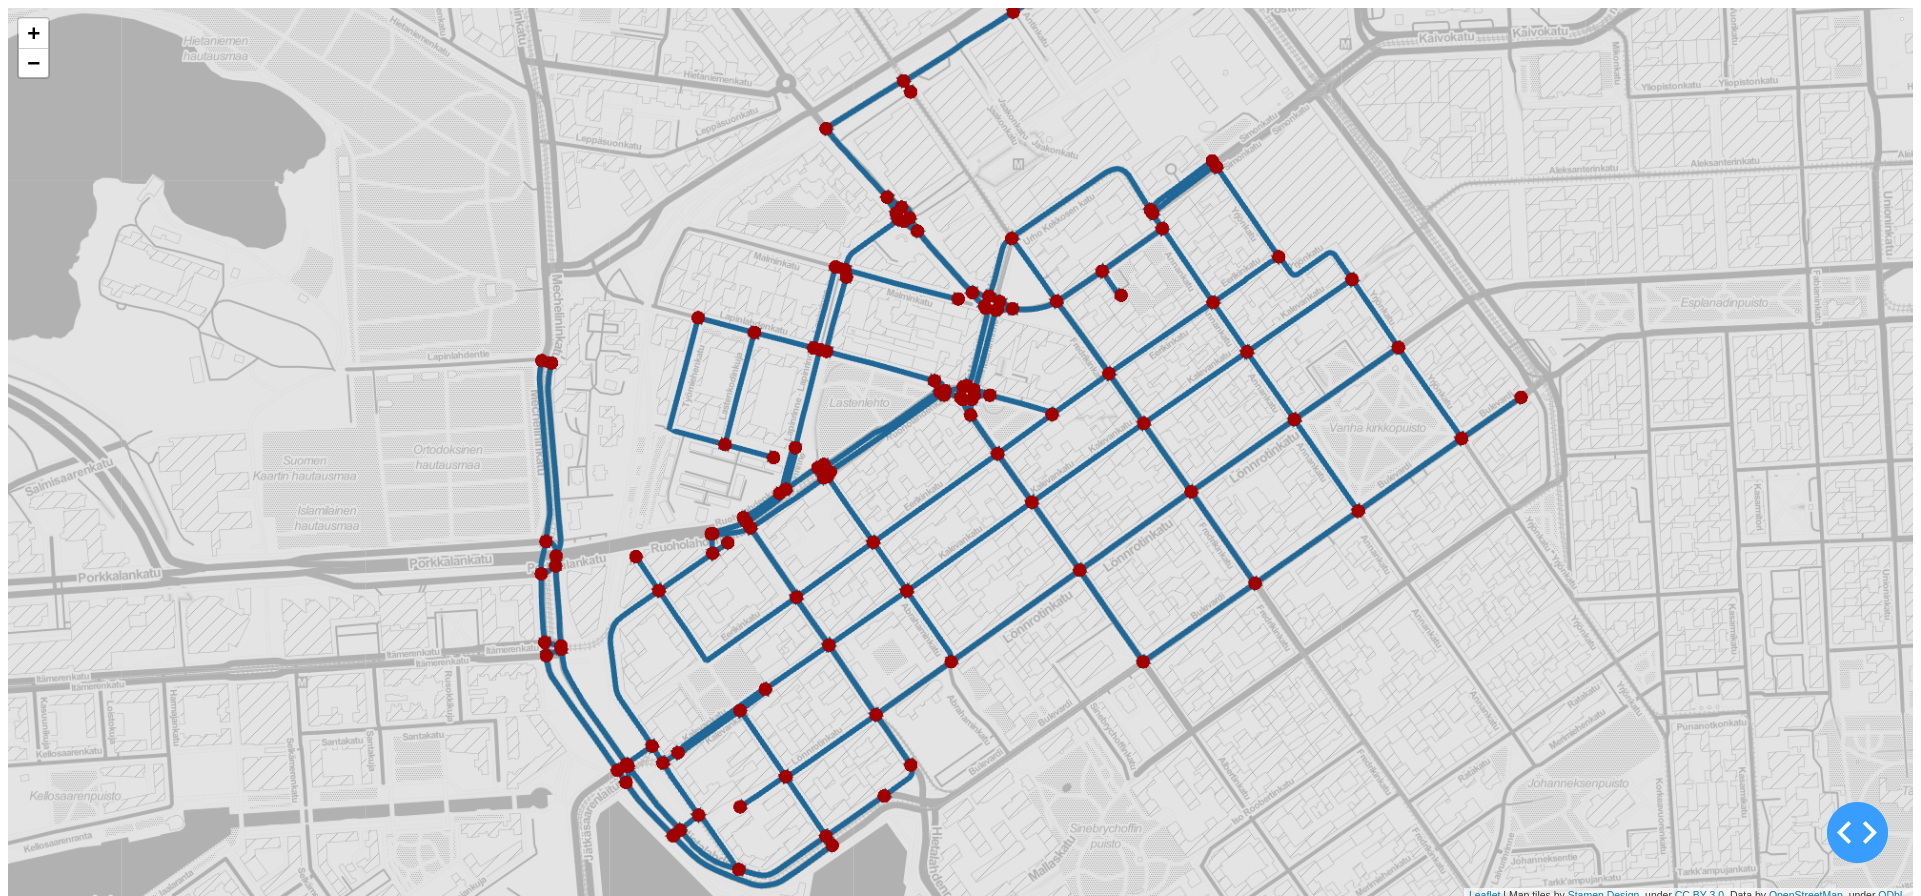
Ejemplo 1: Visualización de una red de caminos
import osmnx as ox
from dash import Dash
from dash_html_components import Div
from dash_sylvereye import SylvereyeRoadNetwork
from dash_sylvereye.utils import load_from_osmnx_graph
# configuración de la visualización
OSMNX_QUERY = 'Kamppi, Helsinki, Finland'
TILE_LAYER_URL = '//stamen-tiles-{s}.a.ssl.fastly.net/toner/{z}/{x}/{y}.png'
TILE_LAYER_SUBDOMAINS = 'abcd'
TILE_LAYER_ATTRIBUTION = 'Map tiles by <a href="http://stamen.com">Stamen Design</a>, under <a href="http://creativecommons.org/licenses/by/3.0">CC BY 3.0</a>. Data by <a href="http://openstreetmap.org">OpenStreetMap</a>, under <a href="http://www.openstreetmap.org/copyright">ODbL</a>.'
MAP_CENTER = [60.1663, 24.9313]
MAP_ZOOM = 15
MAP_STYLE = {'width': '100%', 'height': '98vh'}
# obtener la topología de la red desde OSM
road_network = ox.graph_from_place(OSMNX_QUERY, network_type='drive')
nodes_data, edges_data = load_from_osmnx_graph(road_network)
# construir visualización
app = Dash()
app.layout = Div([
SylvereyeRoadNetwork(
id='sylvereye-roadnet',
tile_layer_url=TILE_LAYER_URL,
tile_layer_subdomains=TILE_LAYER_SUBDOMAINS,
tile_layer_attribution=TILE_LAYER_ATTRIBUTION,
map_center=MAP_CENTER,
map_zoom=MAP_ZOOM,
map_style=MAP_STYLE,
nodes_data=nodes_data,
edges_data=edges_data
)
])
# correr visualización
if __name__ == '__main__':
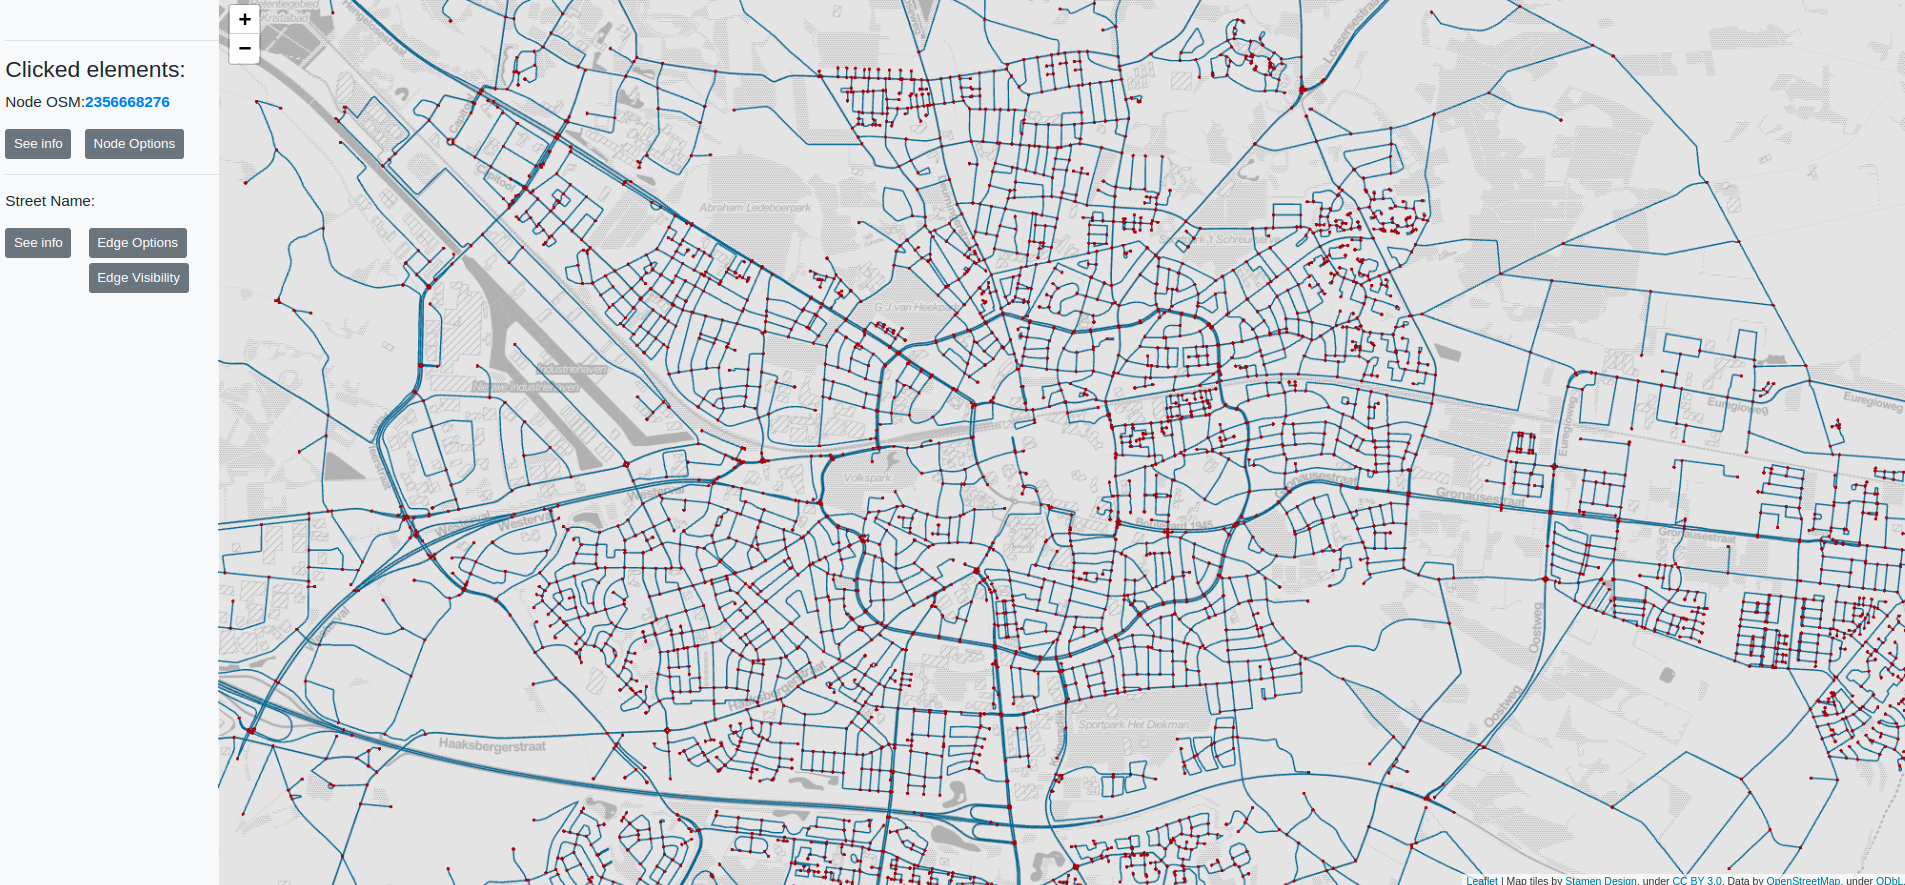
app.run_server()Interacción con nodos y enlaces
-
Dash Sylvereye permite interactuar con los nodos (cruces de caminos) y los enlaces (caminos)
-
Lo anterior a través de la detección de eventos de click
-
Esto significa que puede asociar un callback al evento click de los nodos y/o enlaces
-
Dash Sylvereye pasará al callback los datos del elemento clickeado
Ejemplo 2: Interacción con la red de caminos
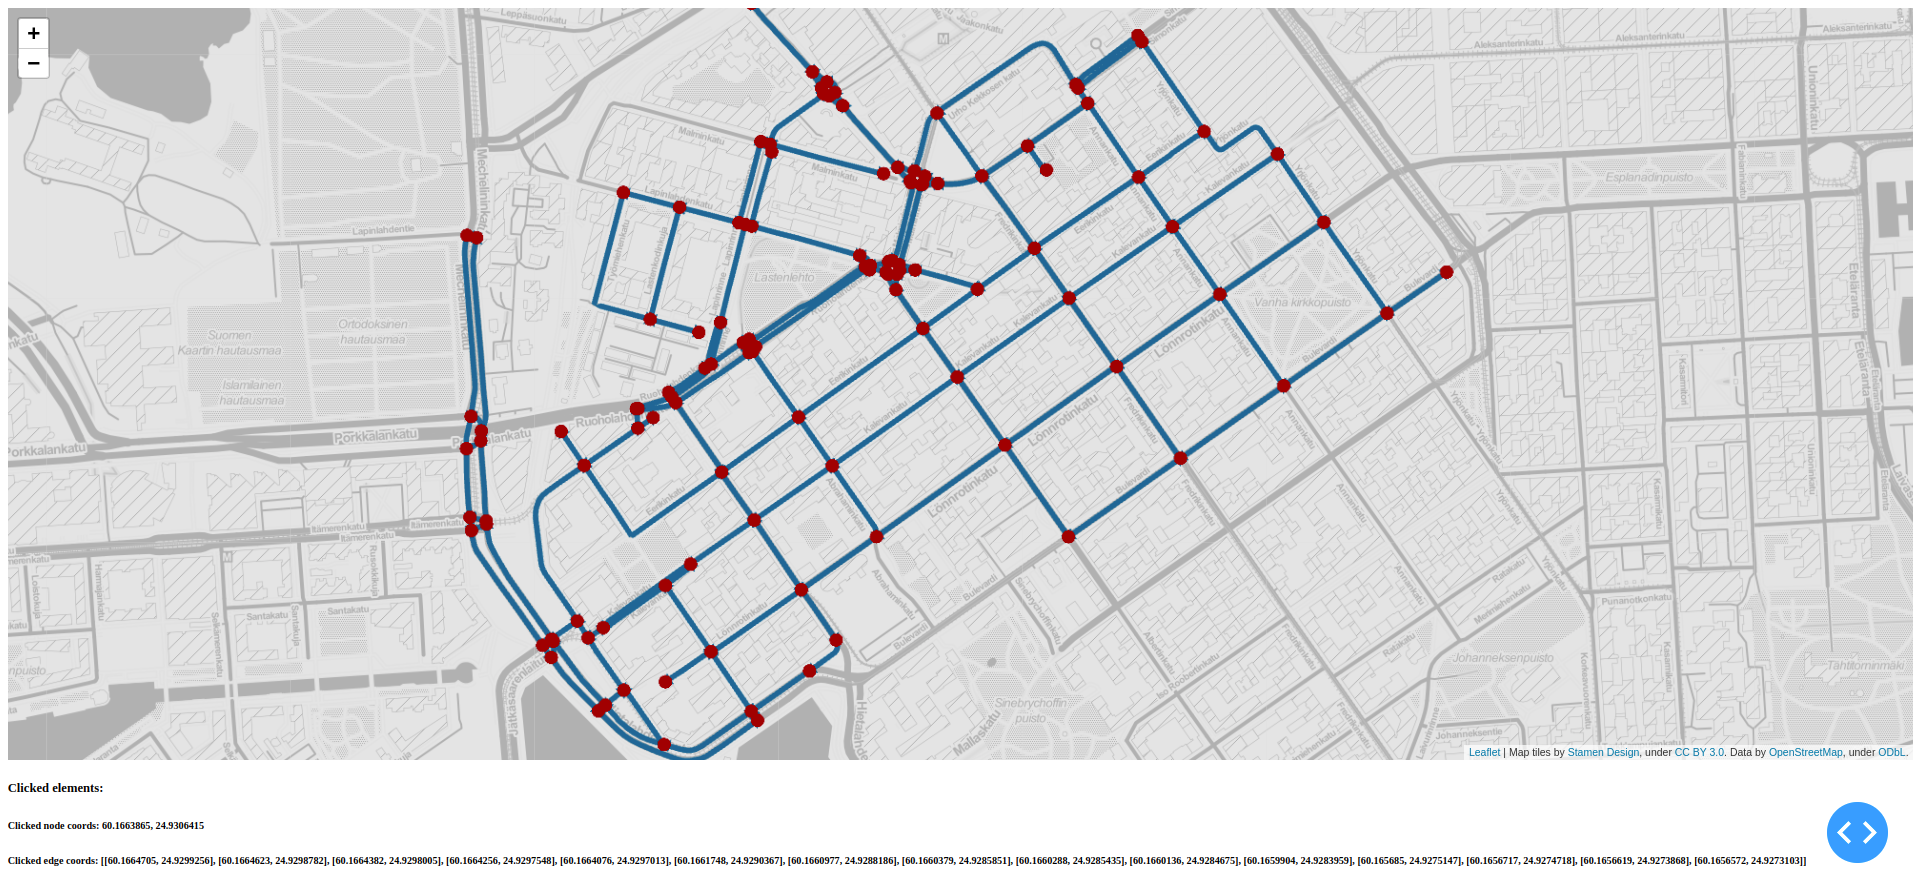
Ejemplo 2: Interacción con la red de caminos
import osmnx as ox
from dash import Dash
from dash.dependencies import Input, Output
from dash_html_components import Div
from dash_html_components import H2, H3
from dash_sylvereye import SylvereyeRoadNetwork
from dash_sylvereye.utils import load_from_osmnx_graph

# configuración de la visualización
OSMNX_QUERY = 'Kamppi, Helsinki, Finland'
TILE_LAYER_URL = '//stamen-tiles-{s}.a.ssl.fastly.net/toner/{z}/{x}/{y}.png'
TILE_LAYER_SUBDOMAINS = 'abcd'
TILE_LAYER_ATTRIBUTION = 'Map tiles by <a href="http://stamen.com">Stamen Design</a>, under <a href="http://creativecommons.org/licenses/by/3.0">CC BY 3.0</a>. Data by <a href="http://openstreetmap.org">OpenStreetMap</a>, under <a href="http://www.openstreetmap.org/copyright">ODbL</a>.'
MAP_CENTER = [60.1663, 24.9313]
MAP_ZOOM = 15
MAP_STYLE = {'width': '100%', 'height': '84vh'}

# obtener la topología de la red desde OSM
road_network = ox.graph_from_place(OSMNX_QUERY, network_type='drive')
nodes_data, edges_data = load_from_osmnx_graph(road_network)

# construcción de la visualización
app = Dash()
app.layout = Div([
    SylvereyeRoadNetwork(
                         id='sylvereye-roadnet',
                         tile_layer_url=TILE_LAYER_URL,
                         tile_layer_subdomains=TILE_LAYER_SUBDOMAINS,
                         tile_layer_attribution=TILE_LAYER_ATTRIBUTION,
                         map_center=MAP_CENTER,
                         map_zoom=MAP_ZOOM,
                         map_style=MAP_STYLE,
                         nodes_data=nodes_data,
                         edges_data=edges_data
                        ),
    H5("Clicked elements:"),
    H6(id='h3-clicked-node-coords'),
    H6(id='h3-clicked-edge-coords')
])

# callbacks
@app.callback(
    Output('h3-clicked-node-coords', 'children'),
    [Input('sylvereye-roadnet', 'clicked_node')])
def update_node_data(clicked_node):
    if clicked_node:
        return f'Clicked node coords: {clicked_node["data"]["lat"]}, \
                                      {clicked_node["data"]["lon"]}'

@app.callback(
    Output('h3-clicked-edge-coords', 'children'),
    [Input('sylvereye-roadnet', 'clicked_edge')])
def update_edge_data(clicked_edge):
    if clicked_edge:
        return f'Clicked edge coords: {clicked_edge["data"]["coords"]}'

# correr visualización
if __name__ == '__main__':
    app.run_server()
Personalización de los estilos de la visualización
-
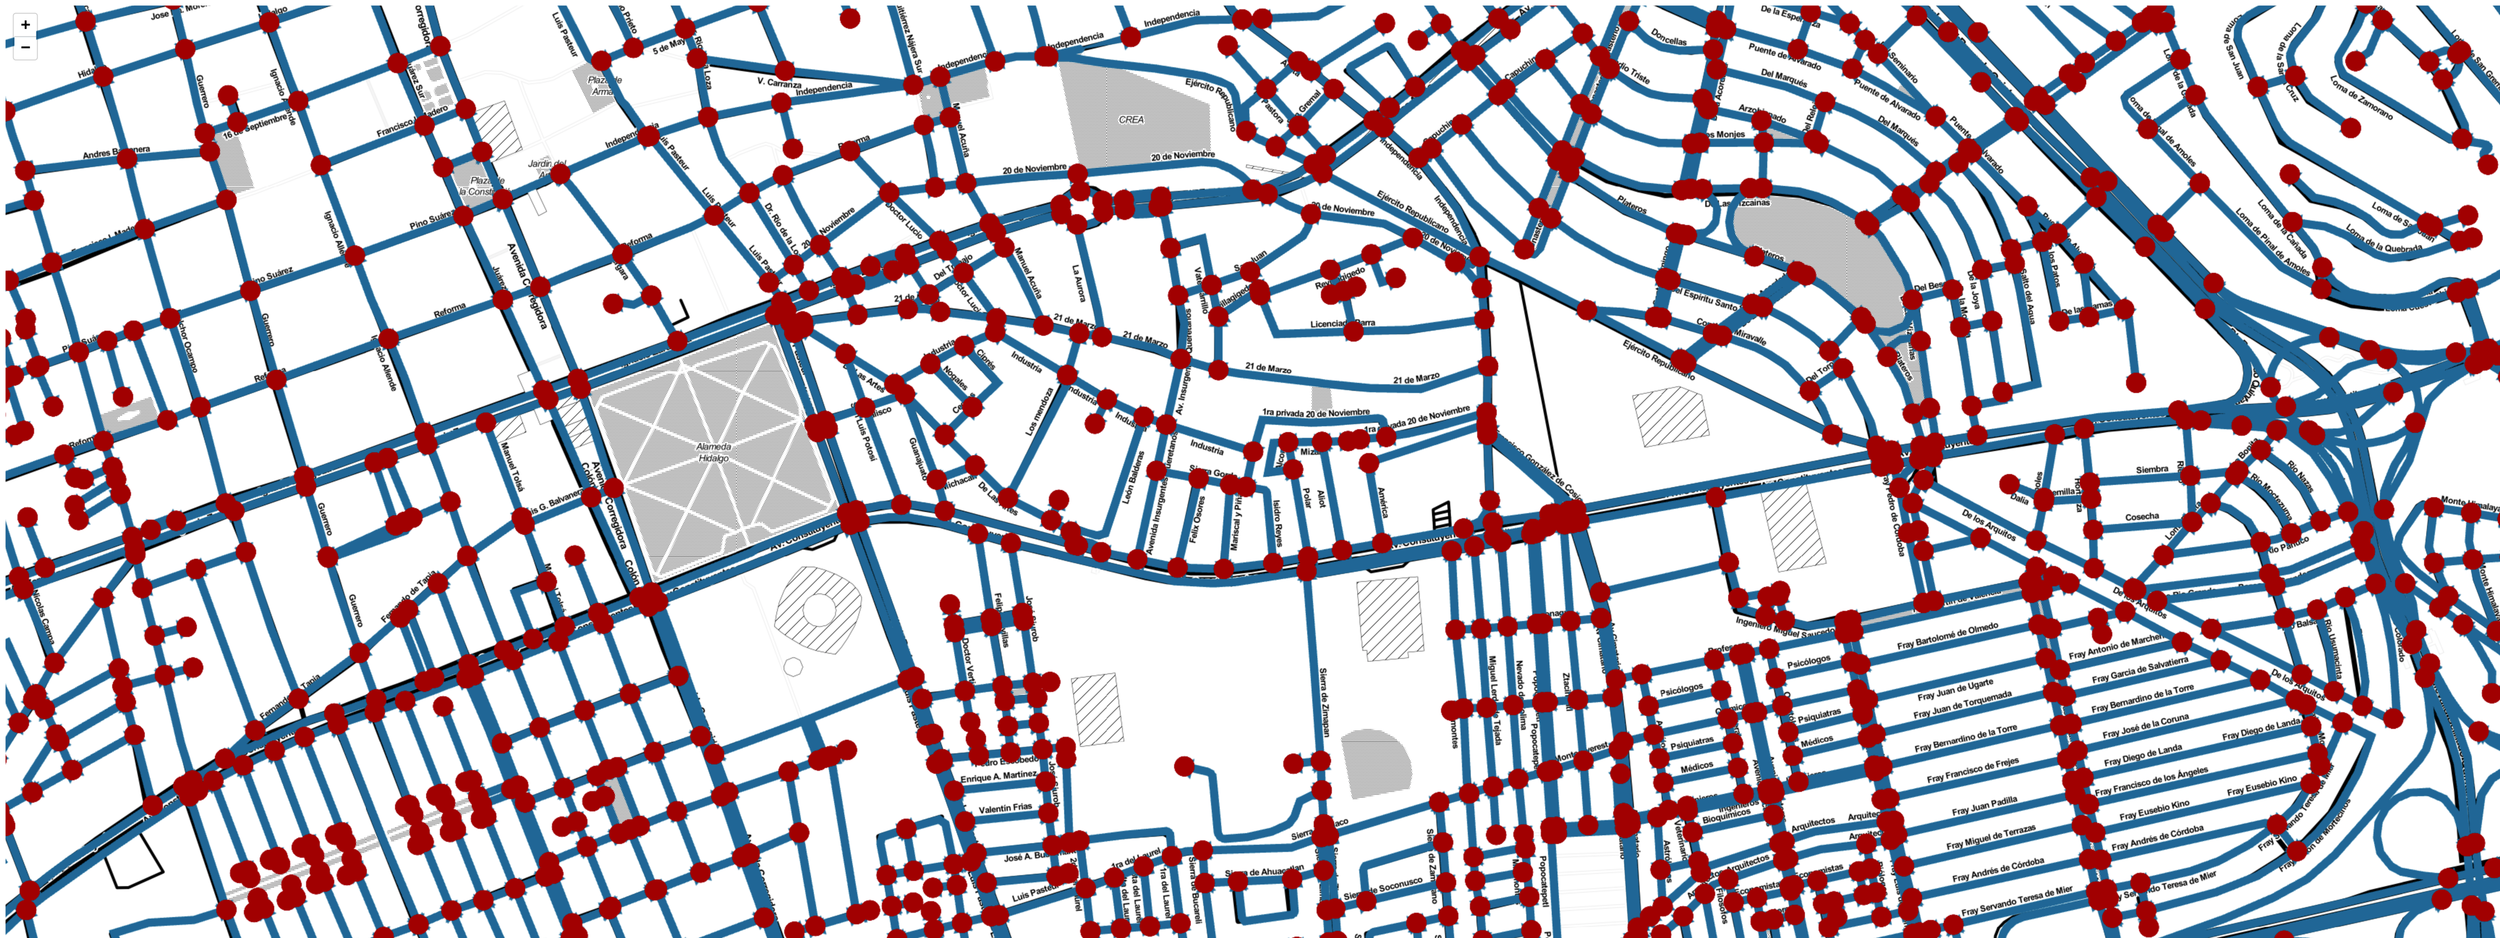
Dash Sylvereye permite la configuración visual de los nodos y enlaces individuales de la red
-
Para los nodos es posible configurar su diámetro, color y transparencia
-
Para los enlaces es posible configurar su grosor, color y transparencia
-
Dash Sylvereye puede calcular automáticamente el color de nodos y enlaces en función de un atributo de peso
Ejemplo 3: Personalización de la visualización de una red
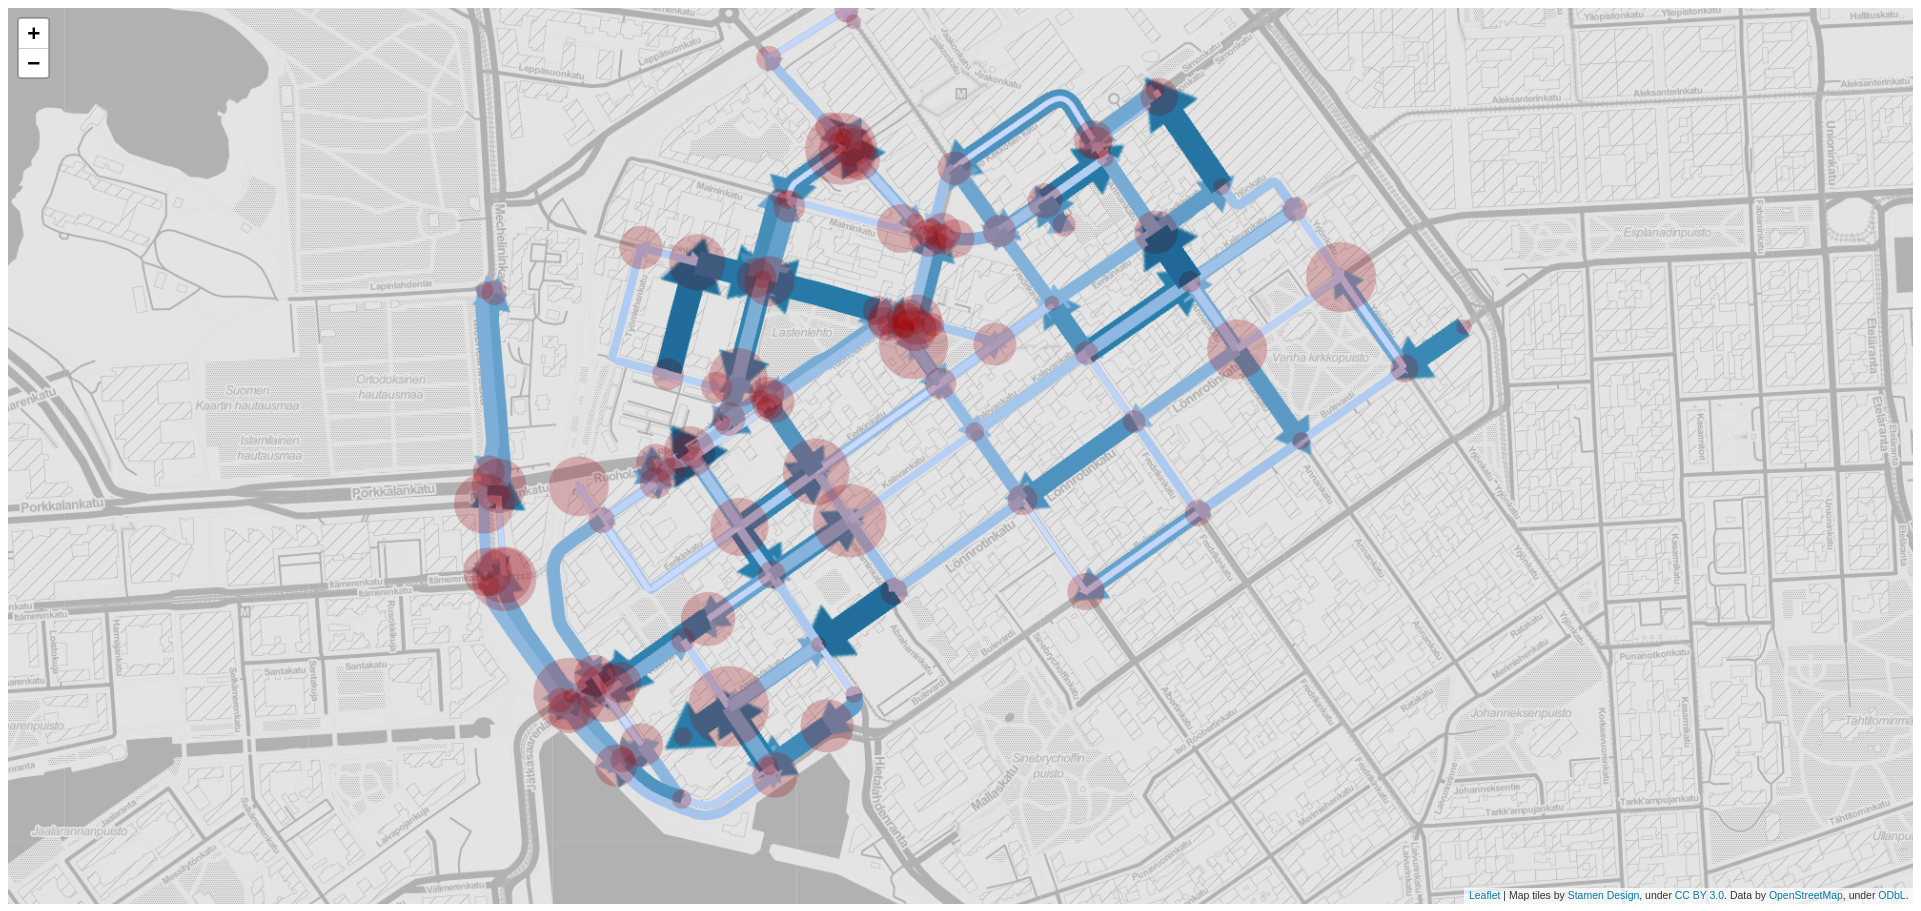
Ejemplo 3: Personalización de la visualización de una red
import osmnx as ox
import numpy as np
from dash import Dash
from dash_html_components import Div
from dash_sylvereye import SylvereyeRoadNetwork
from dash_sylvereye.utils import load_from_osmnx_graph
from dash_sylvereye.enums import NodeSizeMethod, EdgeColorMethod, EdgeWidthMethod
from dash_sylvereye.defaults import get_default_node_options, get_default_edge_options
OSMNX_QUERY = 'Kamppi, Helsinki, Finland'
TILE_LAYER_URL = '//stamen-tiles-{s}.a.ssl.fastly.net/toner/{z}/{x}/{y}.png'
TILE_LAYER_SUBDOMAINS = 'abcd'
TILE_LAYER_ATTRIBUTION = 'Map tiles by <a href="http://stamen.com">Stamen Design</a>, under <a href="http://creativecommons.org/licenses/by/3.0">CC BY 3.0</a>. Data by <a href="http://openstreetmap.org">OpenStreetMap</a>, under <a href="http://www.openstreetmap.org/copyright">ODbL</a>.'
MAP_CENTER = [60.1663, 24.9313]
MAP_ZOOM = 15
MAP_STYLE = {'width': '100%', 'height': '84vh'}
# obtener la red desde OSM
road_network = ox.graph_from_place(OSMNX_QUERY, network_type='drive')
nodes_data, edges_data = load_from_osmnx_graph(road_network)
# asignar pesos aleatorios a los nodos y enlaces de acuerdo a una dist. libre de escala
for node in nodes_data: node["data"]["weight"] = 1 - np.random.power(a=3, size=None)
for edge in edges_data: edge["data"]["weight"] = 1 - np.random.power(a=3, size=None)
# configurar las opciones visuales de los nodos
node_options = get_default_node_options()
node_options["alpha_default"] = 0.25
node_options["size_method"] = NodeSizeMethod.SCALE
node_options["size_scale_field"] = "weight"
# configurar las opciones visualies de los enlaces
edge_options = get_default_edge_options()
edge_options["width_method"] = EdgeWidthMethod.SCALE
edge_options["width_scale_field"] = "weight"
edge_options["color_method"] = EdgeColorMethod.SCALE
edge_options["color_scale_field"] = "weight"
edge_options["color_scale_left"] = 0xcbdbff
edge_options["color_scale_right"] = 0x06696
# construir la visualización
app = Dash()
app.layout = Div([
SylvereyeRoadNetwork(
id='sylvereye-roadnet',
tile_layer_url=TILE_LAYER_URL,
tile_layer_subdomains=TILE_LAYER_SUBDOMAINS,
tile_layer_attribution=TILE_LAYER_ATTRIBUTION,
map_center=MAP_CENTER,
map_zoom=MAP_ZOOM,
map_style=MAP_STYLE,
nodes_data=nodes_data,
edges_data=edges_data,
node_options=node_options,
edge_options=edge_options
)
])
# correr servidor
if __name__ == '__main__':
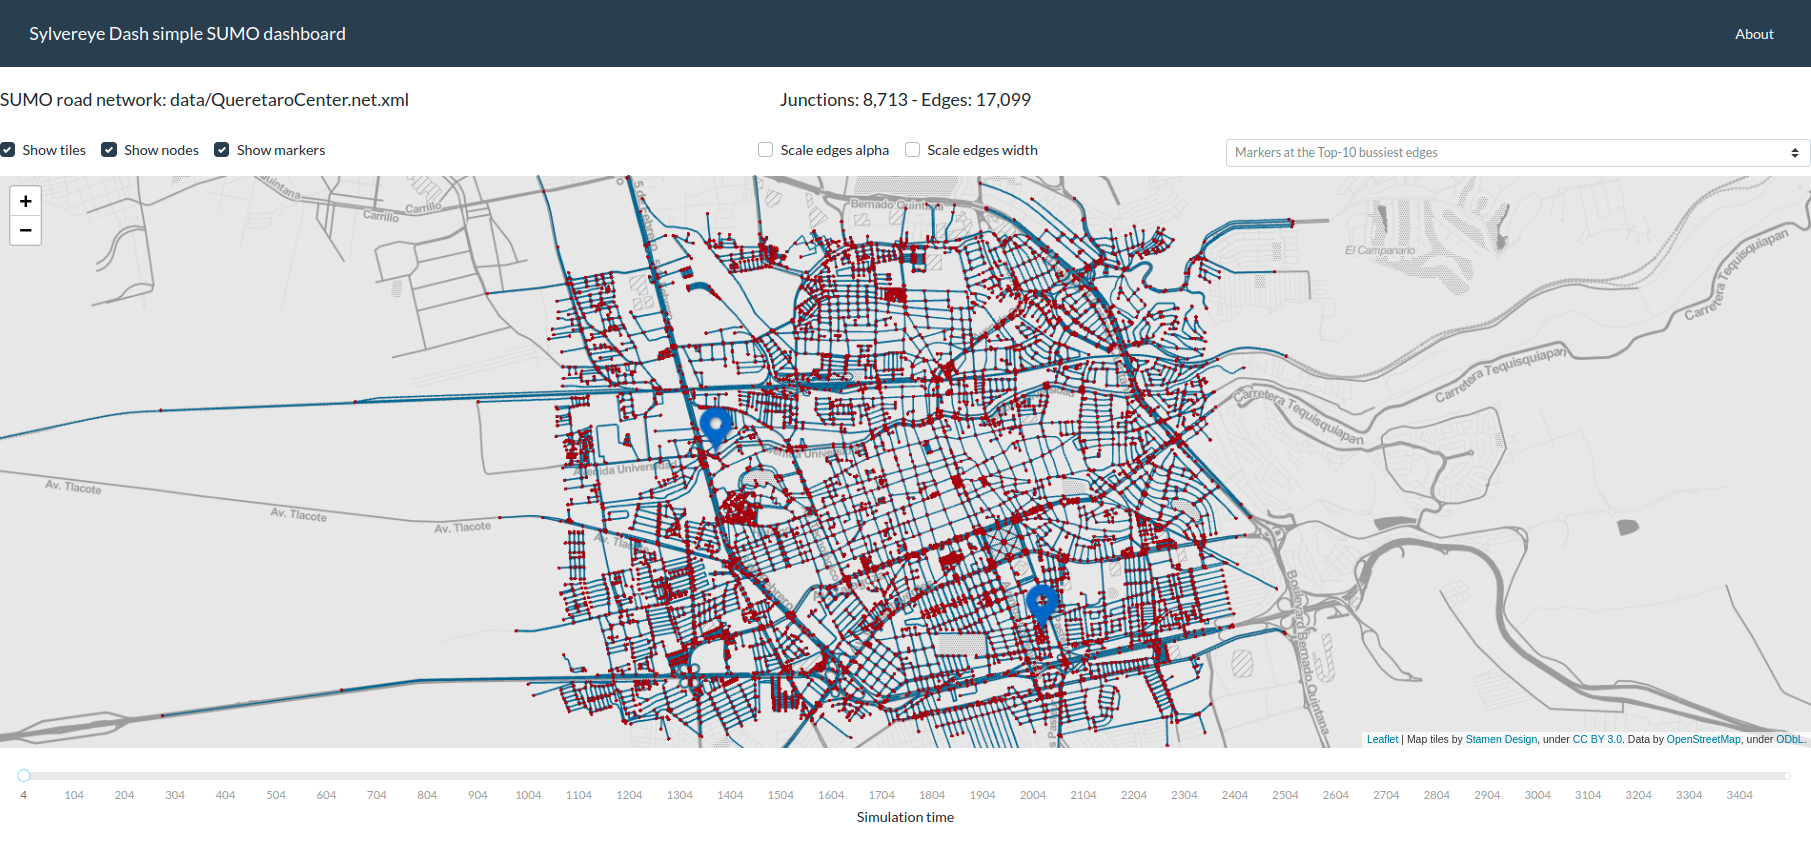
app.run_server()Visualización de marcadores
-
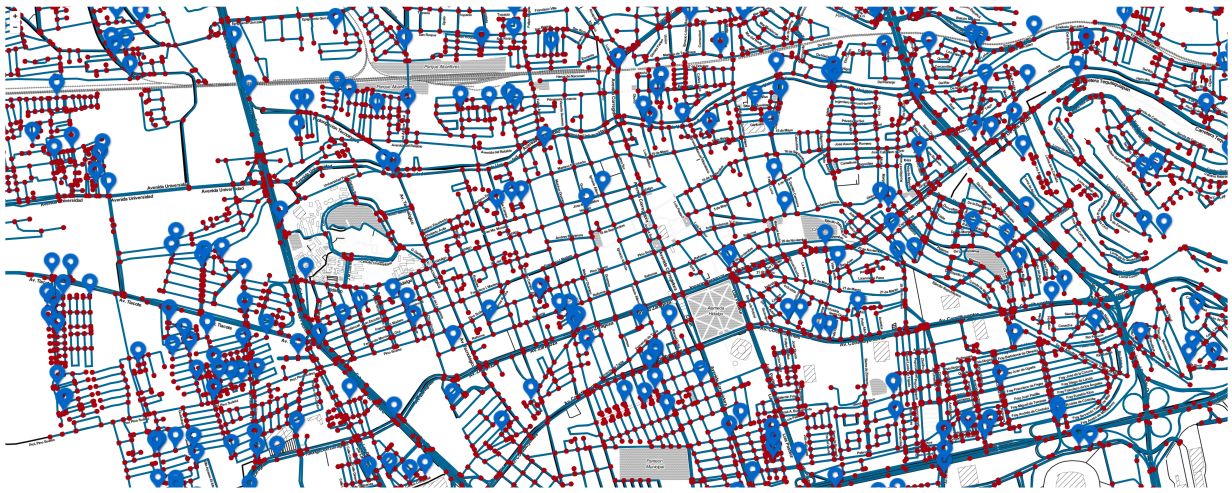
Dash Sylvereye permite visualizar marcadores encima tanto del mapa web como de la red
-
Los marcadores son interactivos: es posible asociar un callback al evento click de cada marcador
-
Dash Sylvereye pasará los datos del marcador clickeado a un parámetro del callback
Ejemplo 4: Visualización de marcadores sobre la red
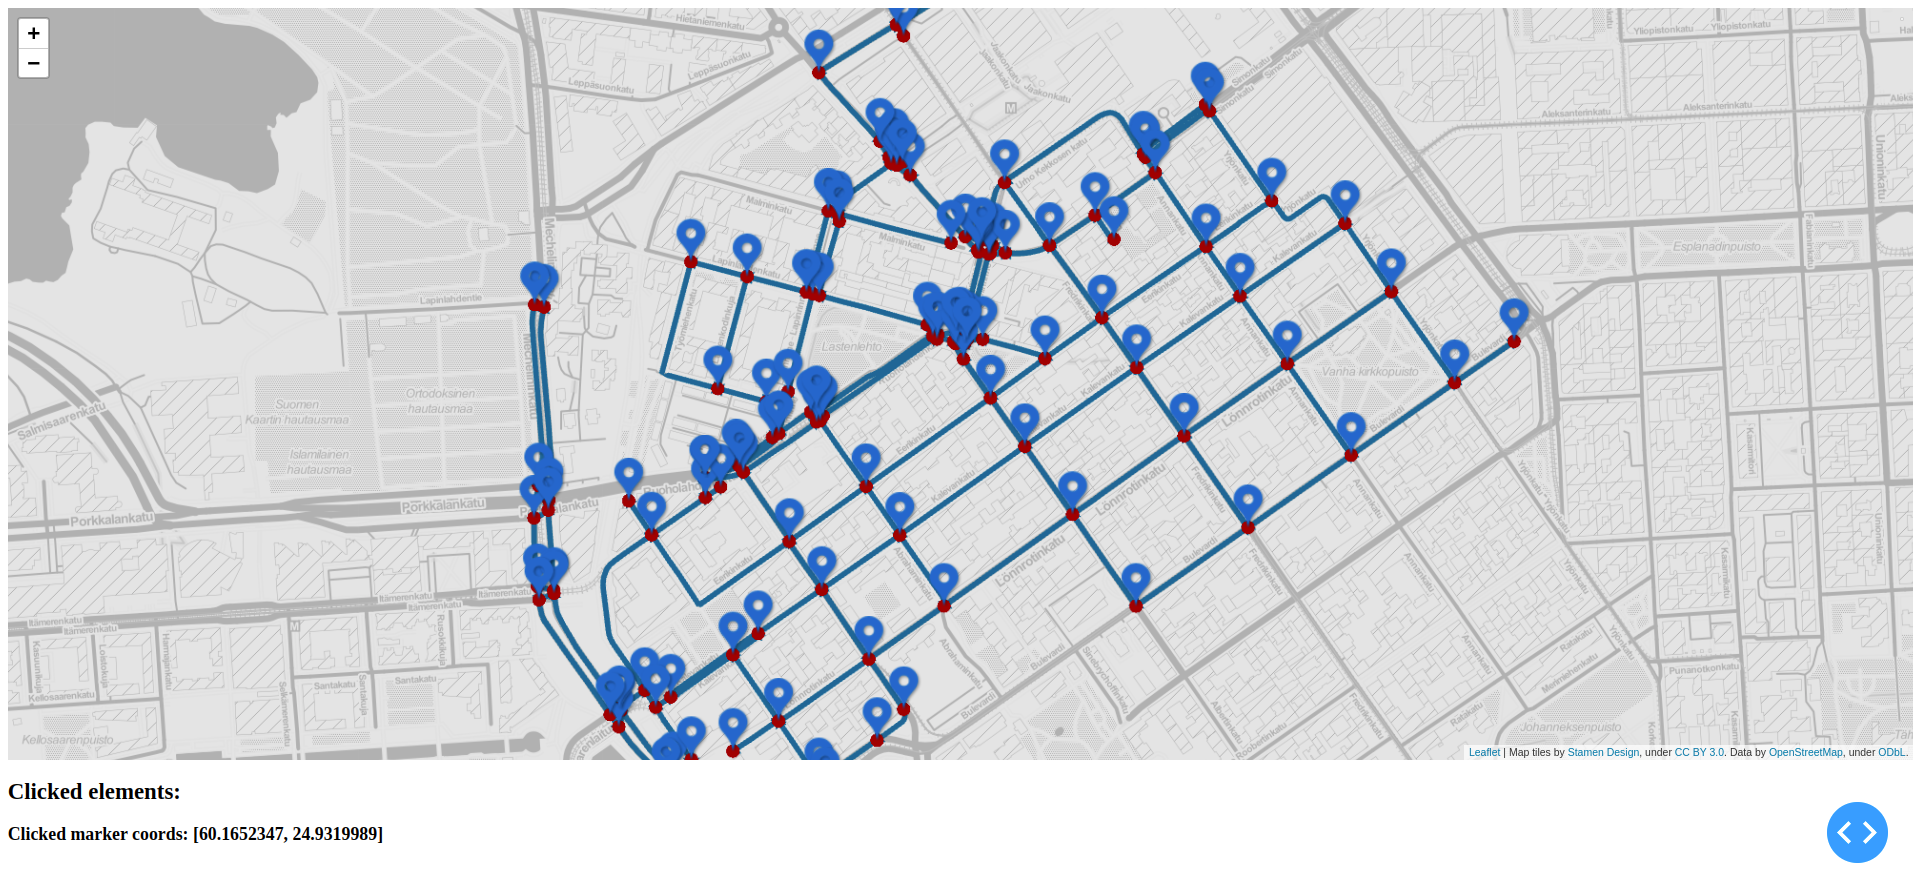
Ejemplo 4: Visualización de marcadores sobre la red
import osmnx as ox
from dash import Dash
from dash.dependencies import Input, Output
from dash_html_components import Div
from dash_html_components import H2, H3
from dash_sylvereye import SylvereyeRoadNetwork
from dash_sylvereye.utils import load_from_osmnx_graph, generate_markers_from_coords
from dash_sylvereye.defaults import get_default_marker_options
OSMNX_QUERY = 'Kamppi, Helsinki, Finland'
TILE_LAYER_URL = '//stamen-tiles-{s}.a.ssl.fastly.net/toner/{z}/{x}/{y}.png'
TILE_LAYER_SUBDOMAINS = 'abcd'
TILE_LAYER_ATTRIBUTION = 'Map tiles by <a href="http://stamen.com">Stamen Design</a>, under <a href="http://creativecommons.org/licenses/by/3.0">CC BY 3.0</a>. Data by <a href="http://openstreetmap.org">OpenStreetMap</a>, under <a href="http://www.openstreetmap.org/copyright">ODbL</a>.'
MAP_CENTER = [60.1663, 24.9313]
MAP_ZOOM = 15
MAP_STYLE = {'width': '100%', 'height': '80vh'}
# obtener red de caminos desde OSM
road_network = ox.graph_from_place(OSMNX_QUERY, network_type='drive')
nodes_data, edges_data = load_from_osmnx_graph(road_network)
# crear un marcador por cada nodo de la red
markers_coords = [ [node_data["lat"], node_data["lon"]] for node_data in nodes_data ]
markers_data = generate_markers_from_coords(markers_coords)
# escalar el tamaño de los marcadores al nivel de zoom
marker_options = get_default_marker_options()
marker_options["enable_zoom_scaling"] = True
# construir visualización
app = Dash()
app.layout = Div([
SylvereyeRoadNetwork(
id='sylvereye-roadnet',
tile_layer_url=TILE_LAYER_URL,
tile_layer_subdomains=TILE_LAYER_SUBDOMAINS,
tile_layer_attribution=TILE_LAYER_ATTRIBUTION,
map_center=MAP_CENTER,
map_zoom=MAP_ZOOM,
map_style=MAP_STYLE,
nodes_data=nodes_data,
edges_data=edges_data,
markers_data=markers_data,
marker_options=marker_options
),
H2("Clicked elements:"),
H3(id='h3-clicked-marker-coords')
])
@app.callback(
Output('h3-clicked-marker-coords', 'children'),
[Input('sylvereye-roadnet', 'clicked_marker')])
def update_marker_data(clicked_marker):
if clicked_marker:
marker = clicked_marker["marker"]
return f'Clicked marker coords: {[ marker["lat"], marker["lon"] ]}'
# correr visualización
if __name__ == '__main__':
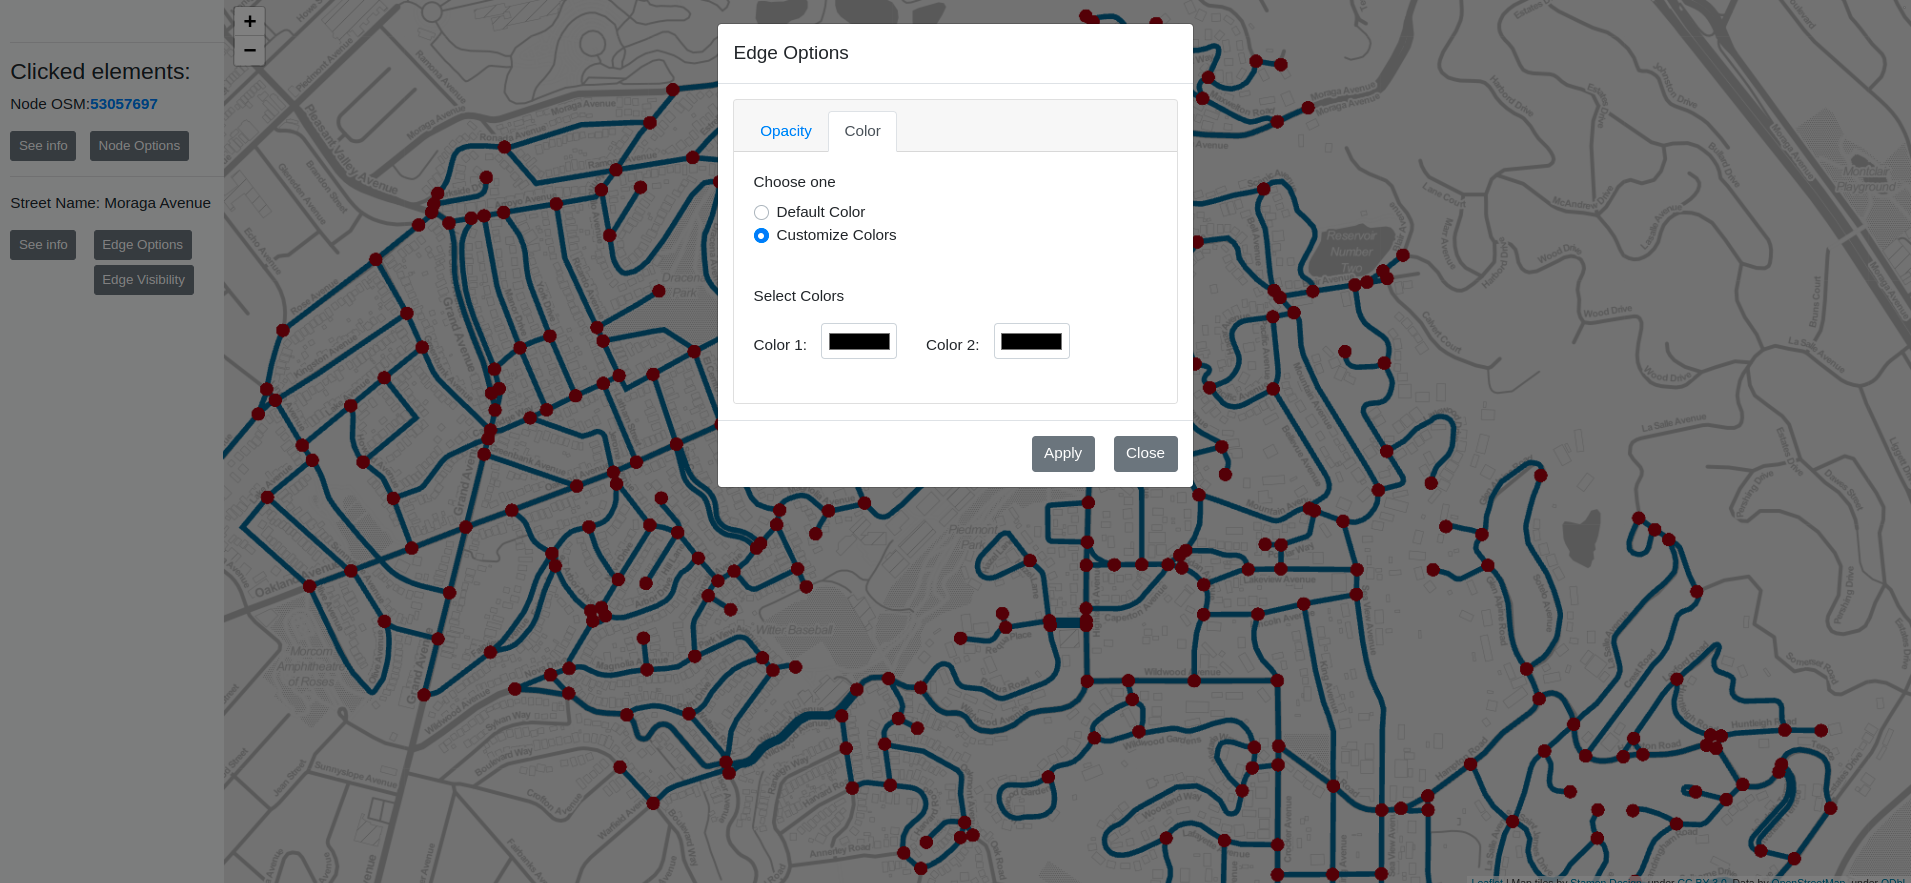
app.run_server()Más personalización e integración con otros componetes Dash
-
Dash Sylvereye puede ser combinado con Dash Core components y Dash Bootstrap Components para crear tableros más atractivos
-
Dash Sylvereye puede establecer el estilo de los enlaces (grosor, color y transparencia) en función de los datos almacenados en los enlaces
-
Dash Sylvereye permite la personalización de la escala de colores
Aplicaciones
Aplicaciones
Aplicaciones
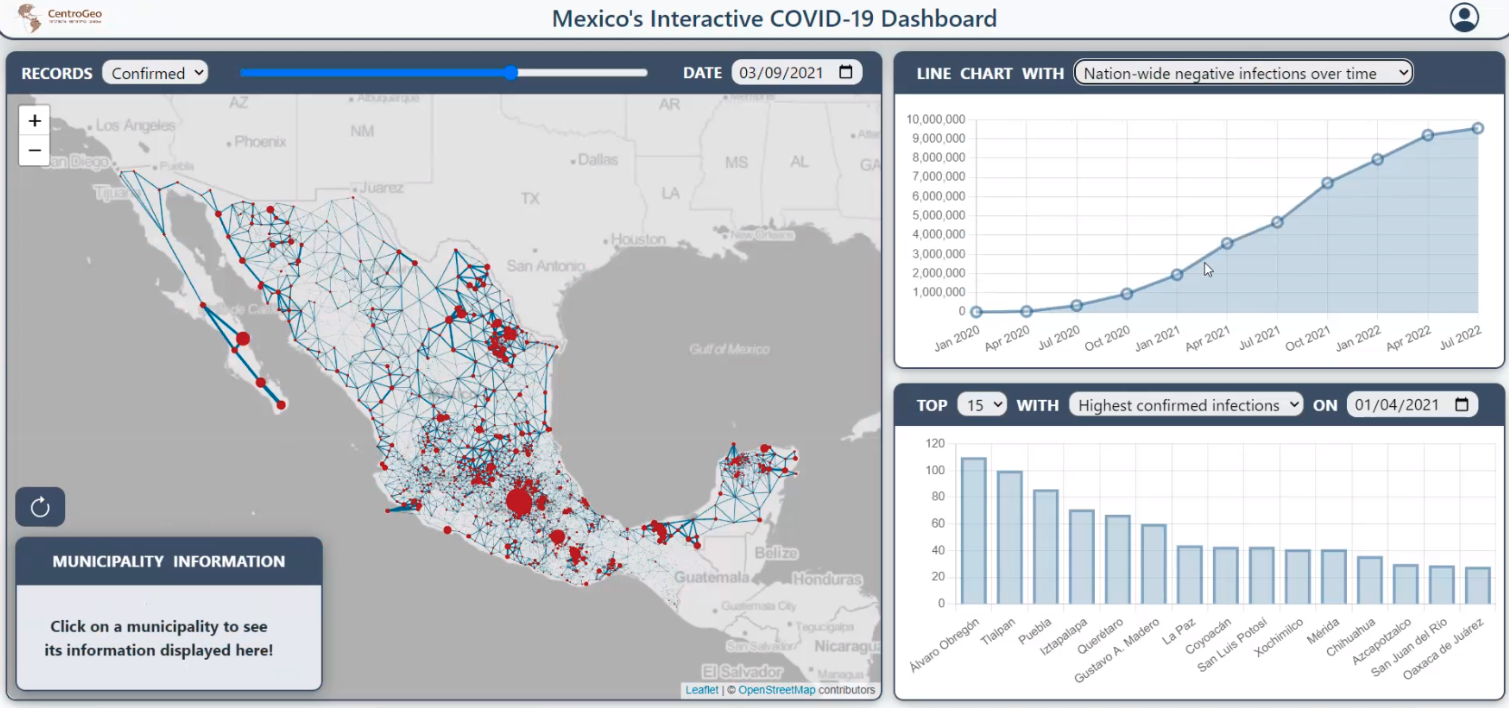
Aplicaciones
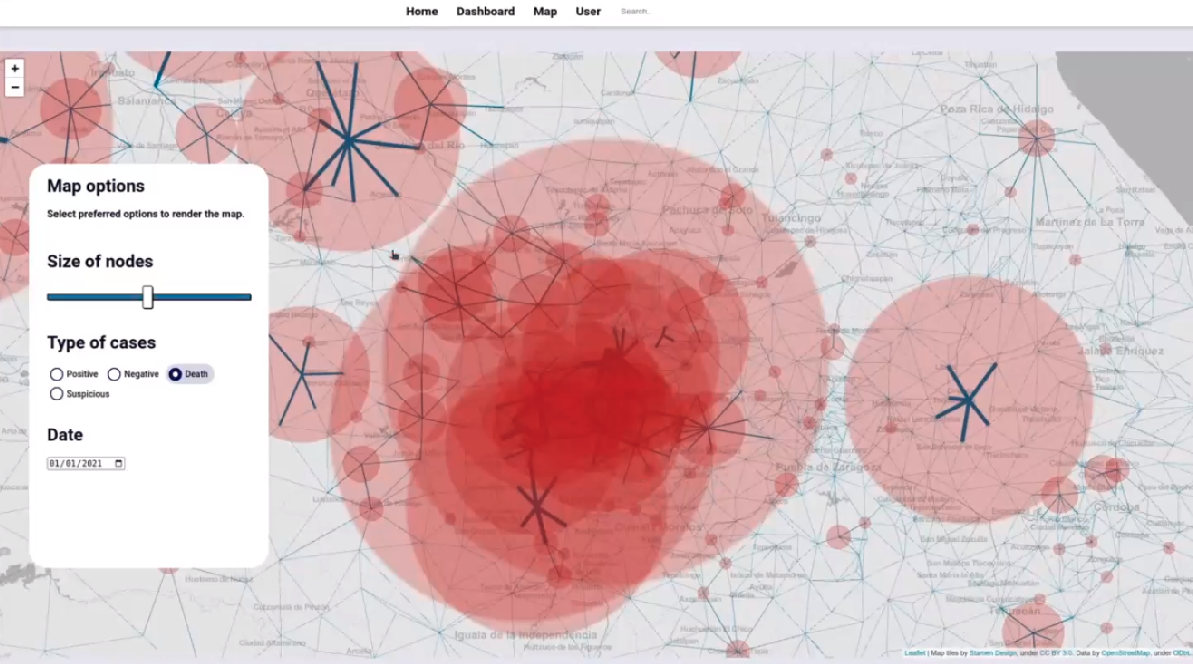
Aplicaciones
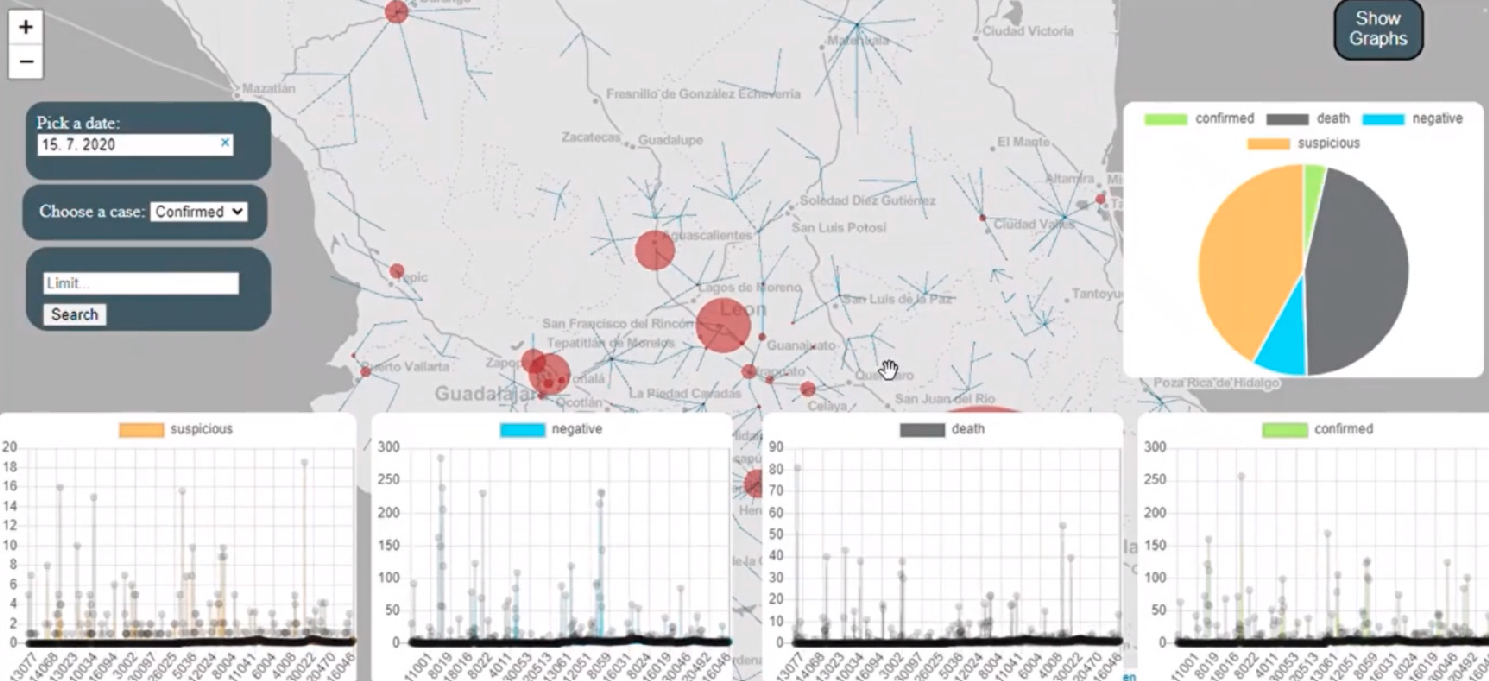
Aplicaciones
Dash Sylvereye: Portal Web


¡Gracias!
agarcia@centrogeo.edu.mx
Semana de las Ciencias de Información Geoespacial 2022
By Alberto Garcia-Robledo


