Performance issues
The usual suspects

About me
Alexandre Moureaux
Tech Lead @

Check out our open-source (github.com/bamlab) and our blog (blog.bam.tech)
Let's measure 🔥
You can use react-native-flipper-performance-monitor
Make your measures deterministic
- Average your measures over several iterations.
- Keep the same conditions for every measure
- Automate the behavior you want to test.
Introducing the CLI version
- Fully automated
- No installation required
-
Supports any android app
- Data updating often should be contained
- Single Reponsibility principle to avoid excessive rerenders
- Avoid rendering unneeded elements
- Beware of high algorithmic complexity
- Long running animations
- Heavy webviews
- Lists -> just try FlashList?
- Images
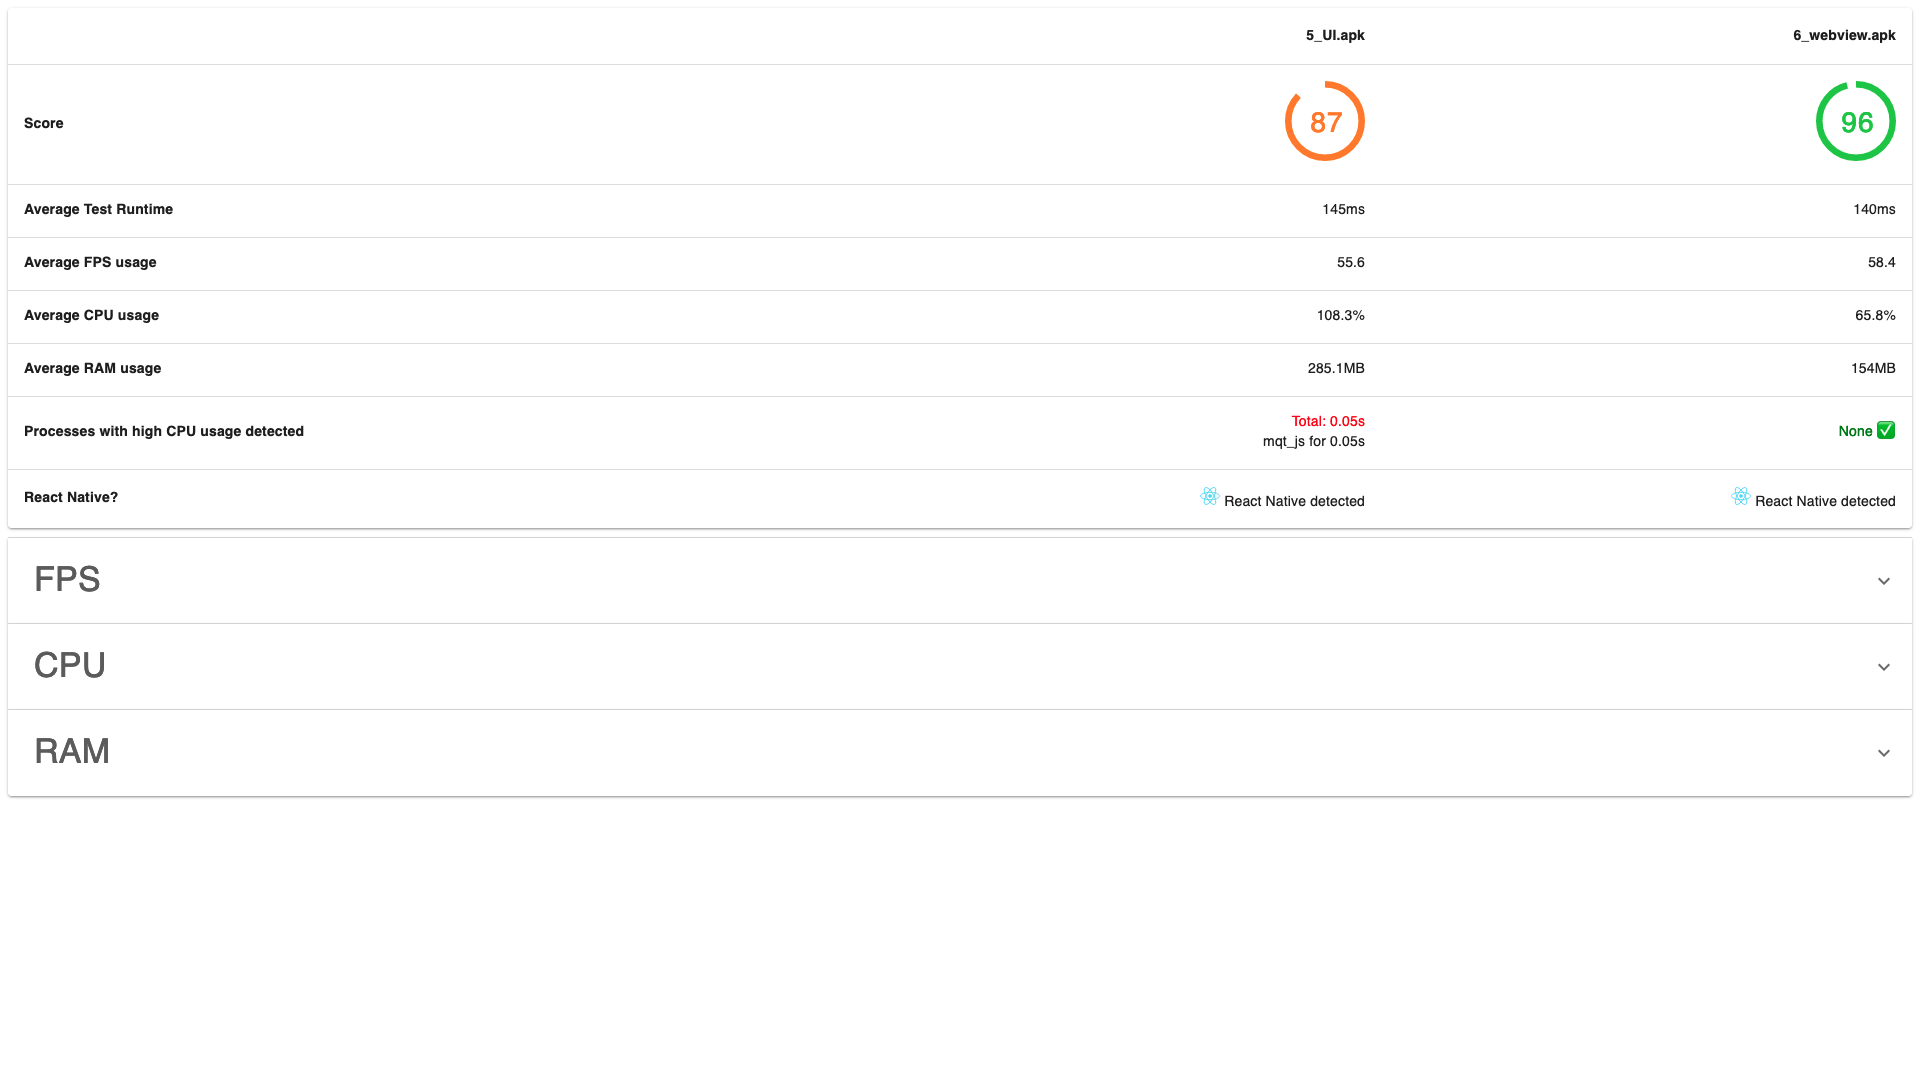
Measuring
Analyzing
-
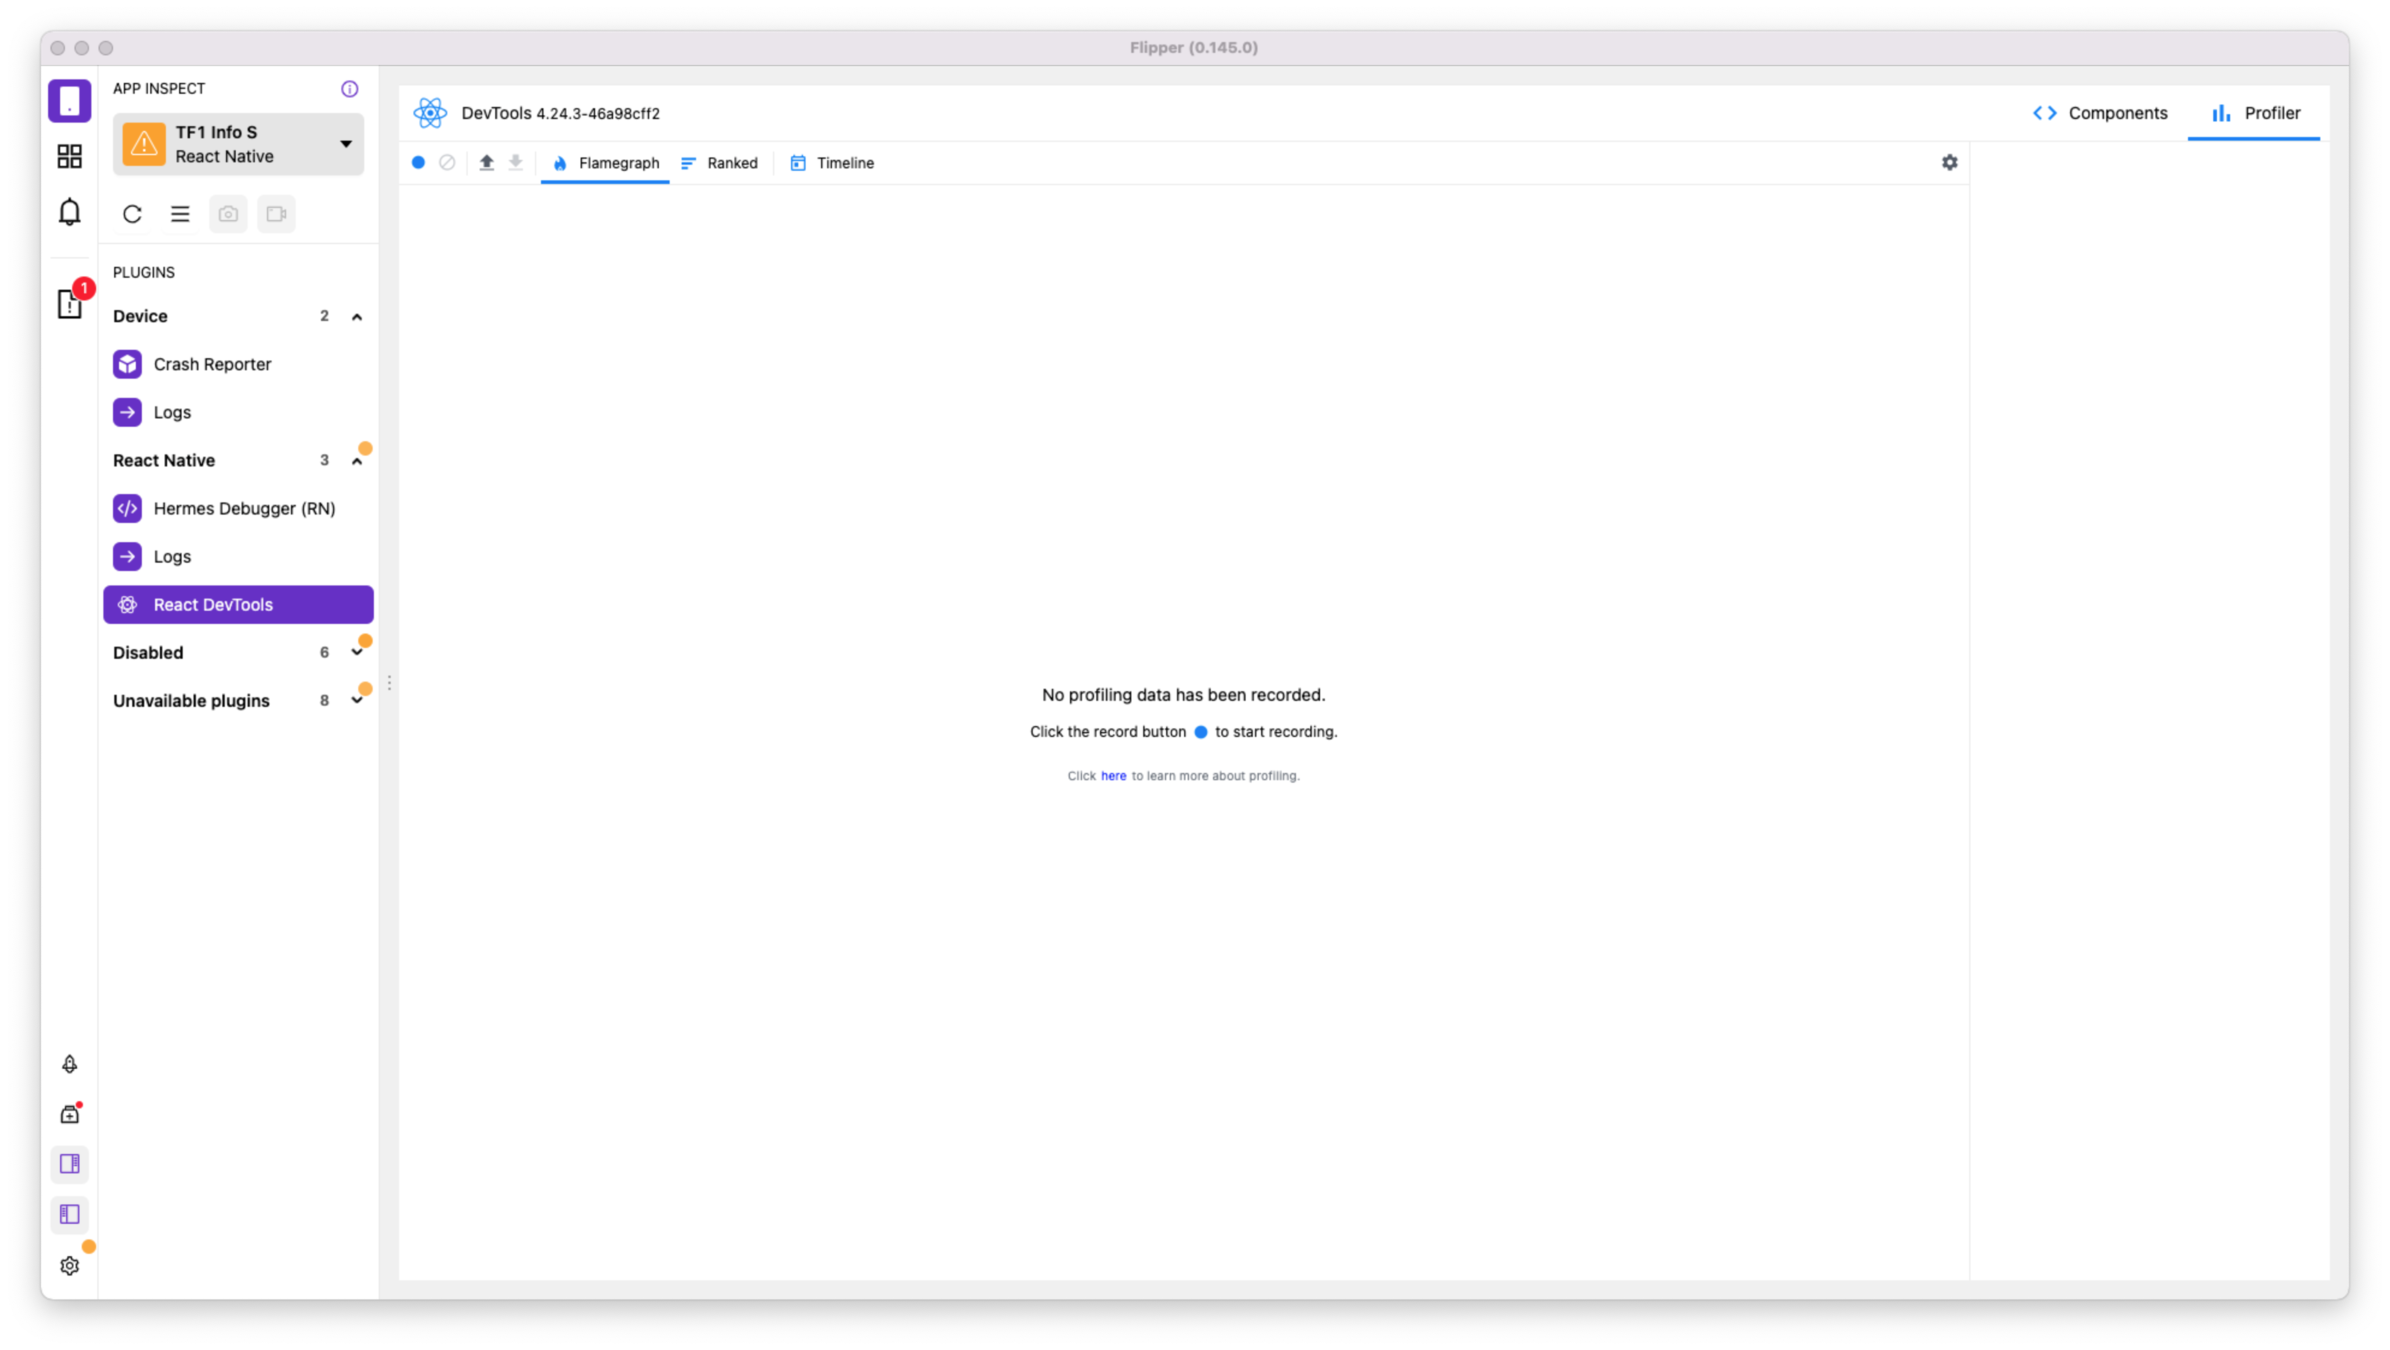
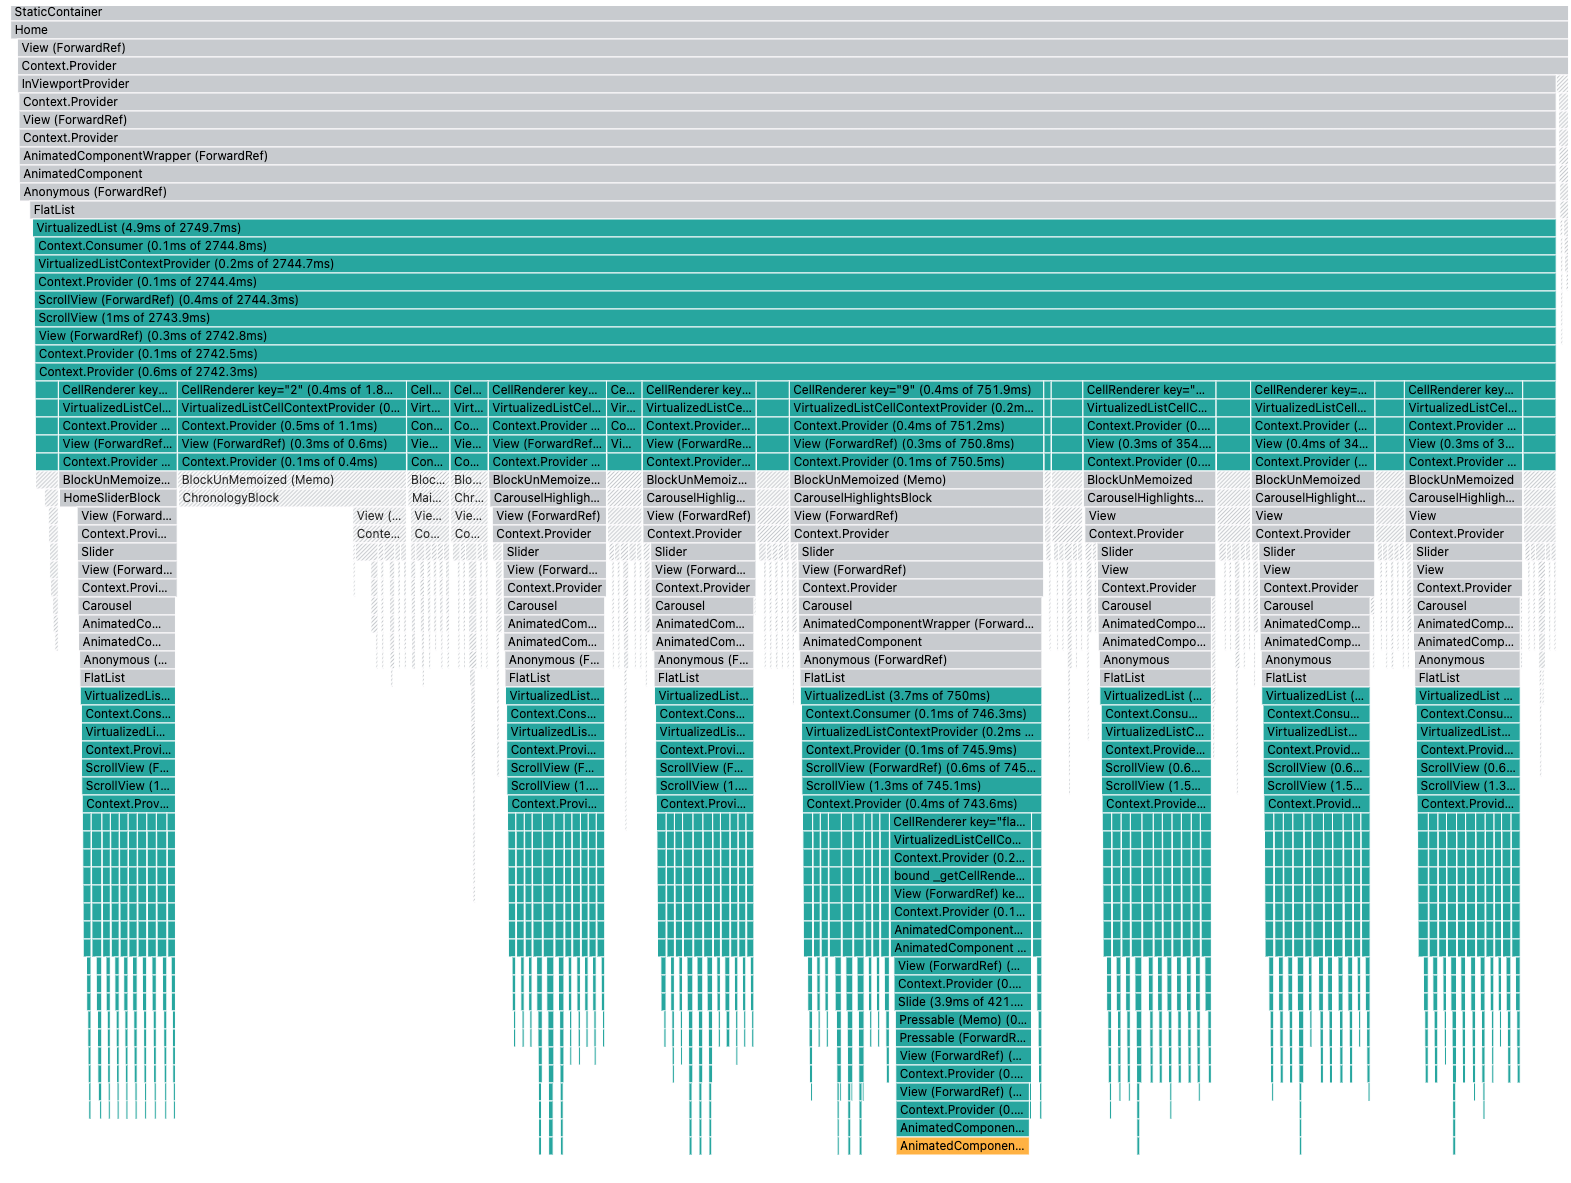
React Dev Tools
-
Hermes Profiler
-
Android Studio
-
Investigating Threads
Thank you!
:
)
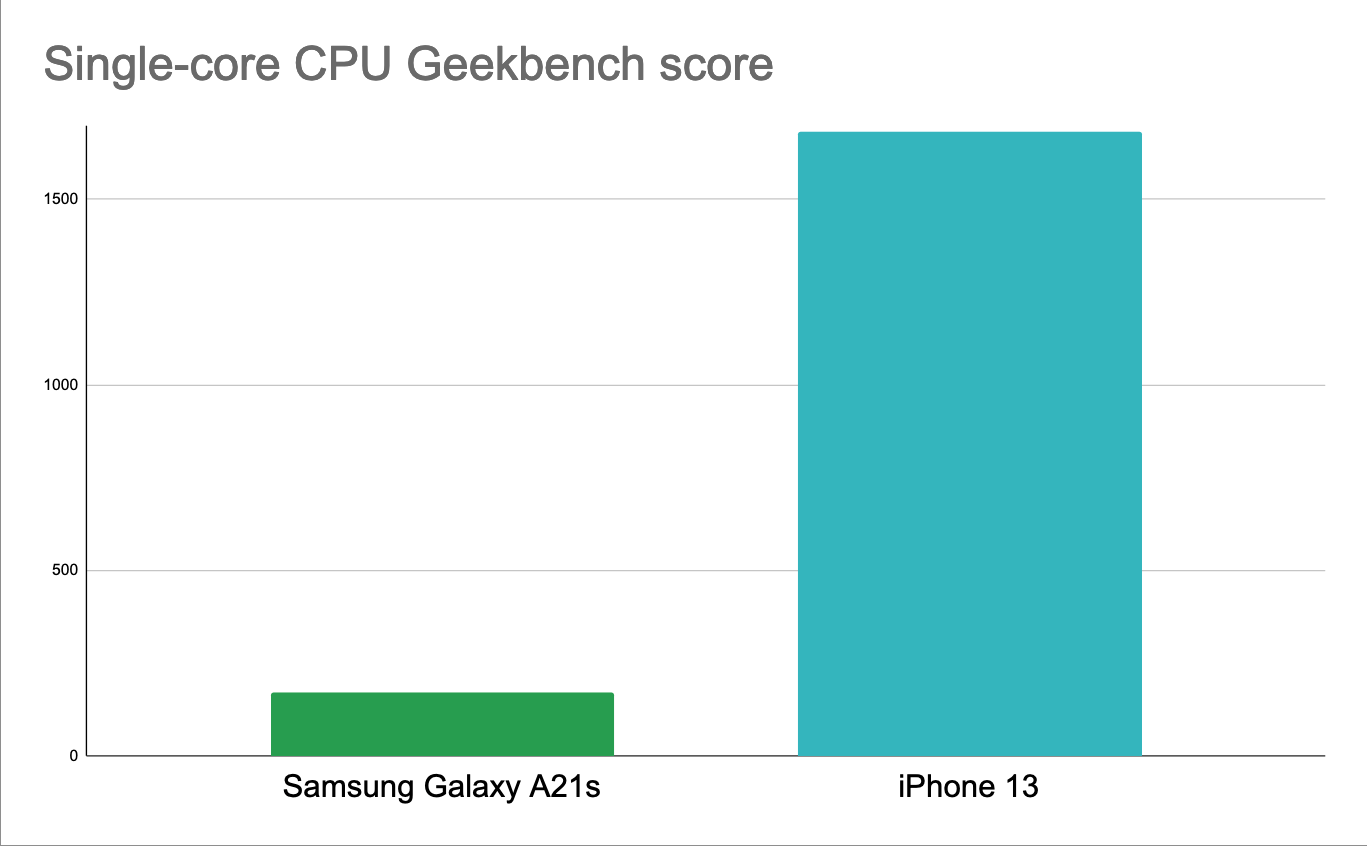
TIP 1
Test on a lower-end device

TIP 2
PRO TIP: adb is awesome ❤️

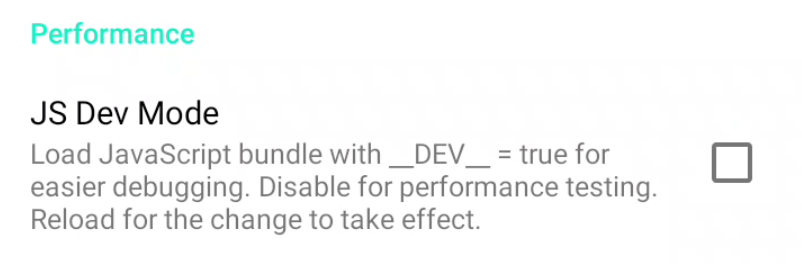
TIP 3
Disable JS Dev mode
TIP 4
Use the best analysis tools
The best performance analysis tools
- JS Thread
- React DevTools
-
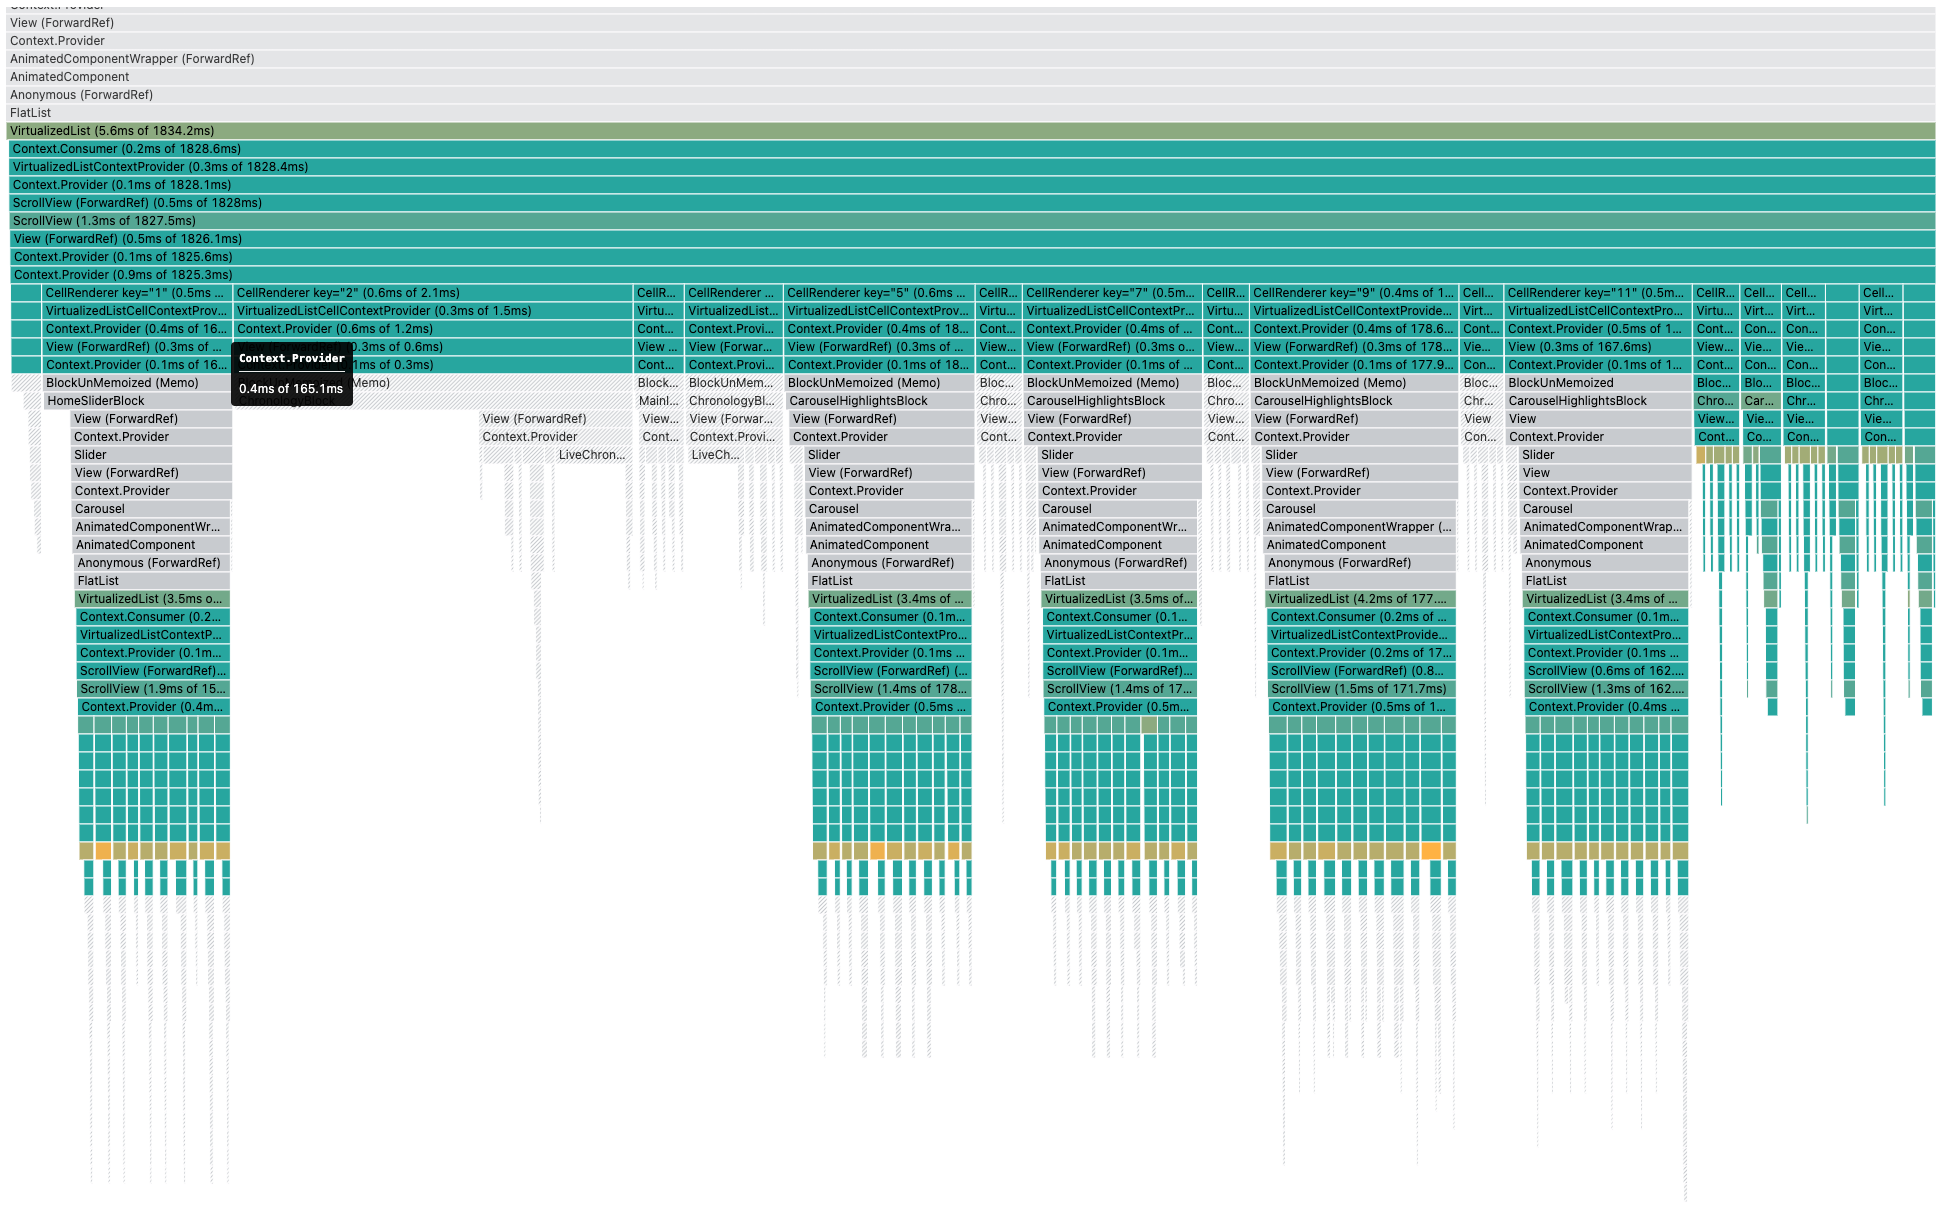
JS Flamegraph
- UI Thread -> native tools
- Android: System trace profiler
- iOS: XCode instruments
A concrete example
TF1 Info

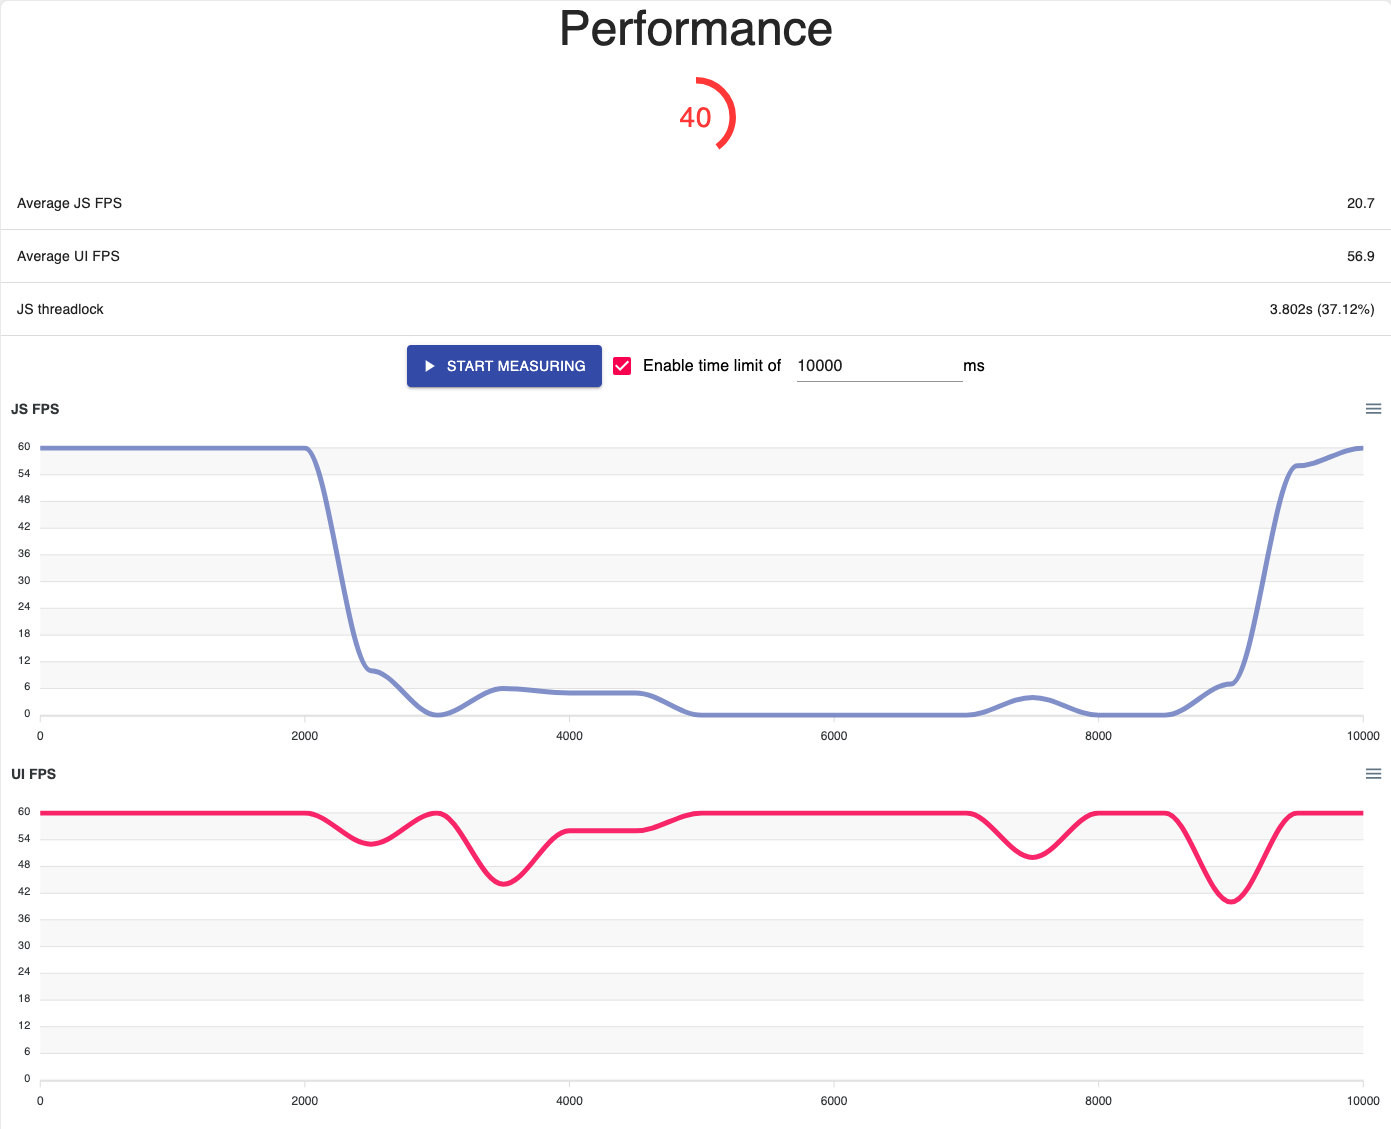
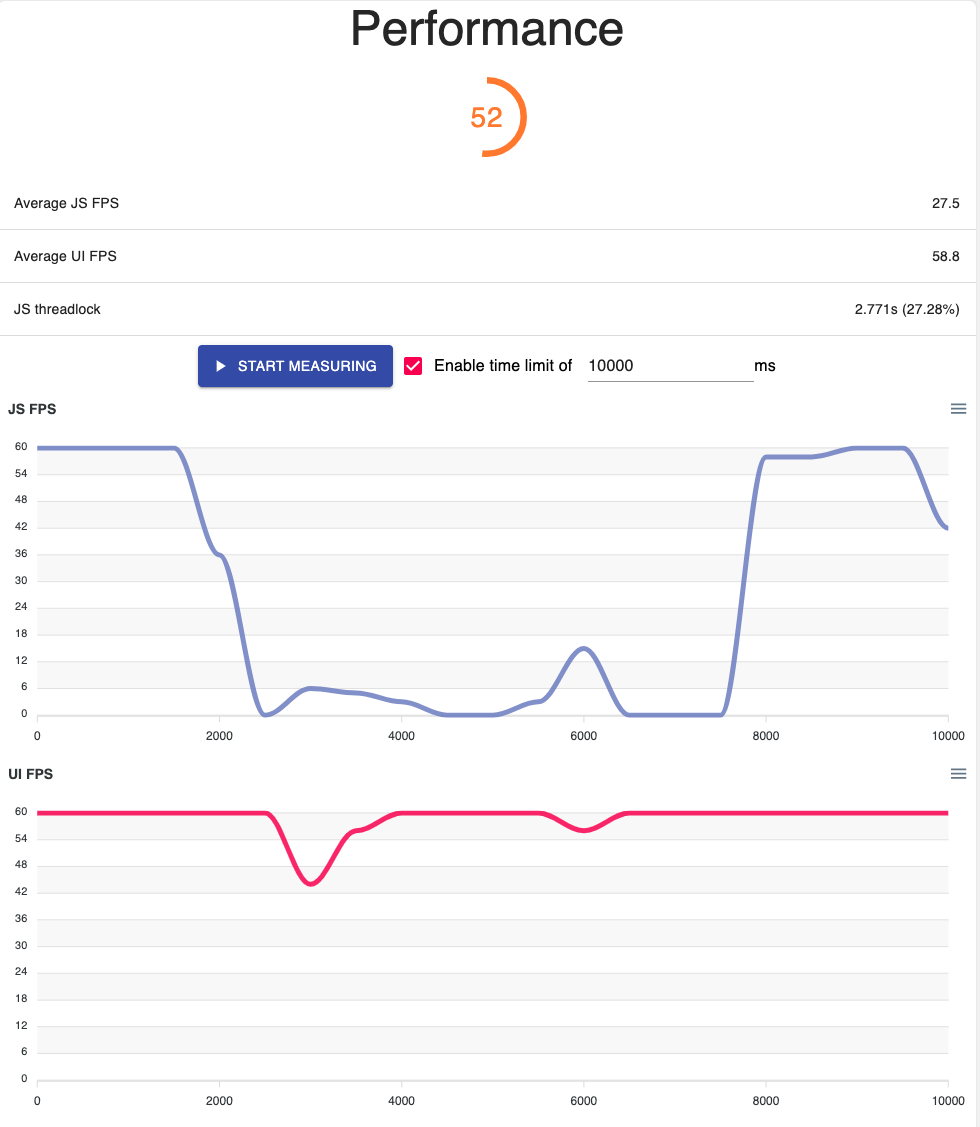
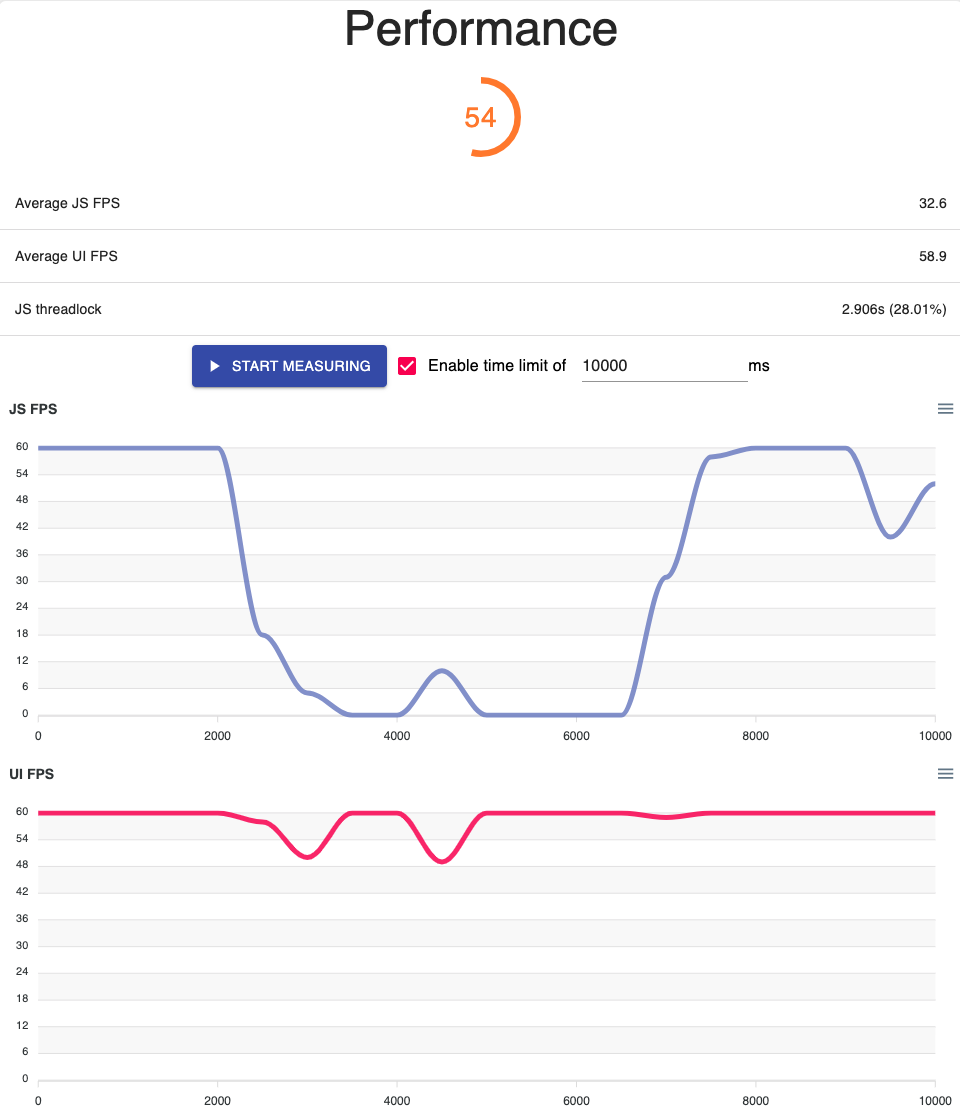
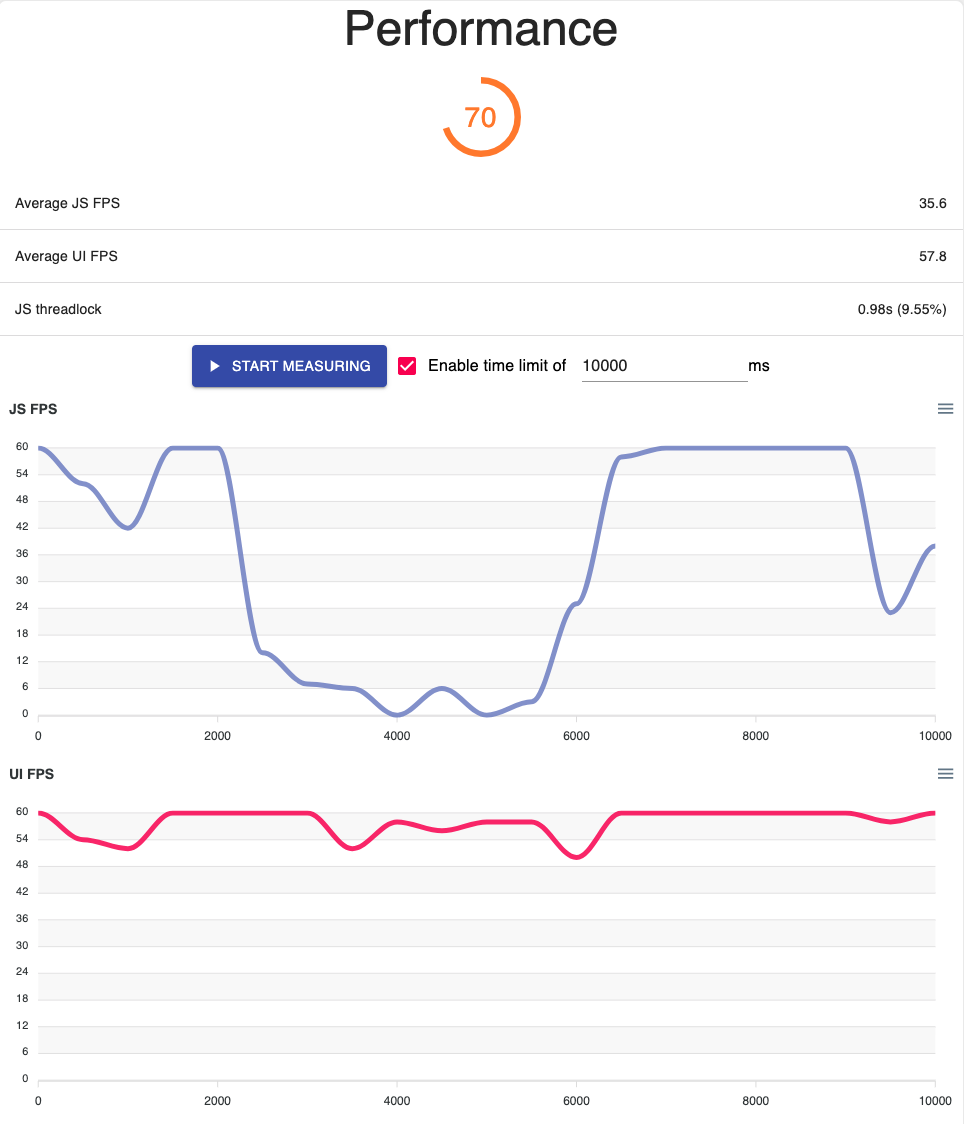
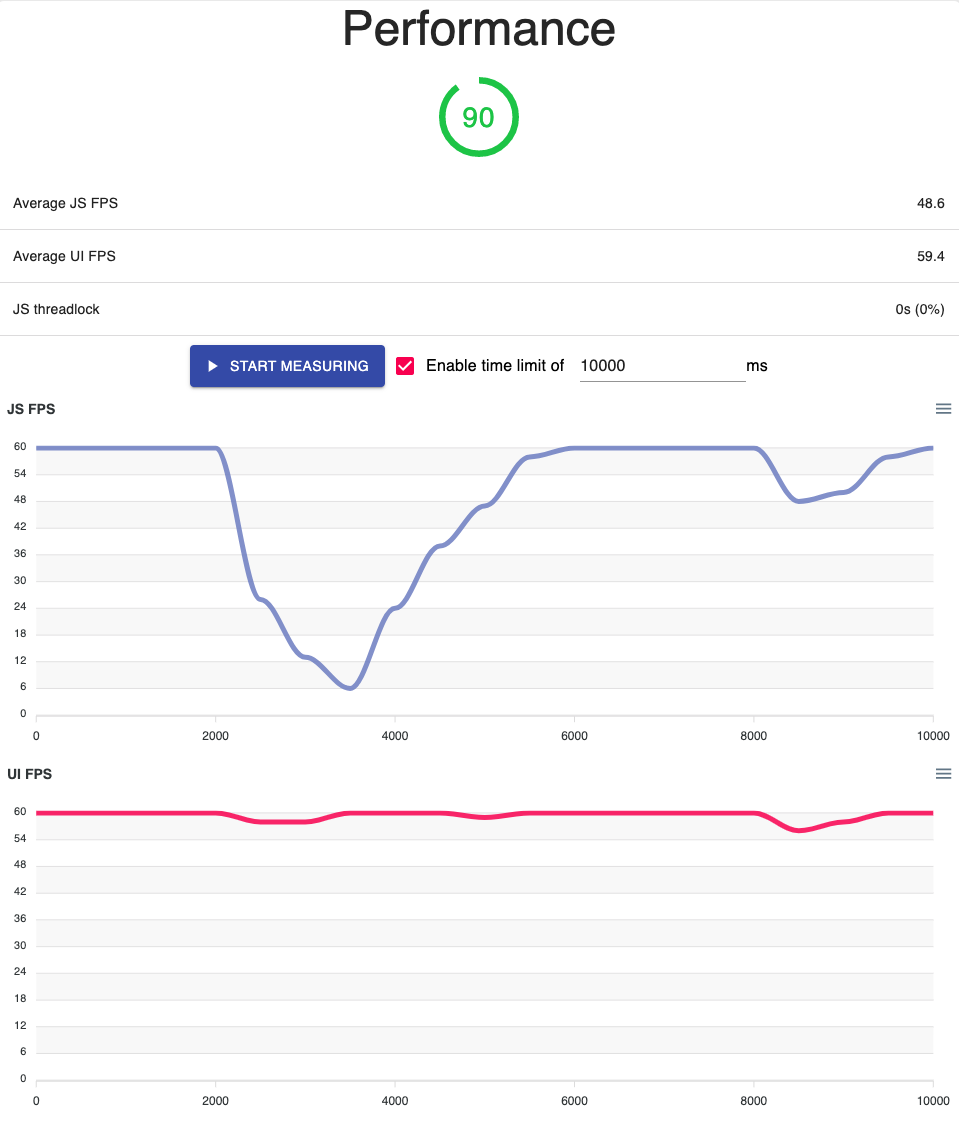
Our goal: 🤩
- Low-end device
- JS FPS > 0
- UI FPS = 60
Following the 4 essential tips:
- Use a Samsung J3 2017
- Setup measures for 10s
- Reload with JS dev mode disabled
- Wait for feed to be loaded
- Hit "Start measuring"
- Wait until the end of 10s
- Reproduce experience 5 times
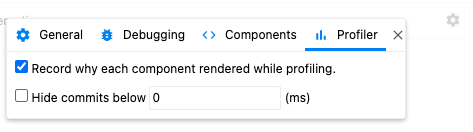
A neat option to activate

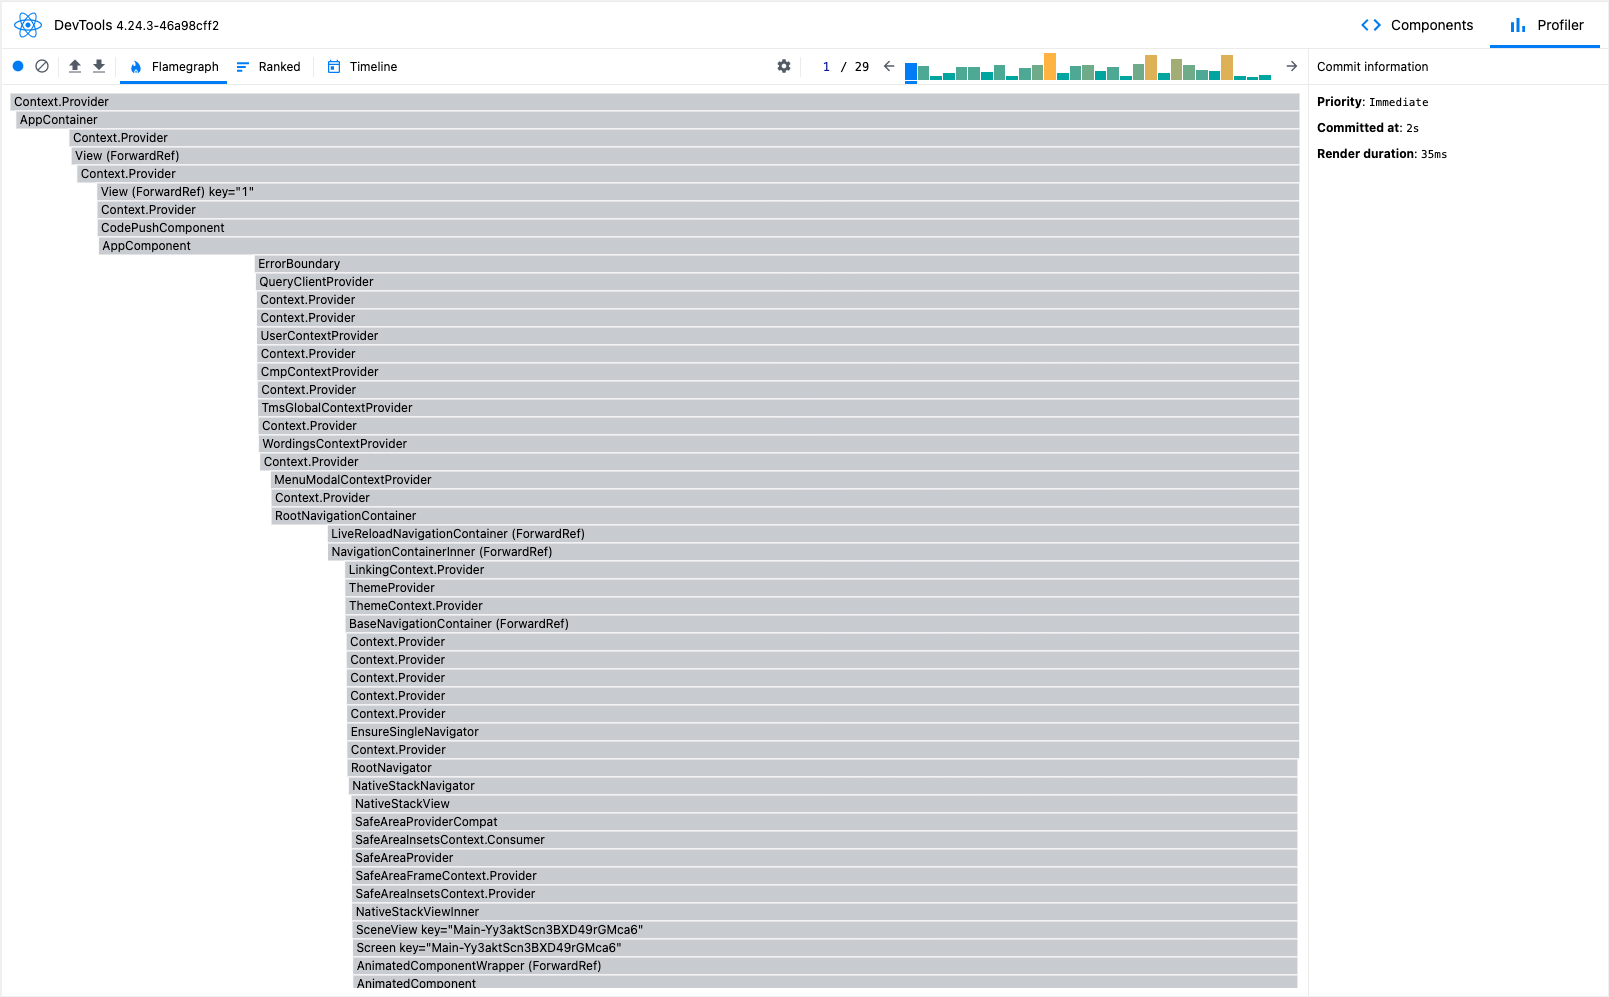
Browsing commits

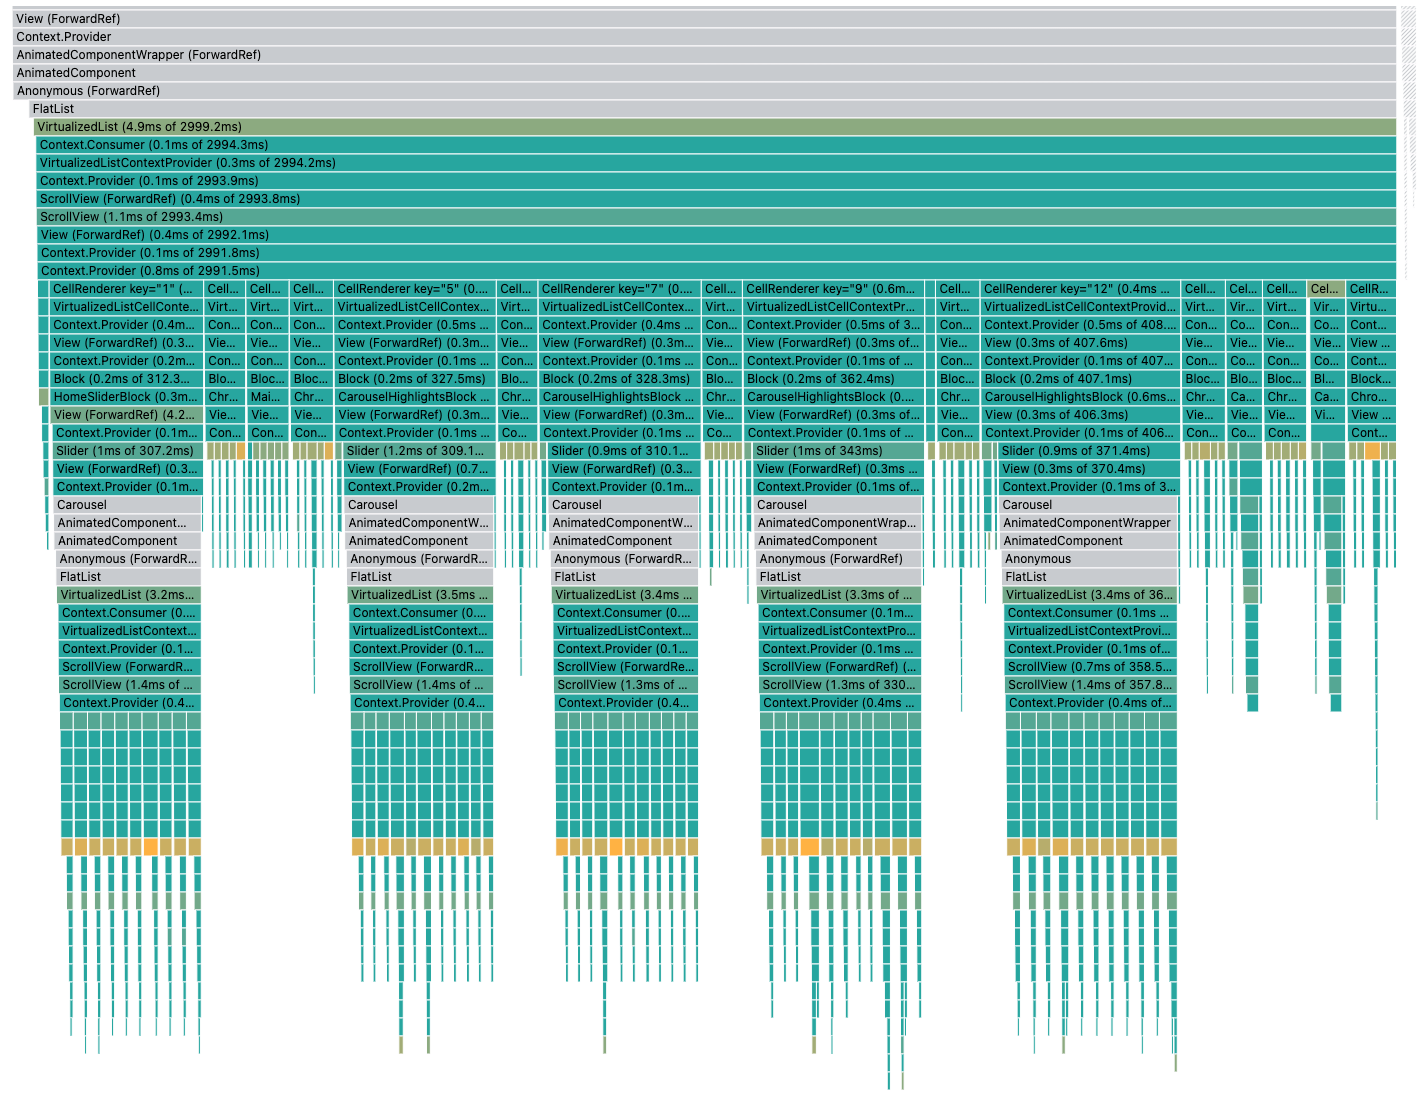
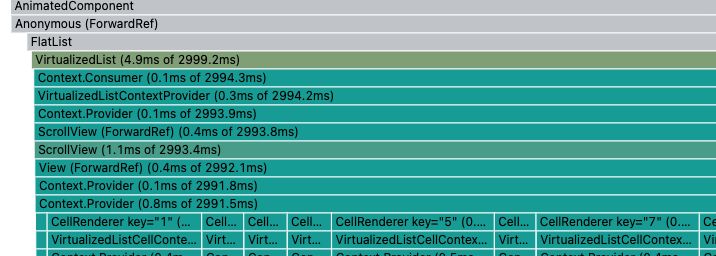
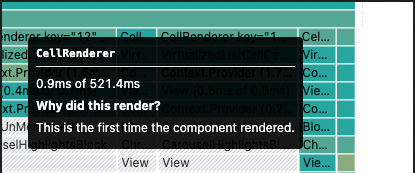
Initial Render
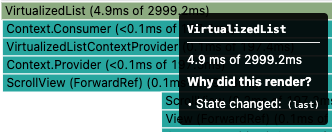
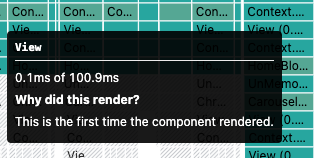
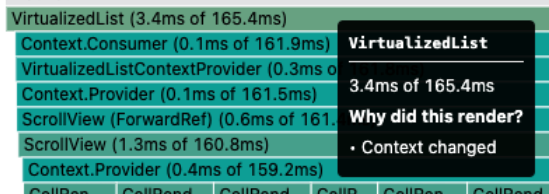
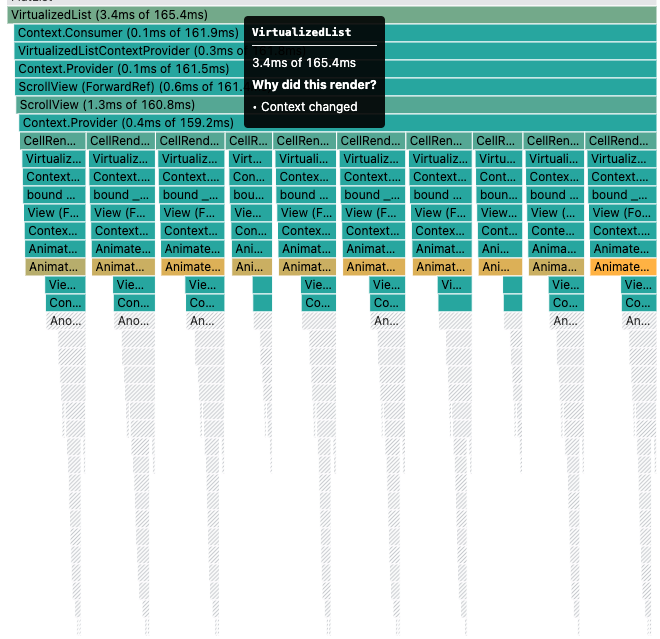
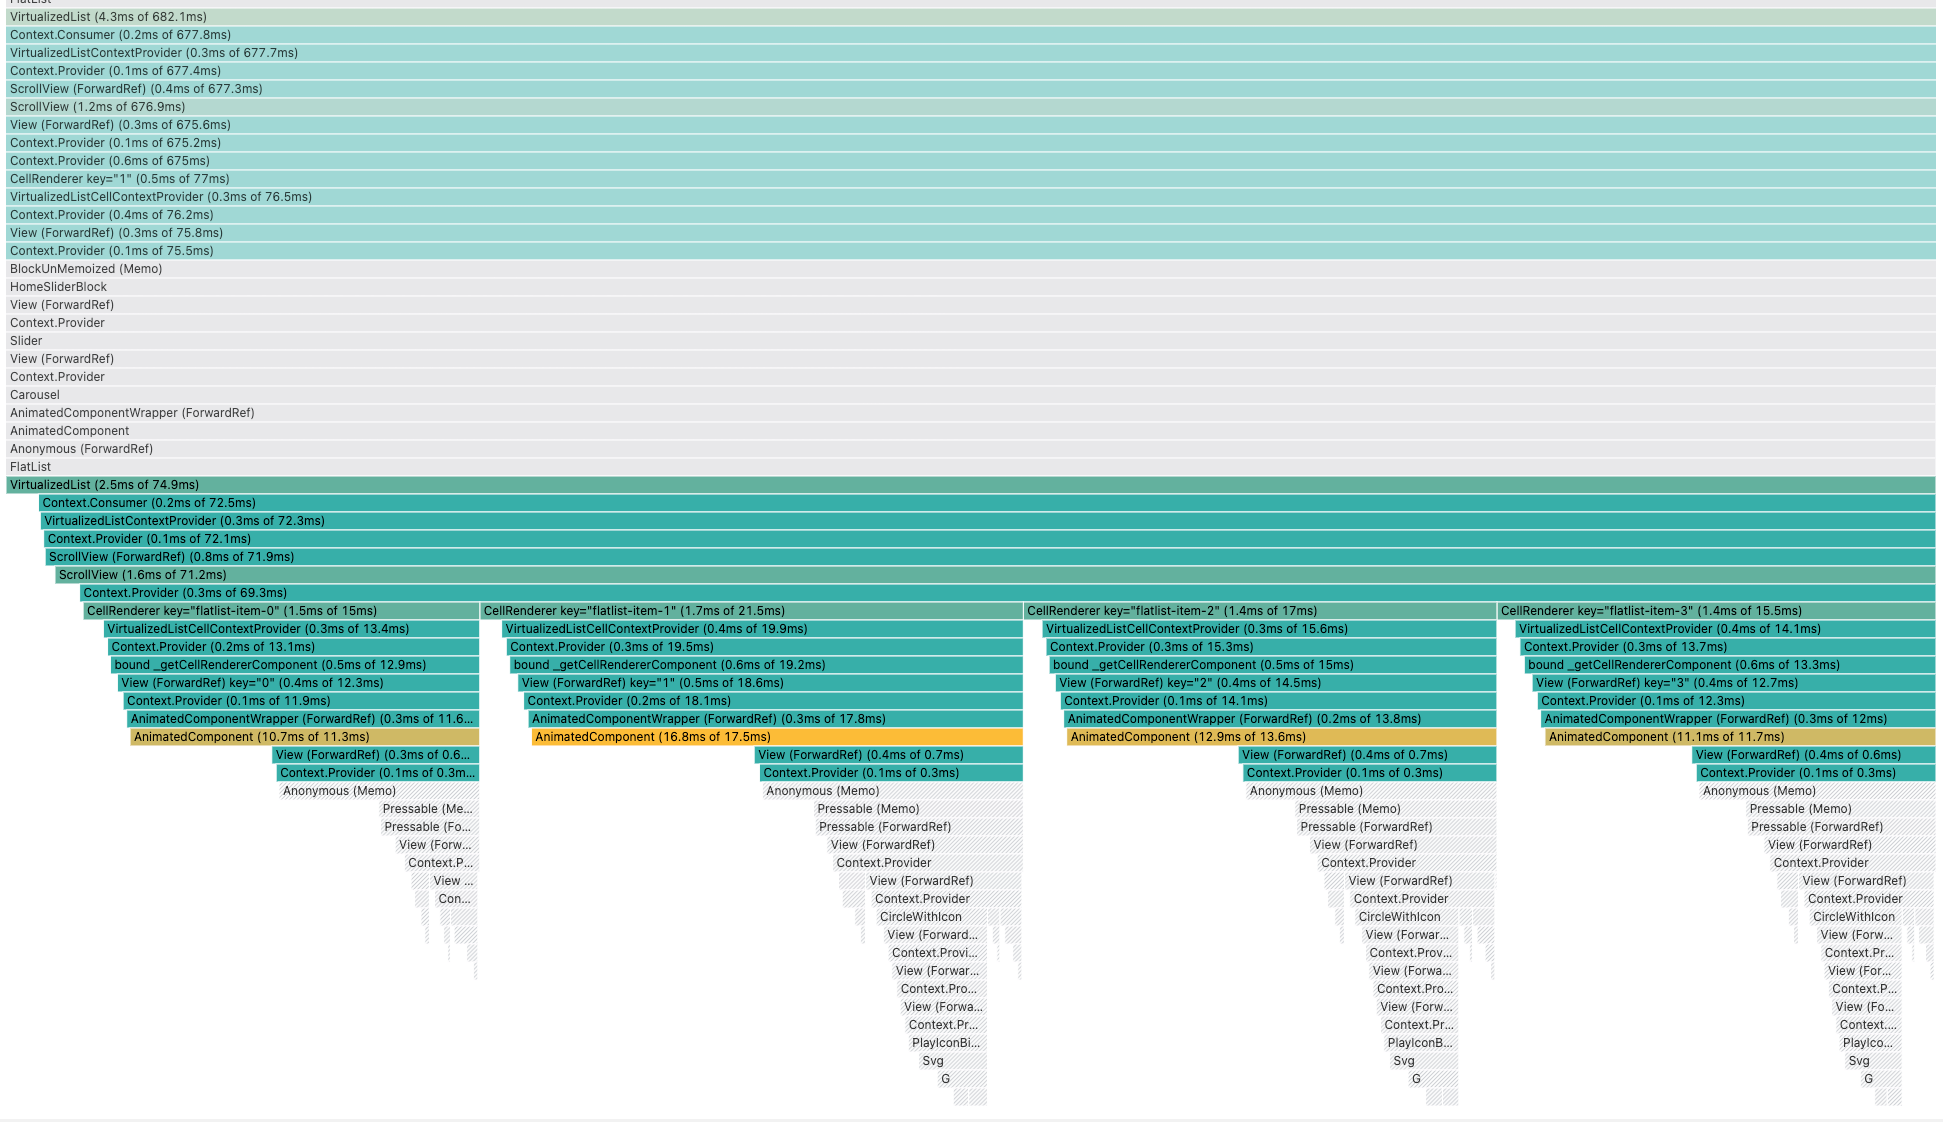
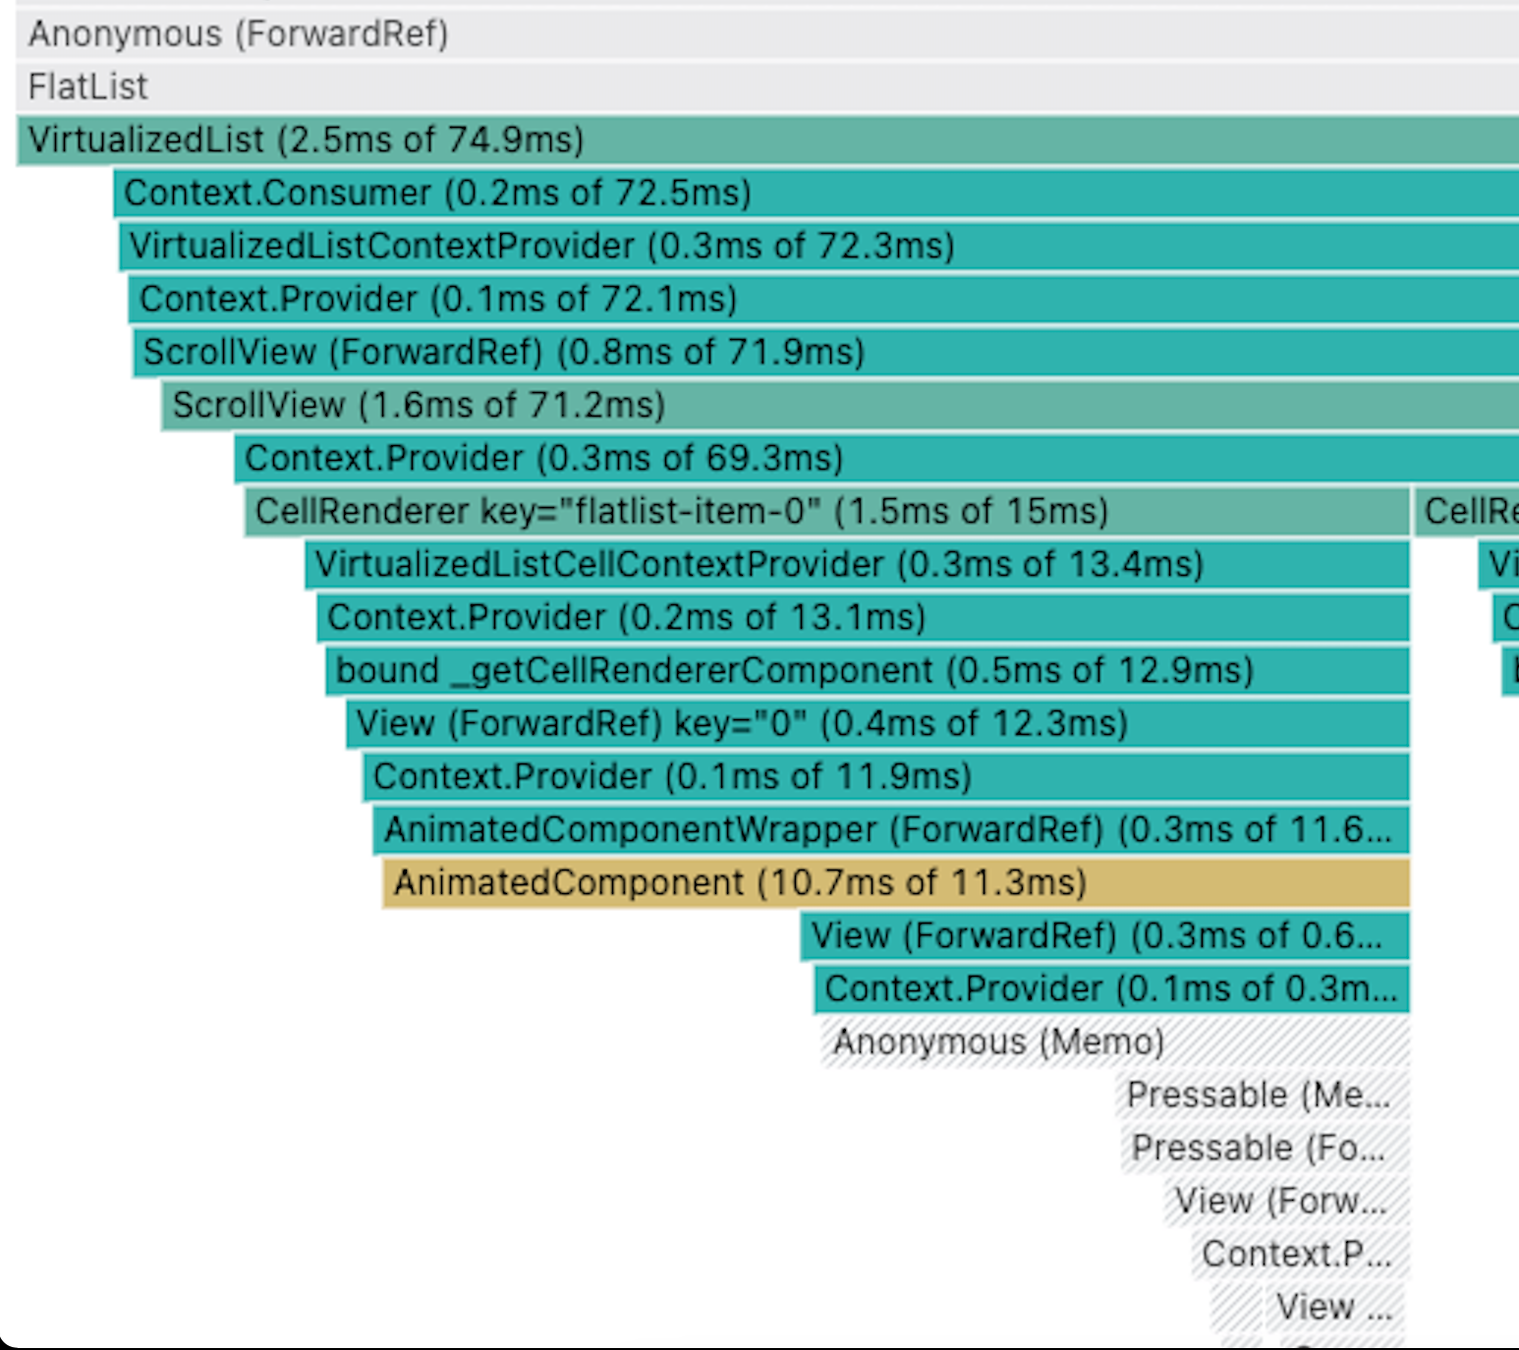
RE-Render
vs
All our list children are RE-rendering
😱
ITERATION 1
Everyone should know this!
NB:
default windowSize
is 21 viewports
type State = {
  first: number,
  last: number,
};
renderItem is called on scroll by design
MEMO your list items
-
📈
-
📉
-
ITERATION 2
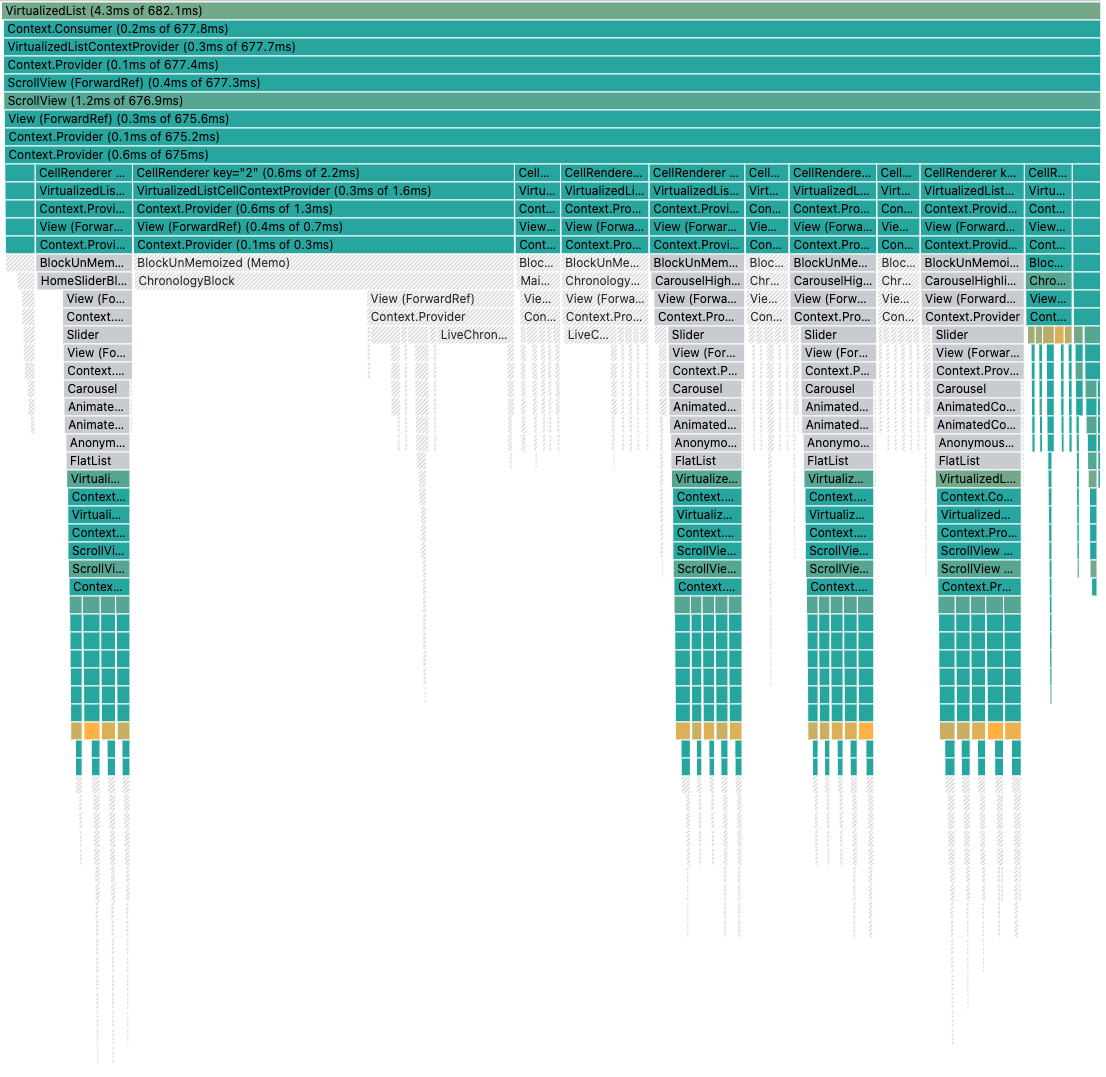
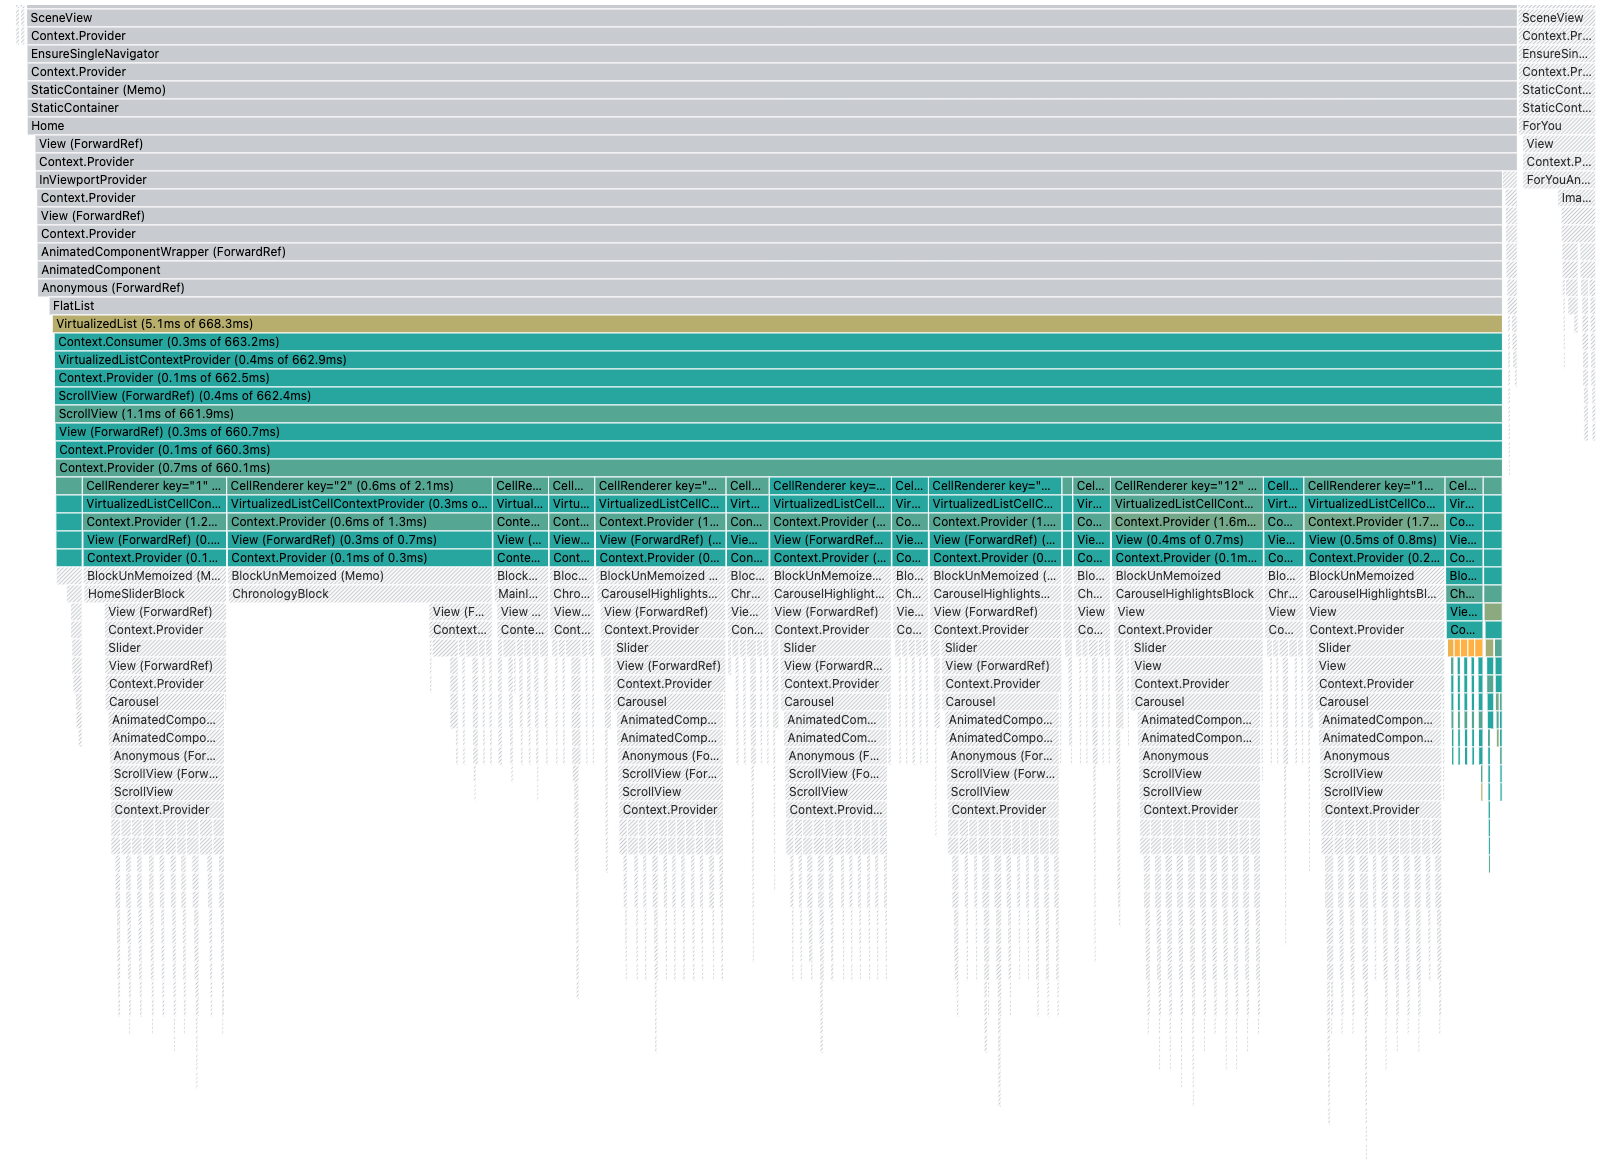
The joy of nested lists 😅

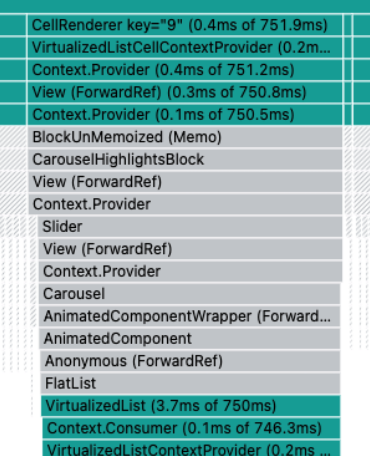

Nested horizontal list renderItem is also called
When we scroll the parent vertical list
ITERATION 3
Reducing carousel
re-render
loop prop adds 3 slides on each side
3 + 4 + 3 = 10 🤓
🥳
ITERATION 4
A non-intuitive fix? 🤔
Text
FlatList code
Memoized Slide
react-native-
snap-carousel
Nesting virtualized lists is TRICKY
YES
Can we avoid it? 🤔
Measure your apps performance
Measure your apps performance
-
Take a low end Android device
-
Find areas with 0 JS FPS / < 60 UI FPS
- Analyze and fix them
- Check your score improvement 🥳
What's next?
- Automate measures
-
Add new metrics (TTI, ...)
-
Measure production apps
- Hopefully Lighthouse for mobile apps 🤞
Performance issues: the usual suspects
By Alexandre Moureaux


