Data visualization in Data Science: theory and practice
Andrey Lukyanenko
Senior DS @ Careem

Content
- What is data visualization and why is it useful?
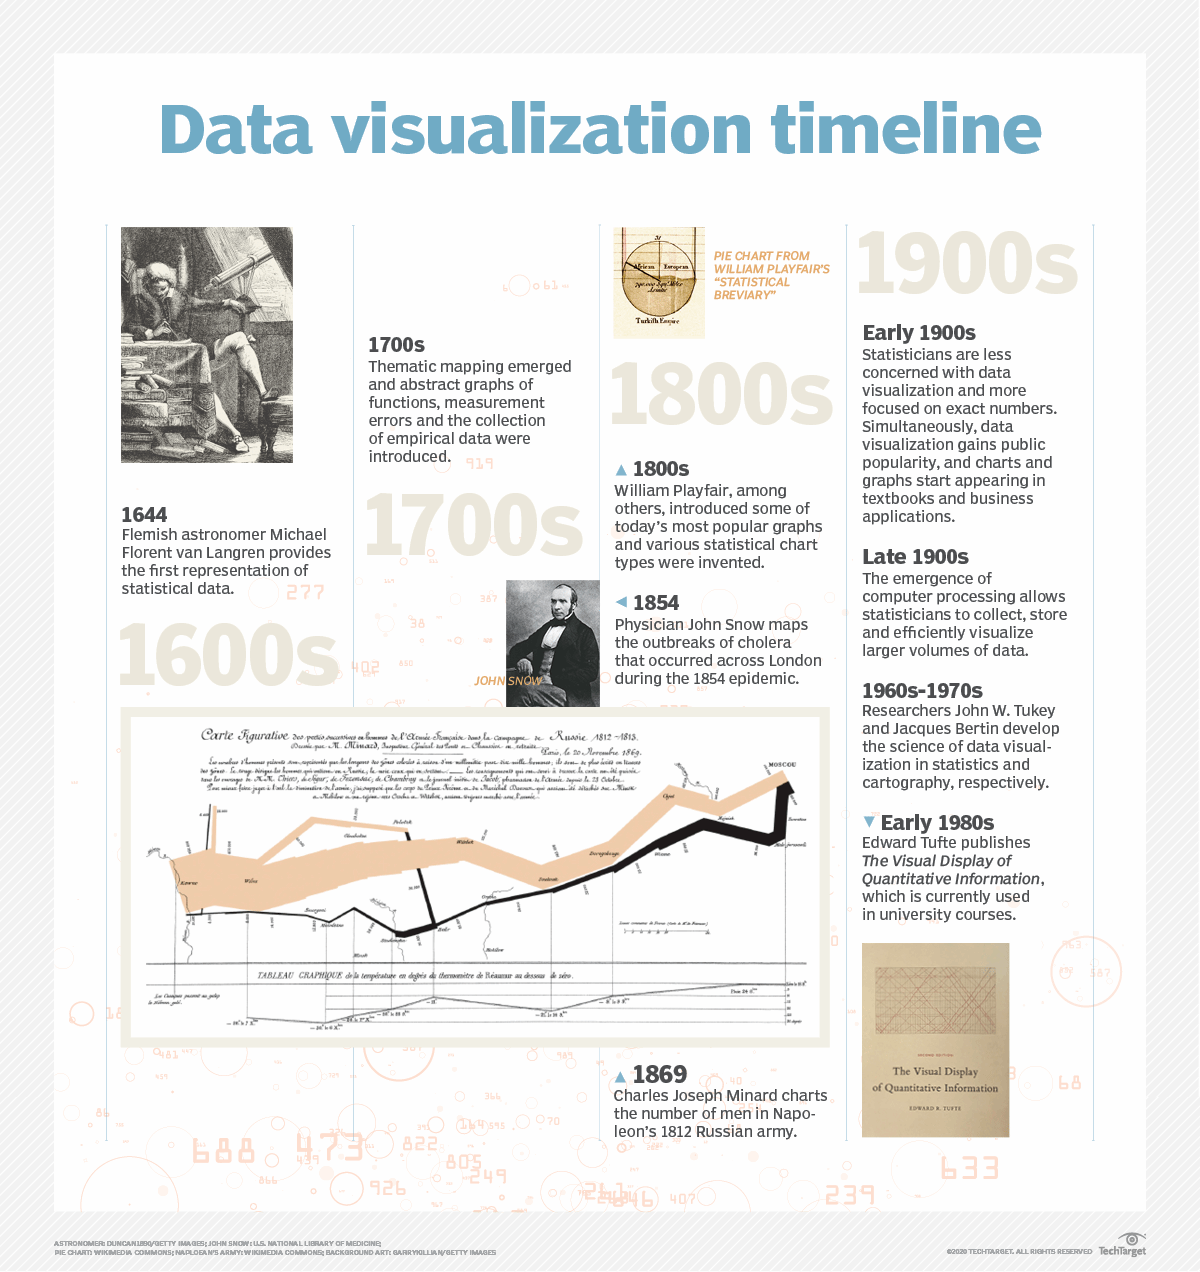
- Classics of data visualization
- Common software for making the plots
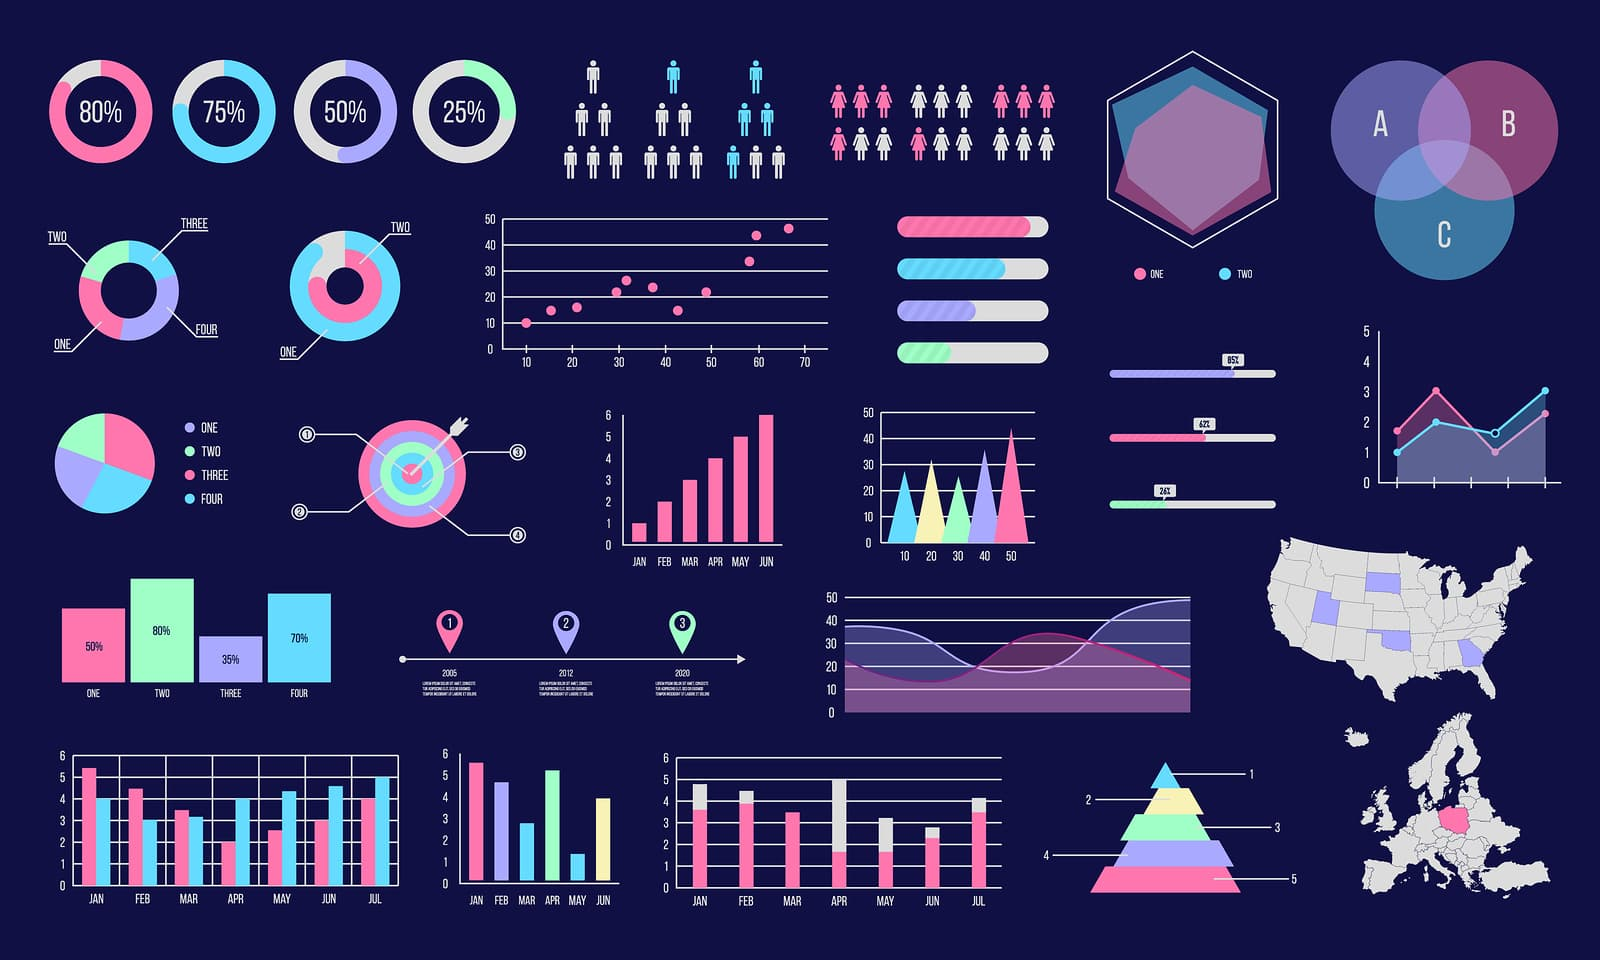
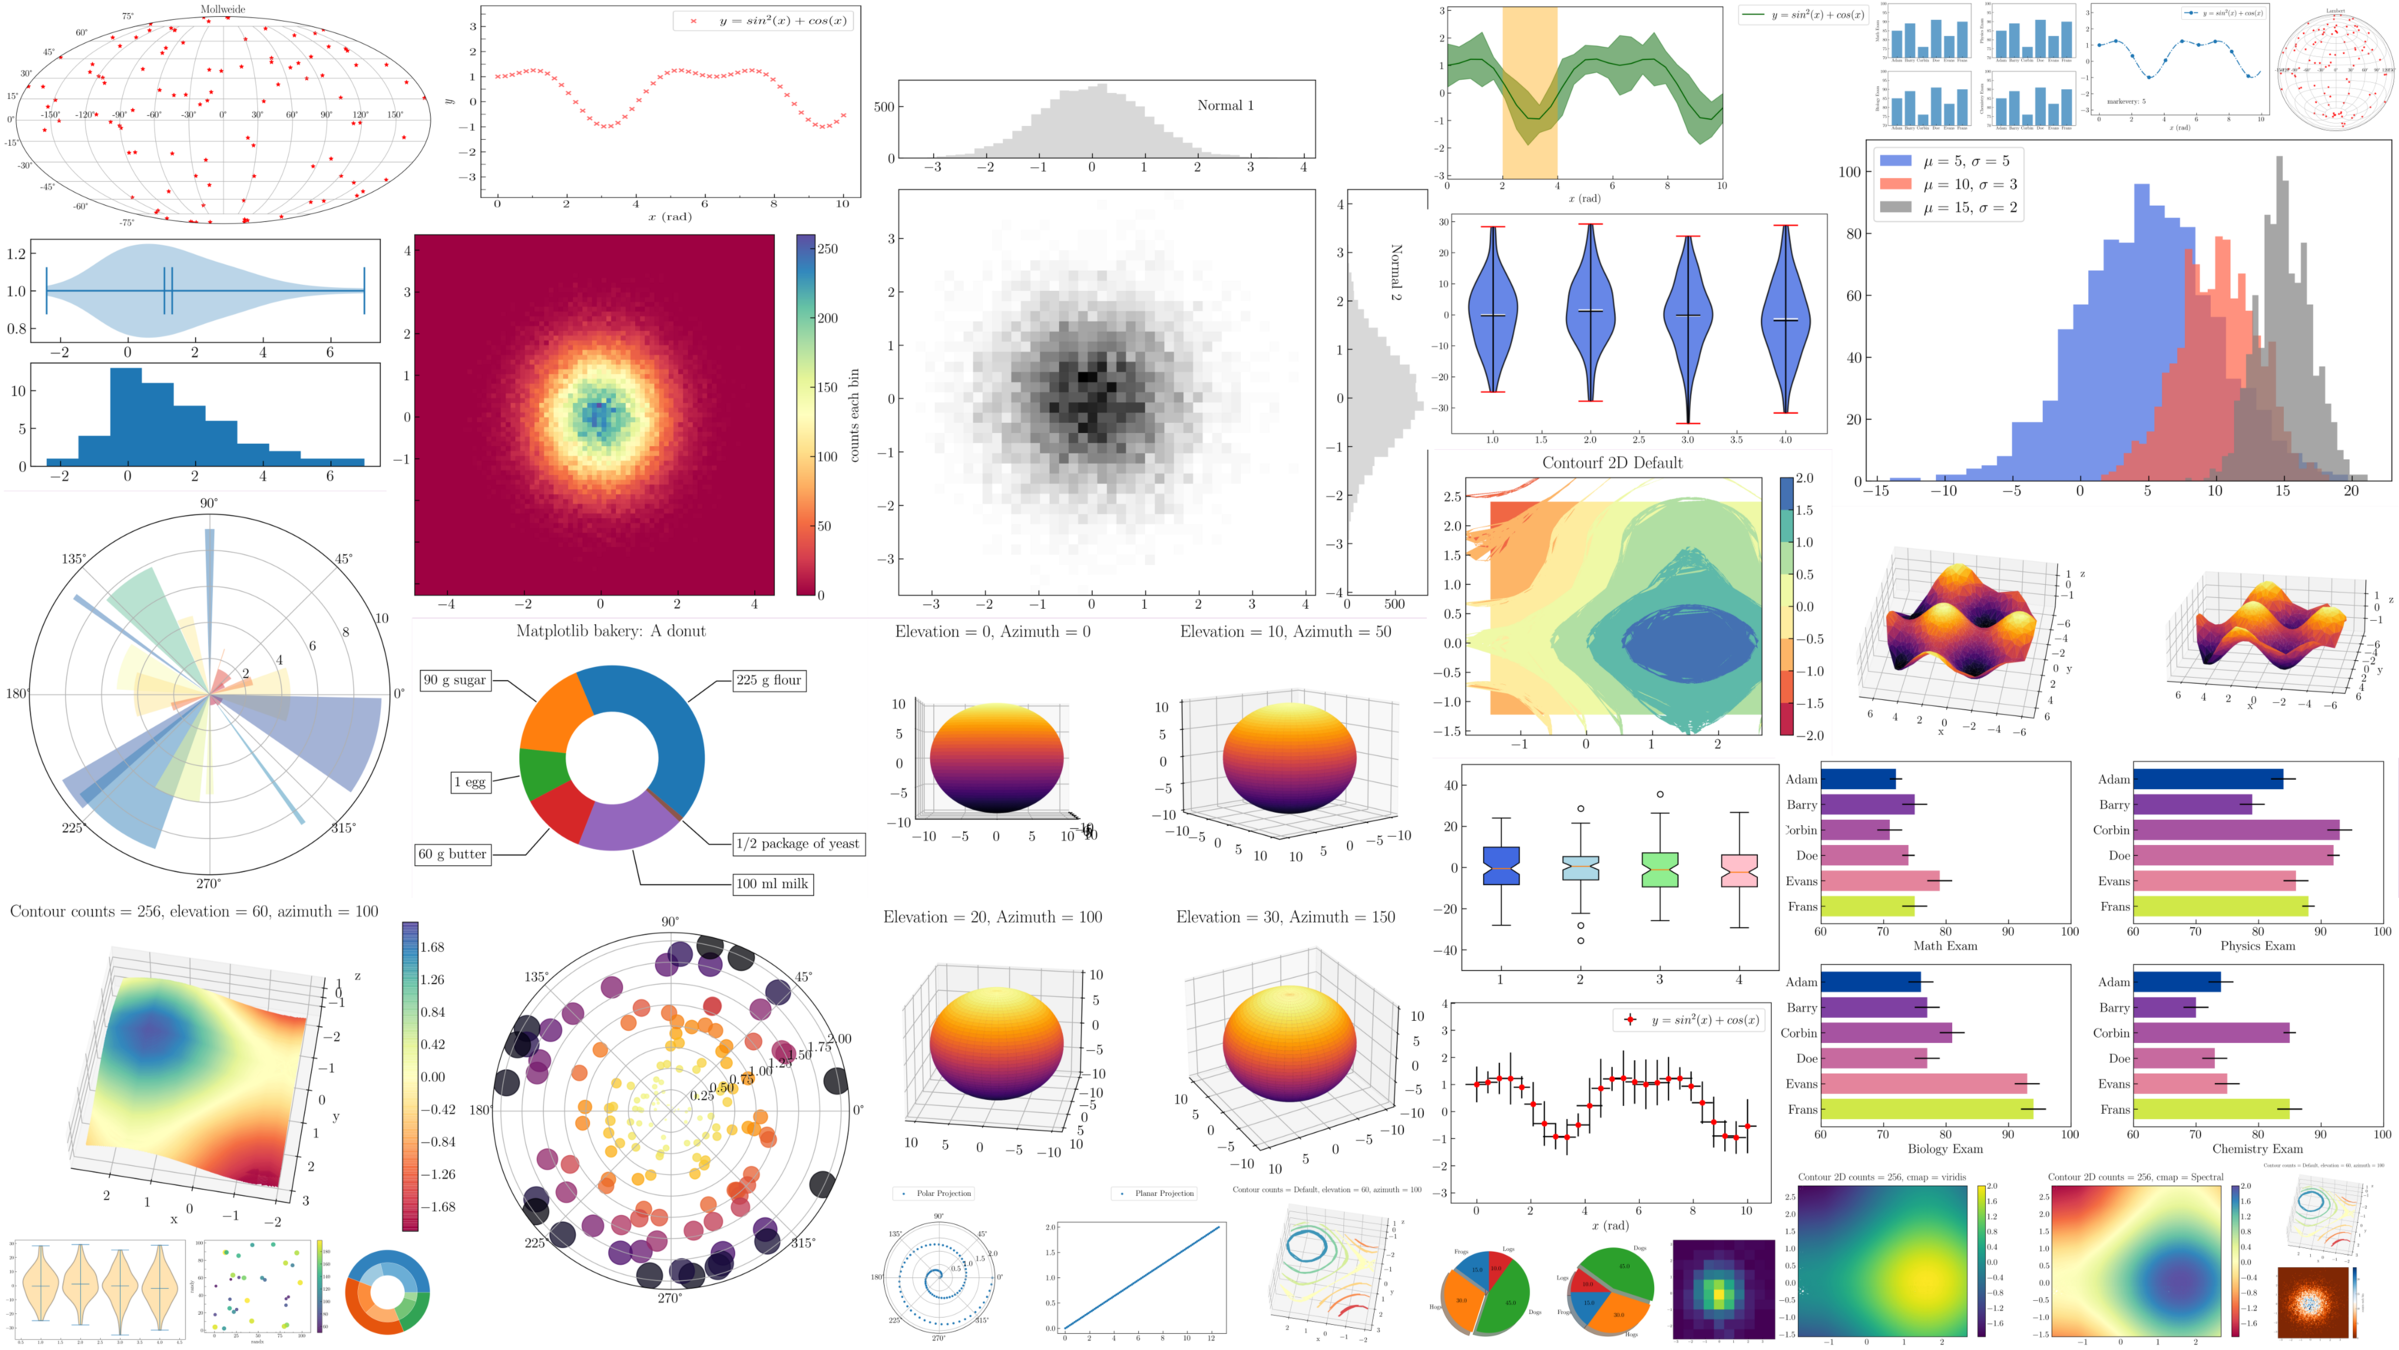
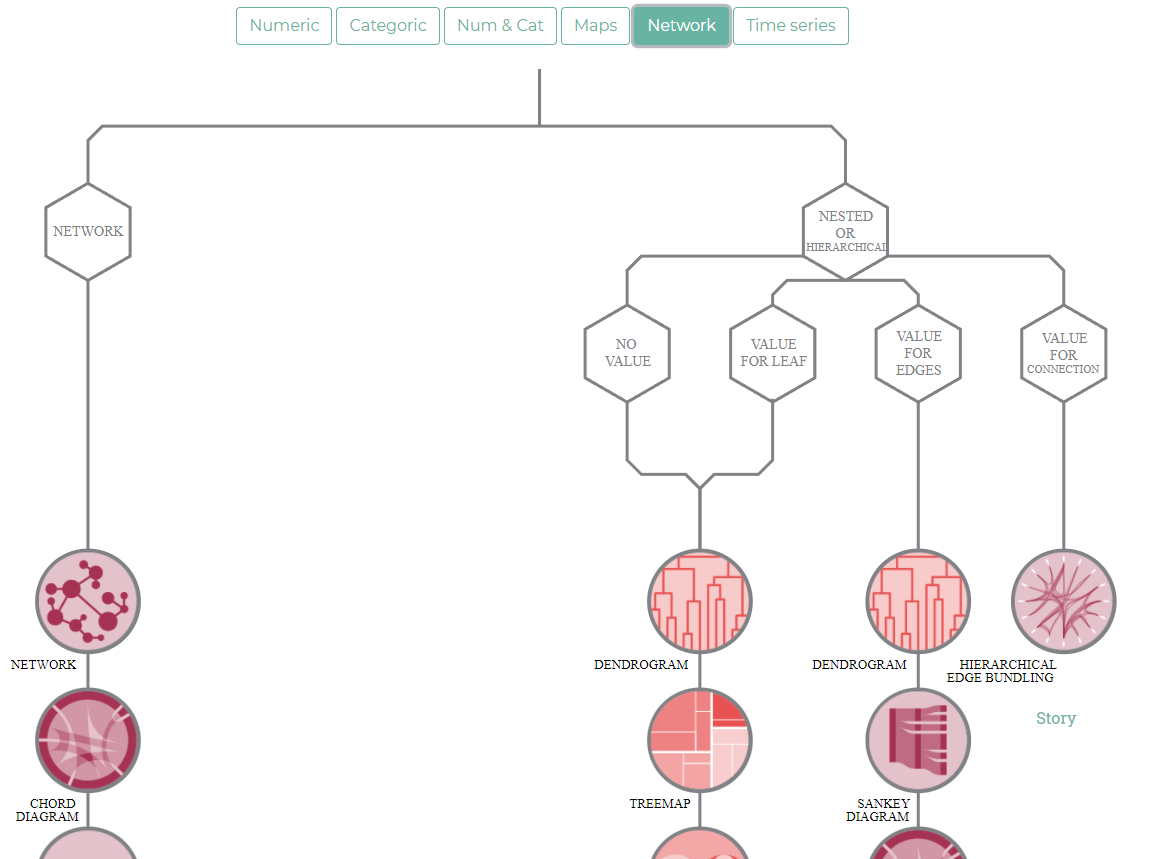
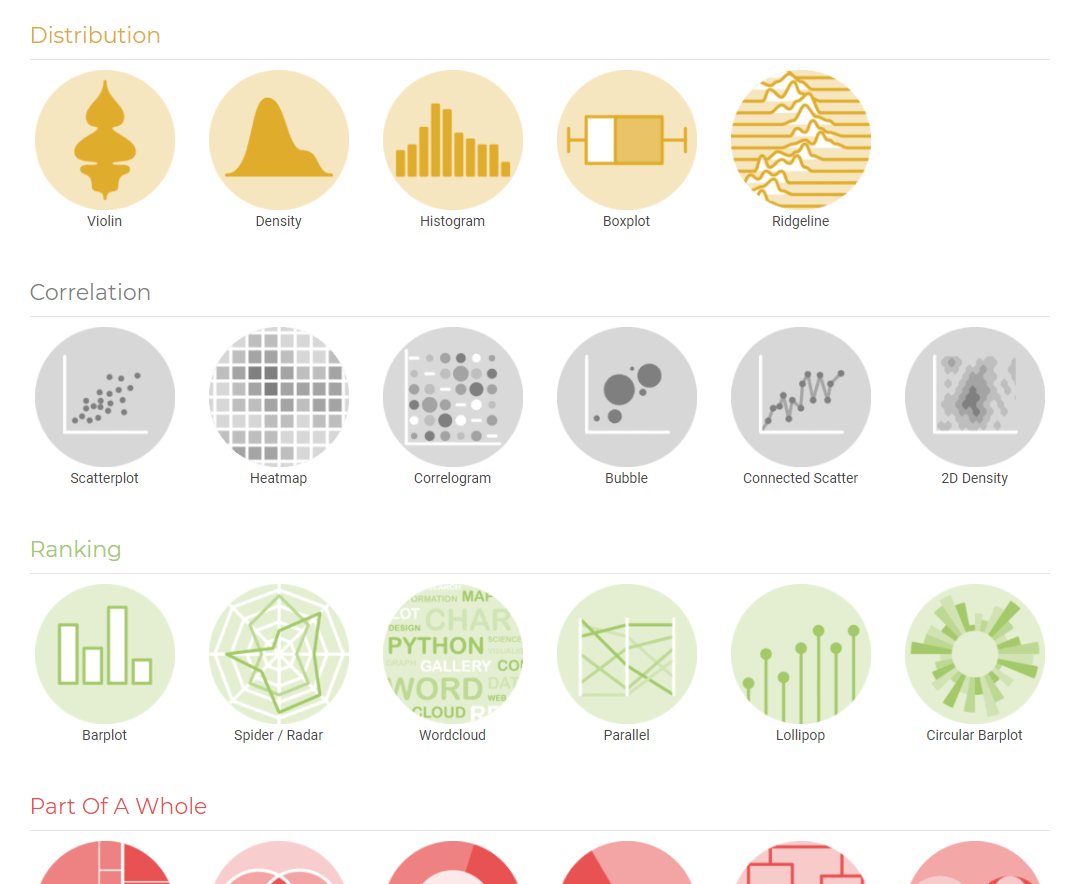
- Chart types
- Skills for professional-level visualizations
- What should and shouldn't you do
- Data Visualization for Machine Learning
Why visualizations are important
Why visualizations are important

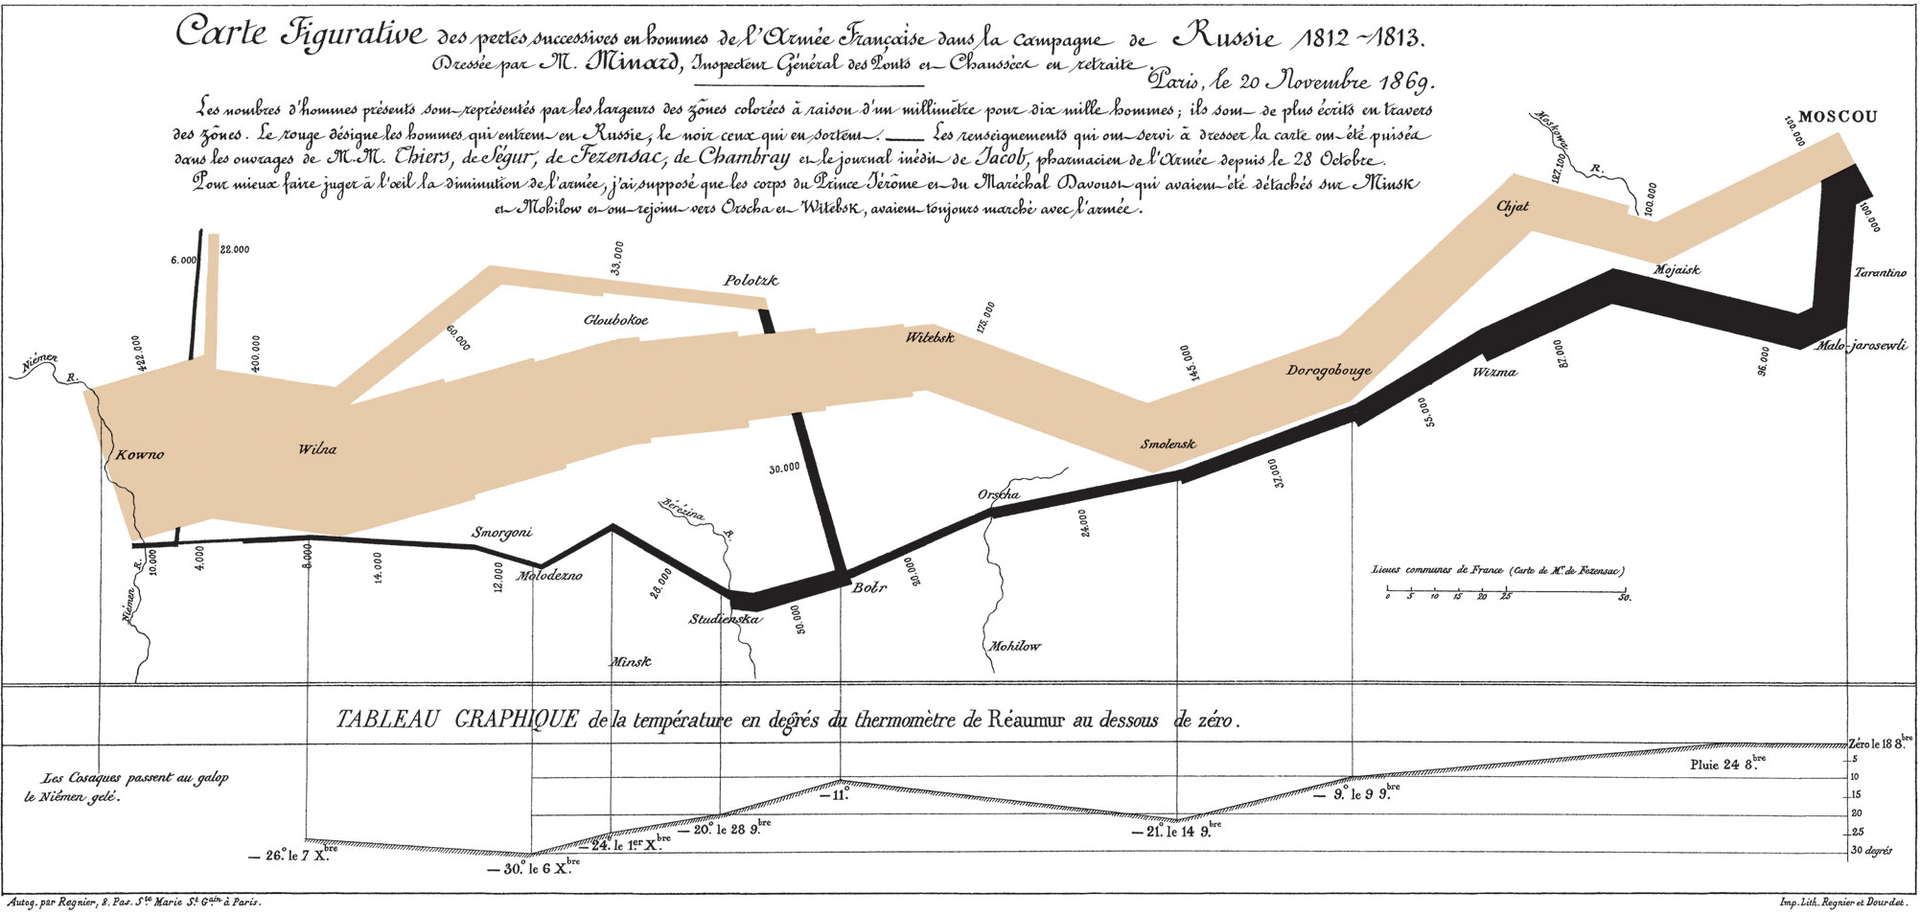
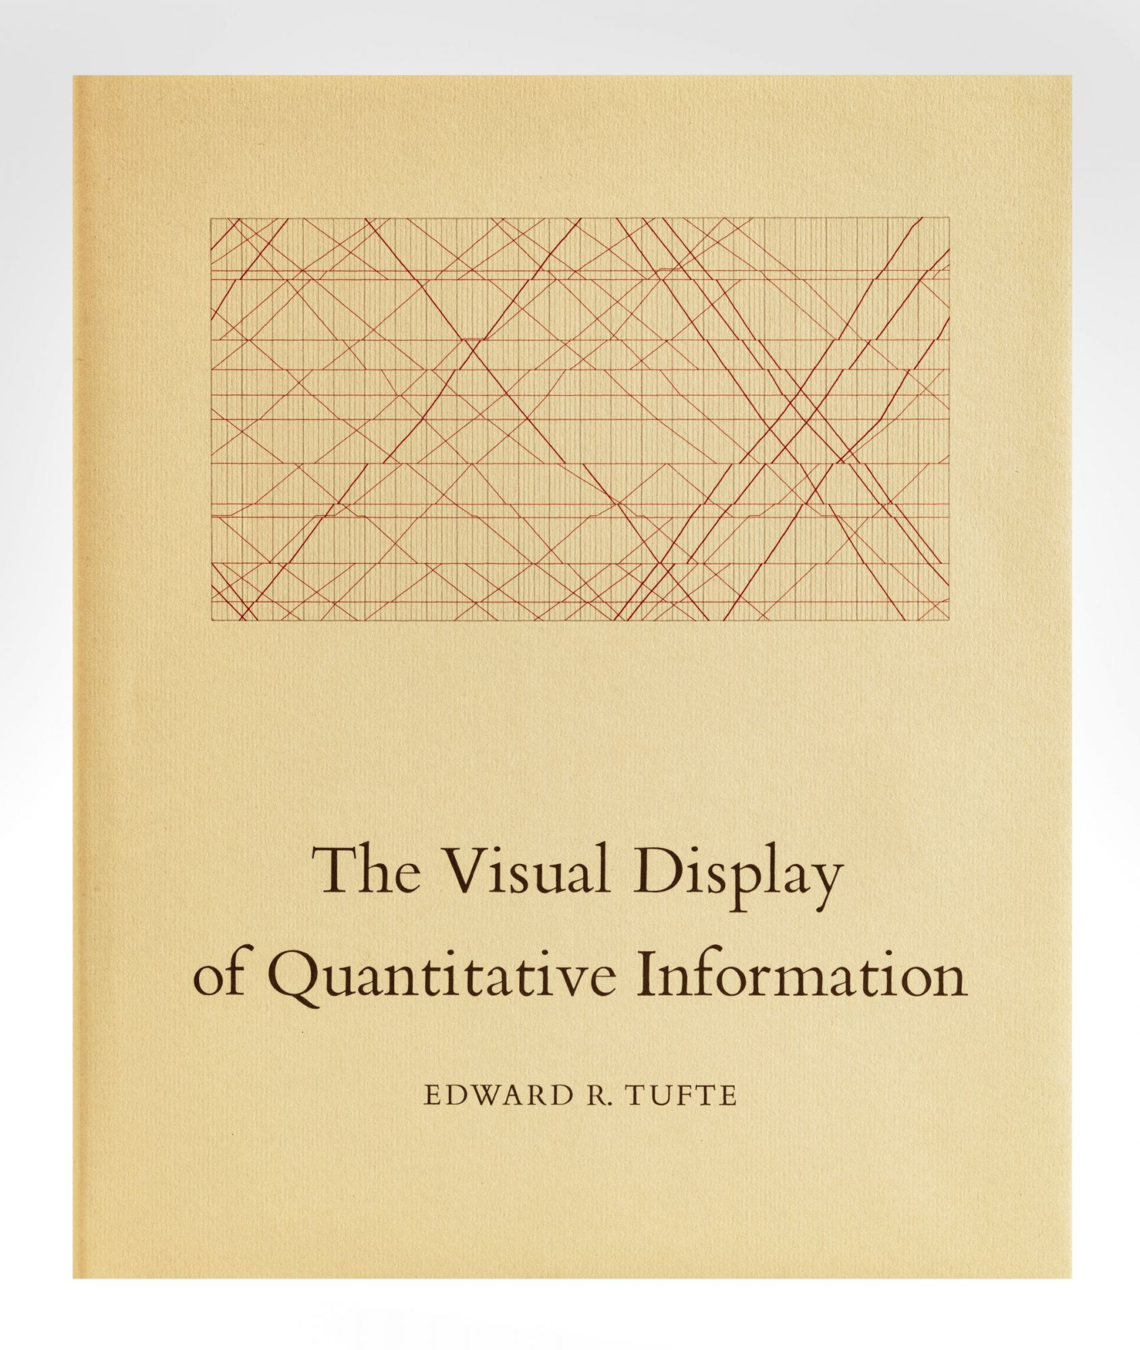
Tufte
- Maximize data ink-ratio
- Minimize lie factor
- Minimize chartjunk
- Use proper scales and clear labeling
Python. Matplotlib
Python. Plotly
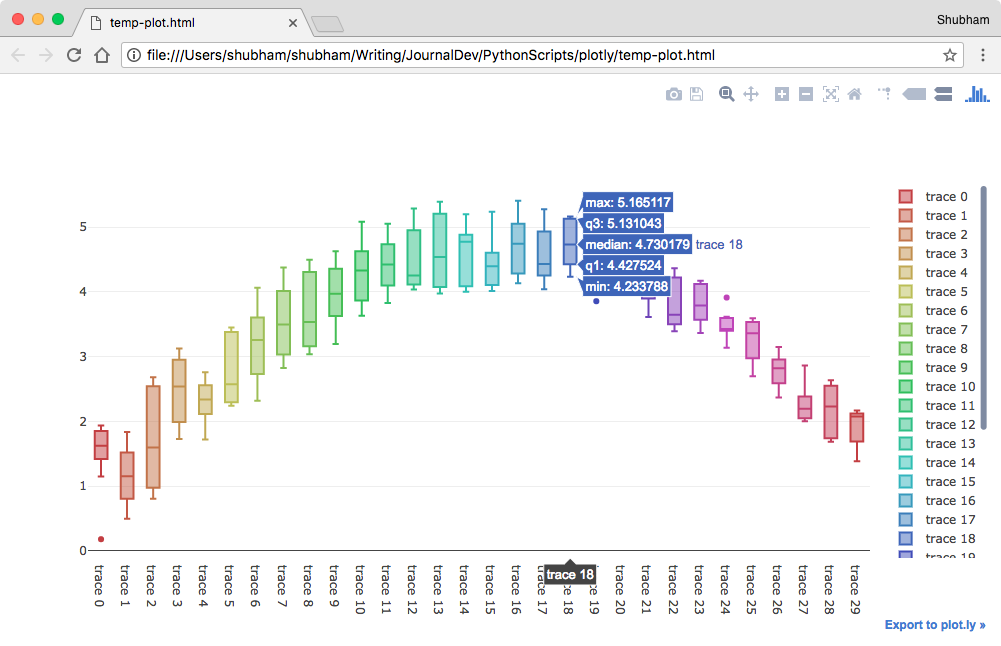
import plotly.graph_objects as go

import pandas as pd
from datetime import datetime

df = pd.read_csv('https://raw.githubusercontent.com/plotly/datasets/master/finance-charts-apple.csv')

fig = go.Figure(data=[go.Candlestick(x=df['Date'],
                open=df['AAPL.Open'],
                high=df['AAPL.High'],
                low=df['AAPL.Low'],
                close=df['AAPL.Close'])])

fig.show()
Python. Altair
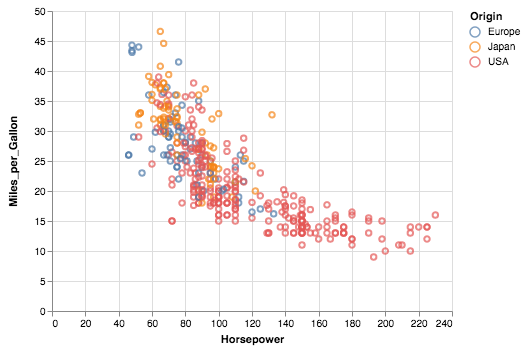
import altair as alt
from vega_datasets import data

source = data.cars()

alt.Chart(source).mark_circle(size=60).encode(
    x='Horsepower',
    y='Miles_per_Gallon',
    color='Origin',
    tooltip=['Name', 'Origin', 'Horsepower', 'Miles_per_Gallon']
).interactive()
R
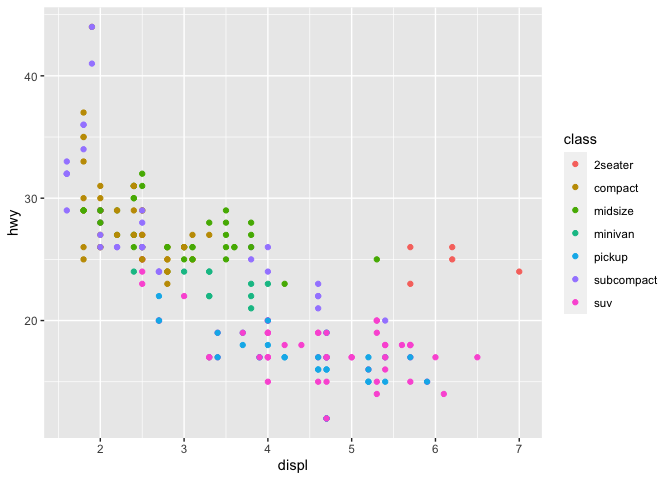
library(ggplot2)

ggplot(mpg, aes(displ, hwy, colour = class)) +
  geom_point()
Tableau
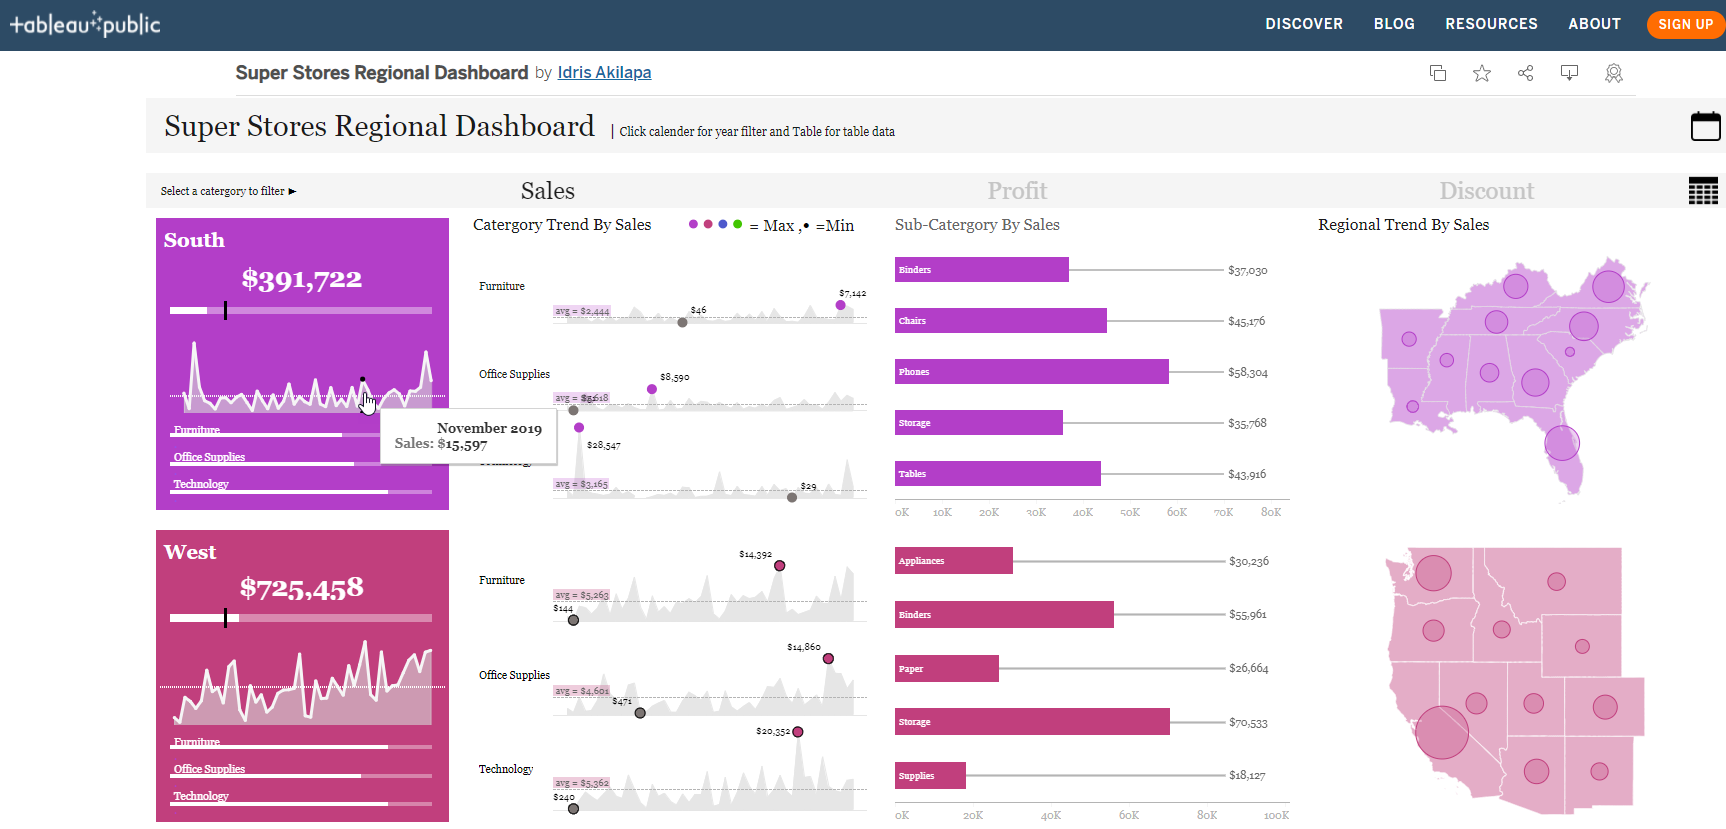
D3.js
Skills
- Data visualization
- Graphical design, interface design, UX
- Storytelling
- Color: Hue, Value/Lightness, Saturation/Chroma, RGB vs CMYK
- Accessibility
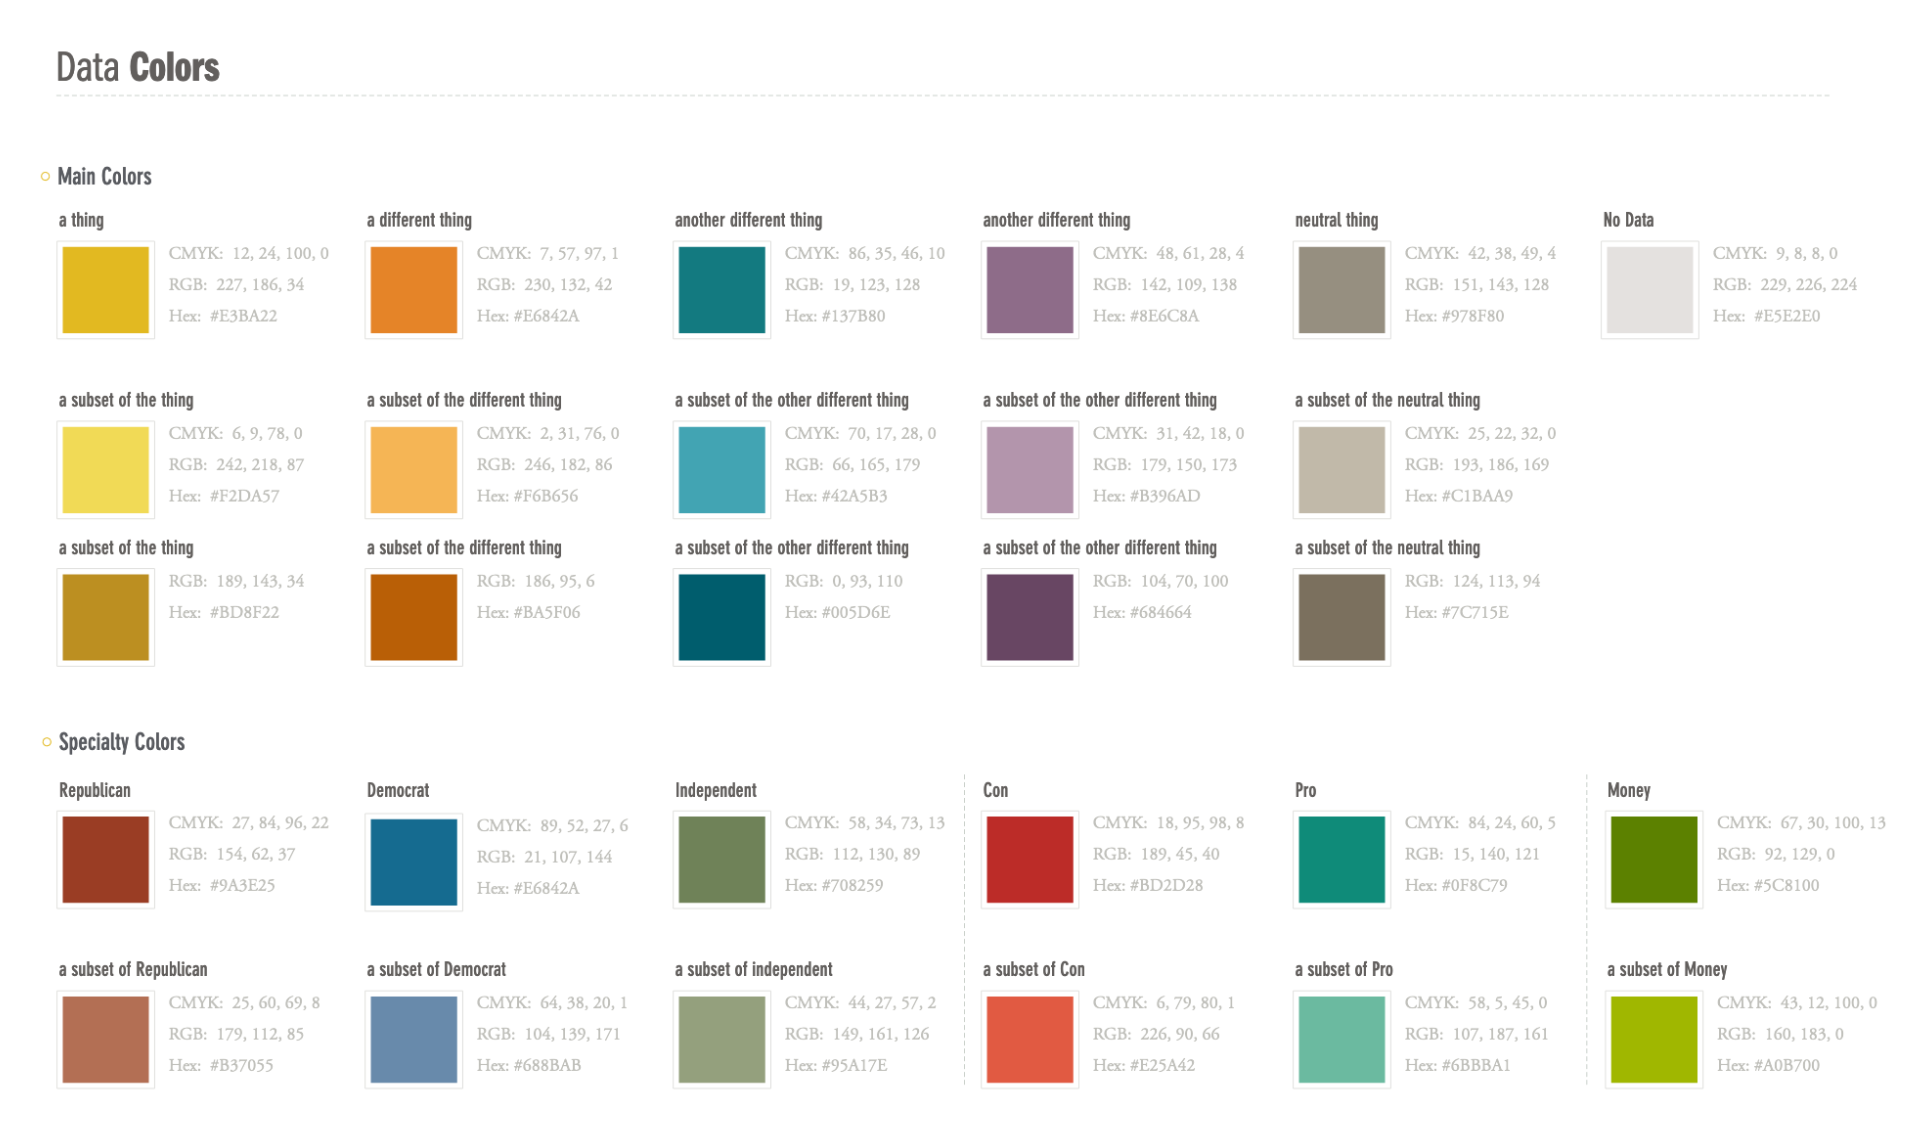
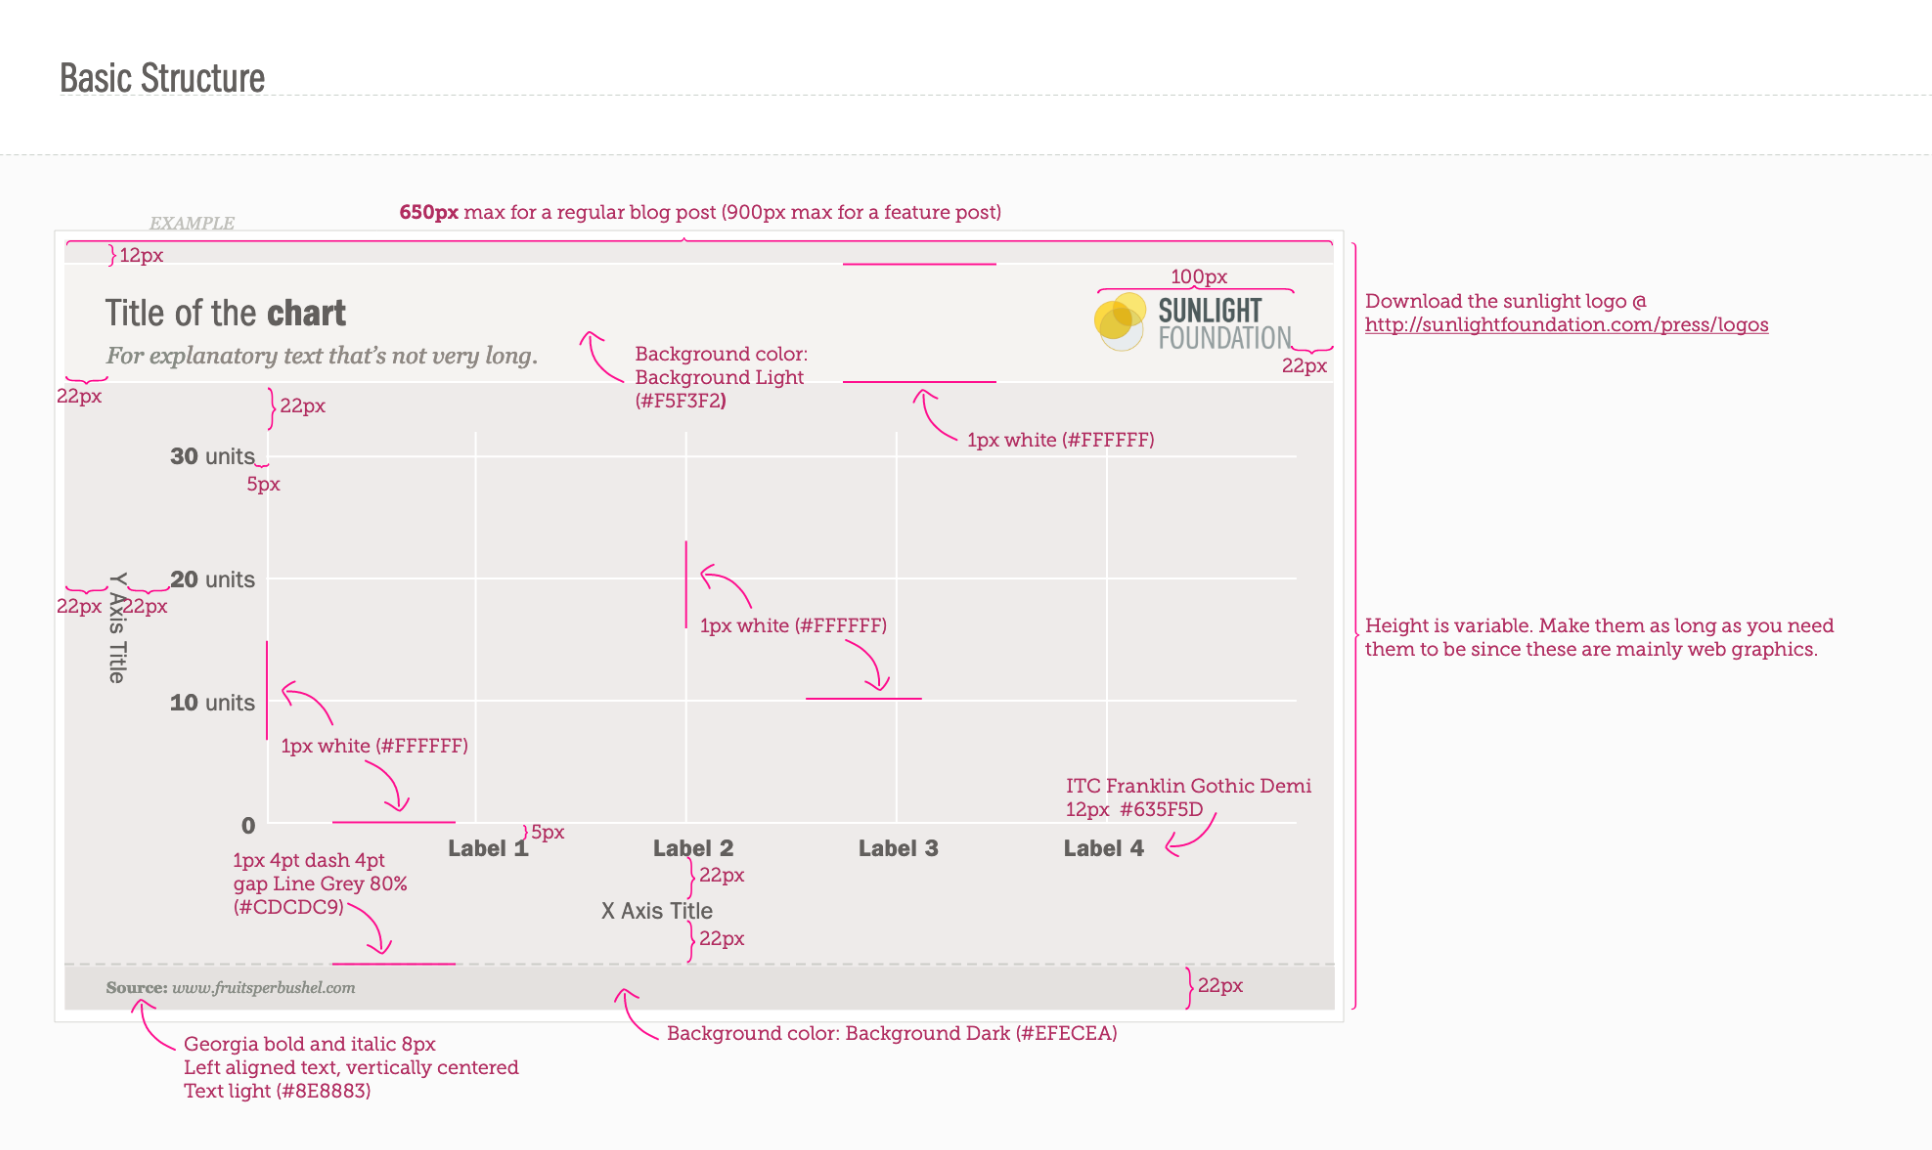
- Style guide
Style guide
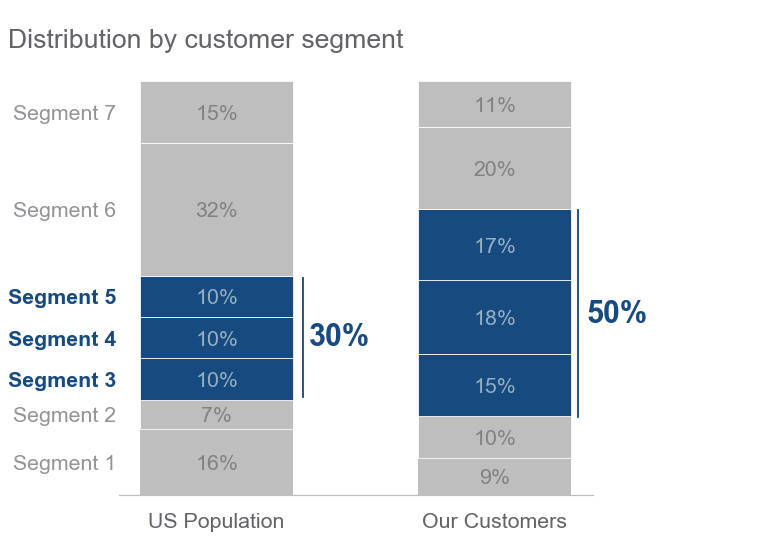
Improvements
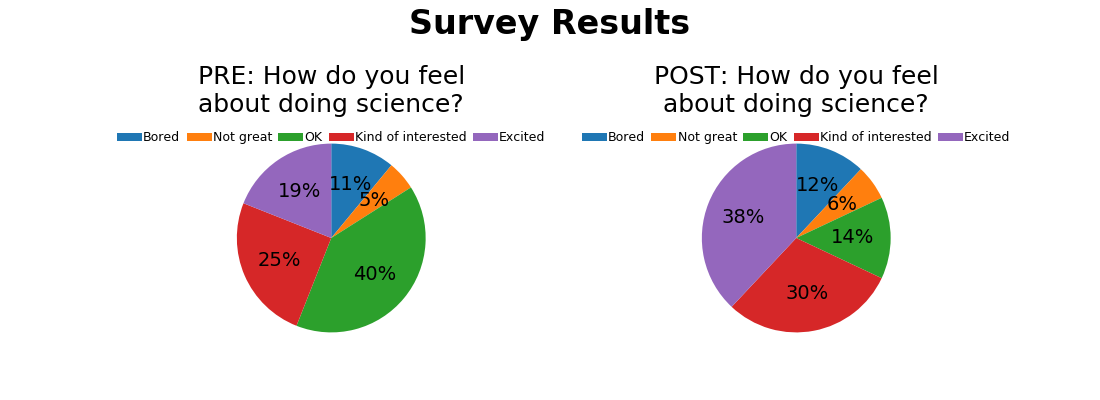
Improvements
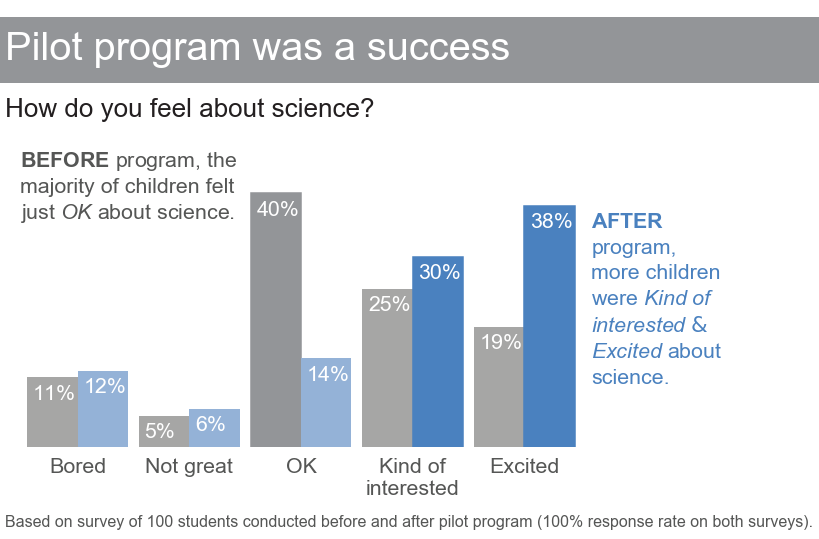
Improvements
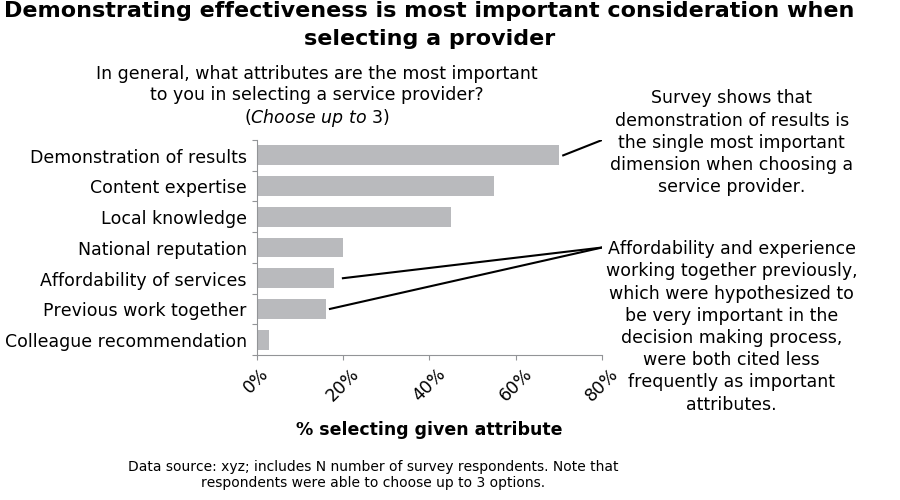
Improvements
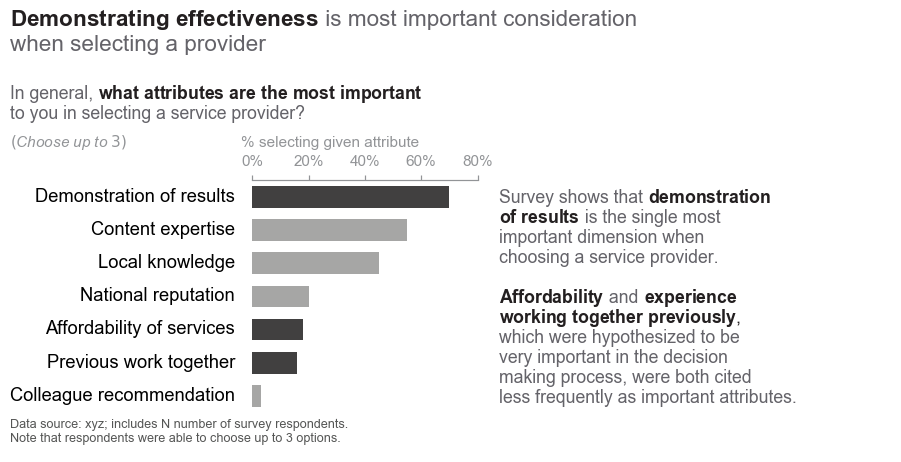
Improvements
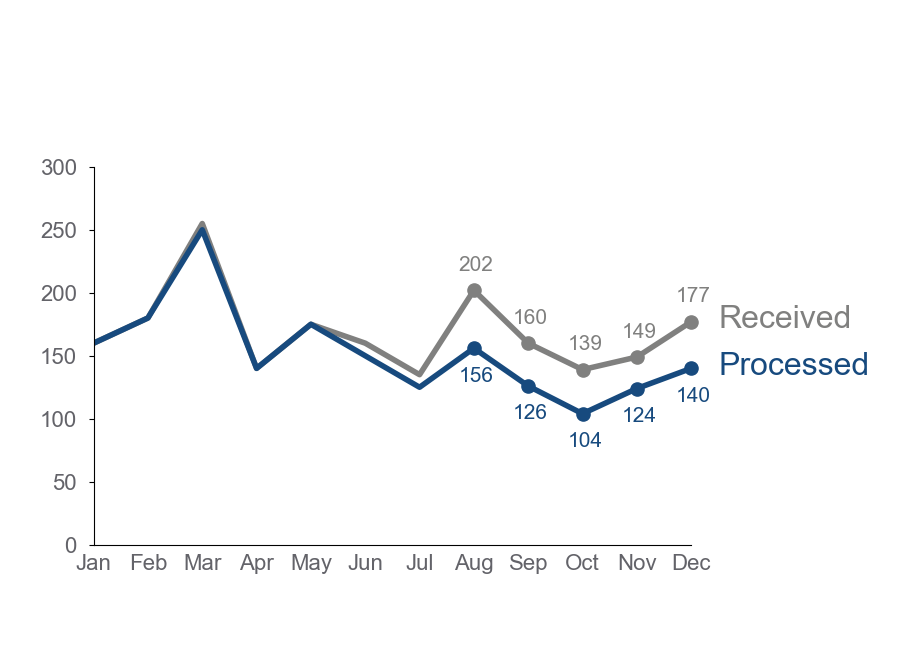
Improvements
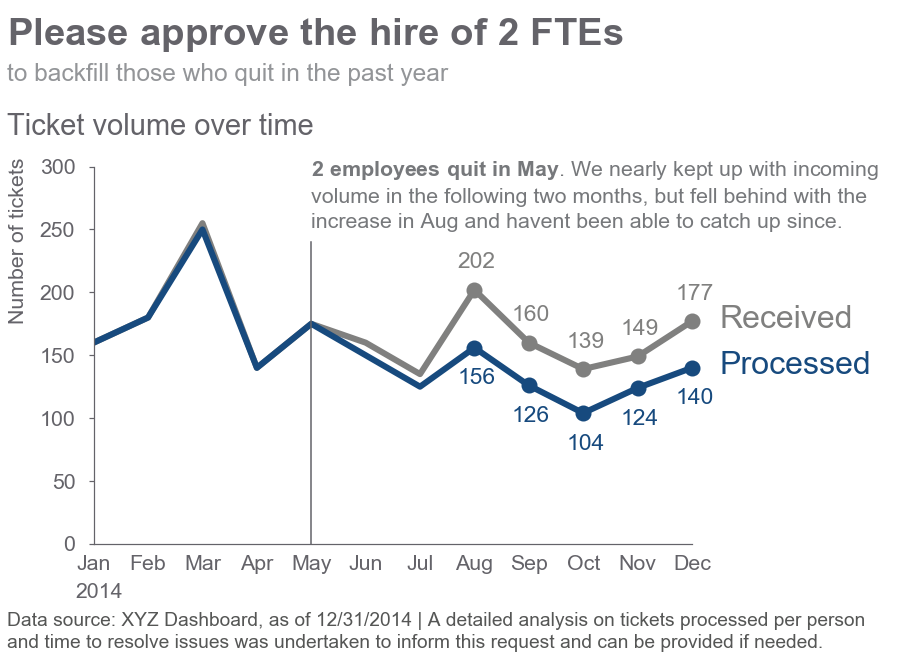
Improvements
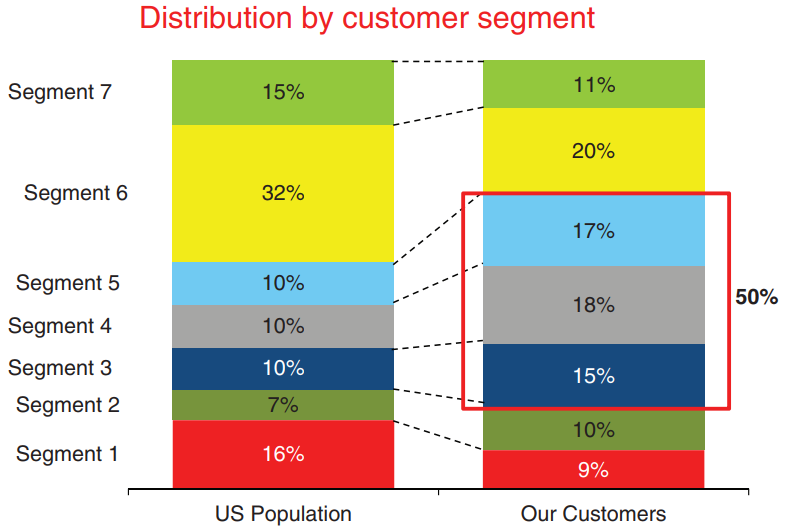
Improvements
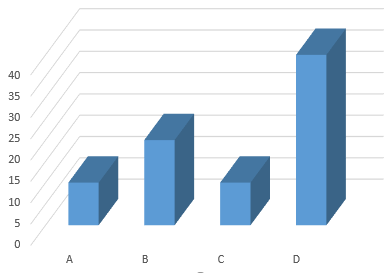
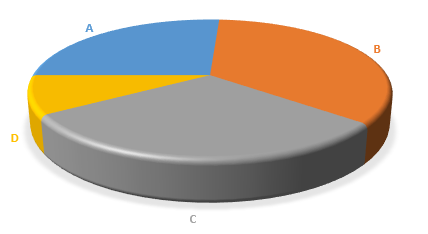
- Exploratory vs explanatory, показать то, что важно
- Pie, 3D
Good examples
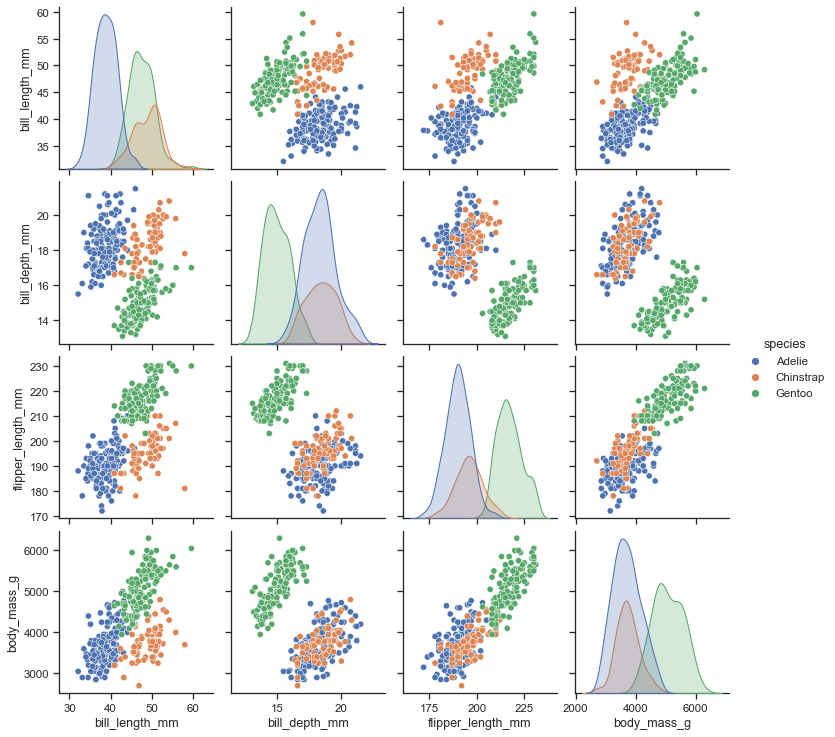
import seaborn as sns
penguins = sns.load_dataset("penguins")
sns.pairplot(penguins, hue="species")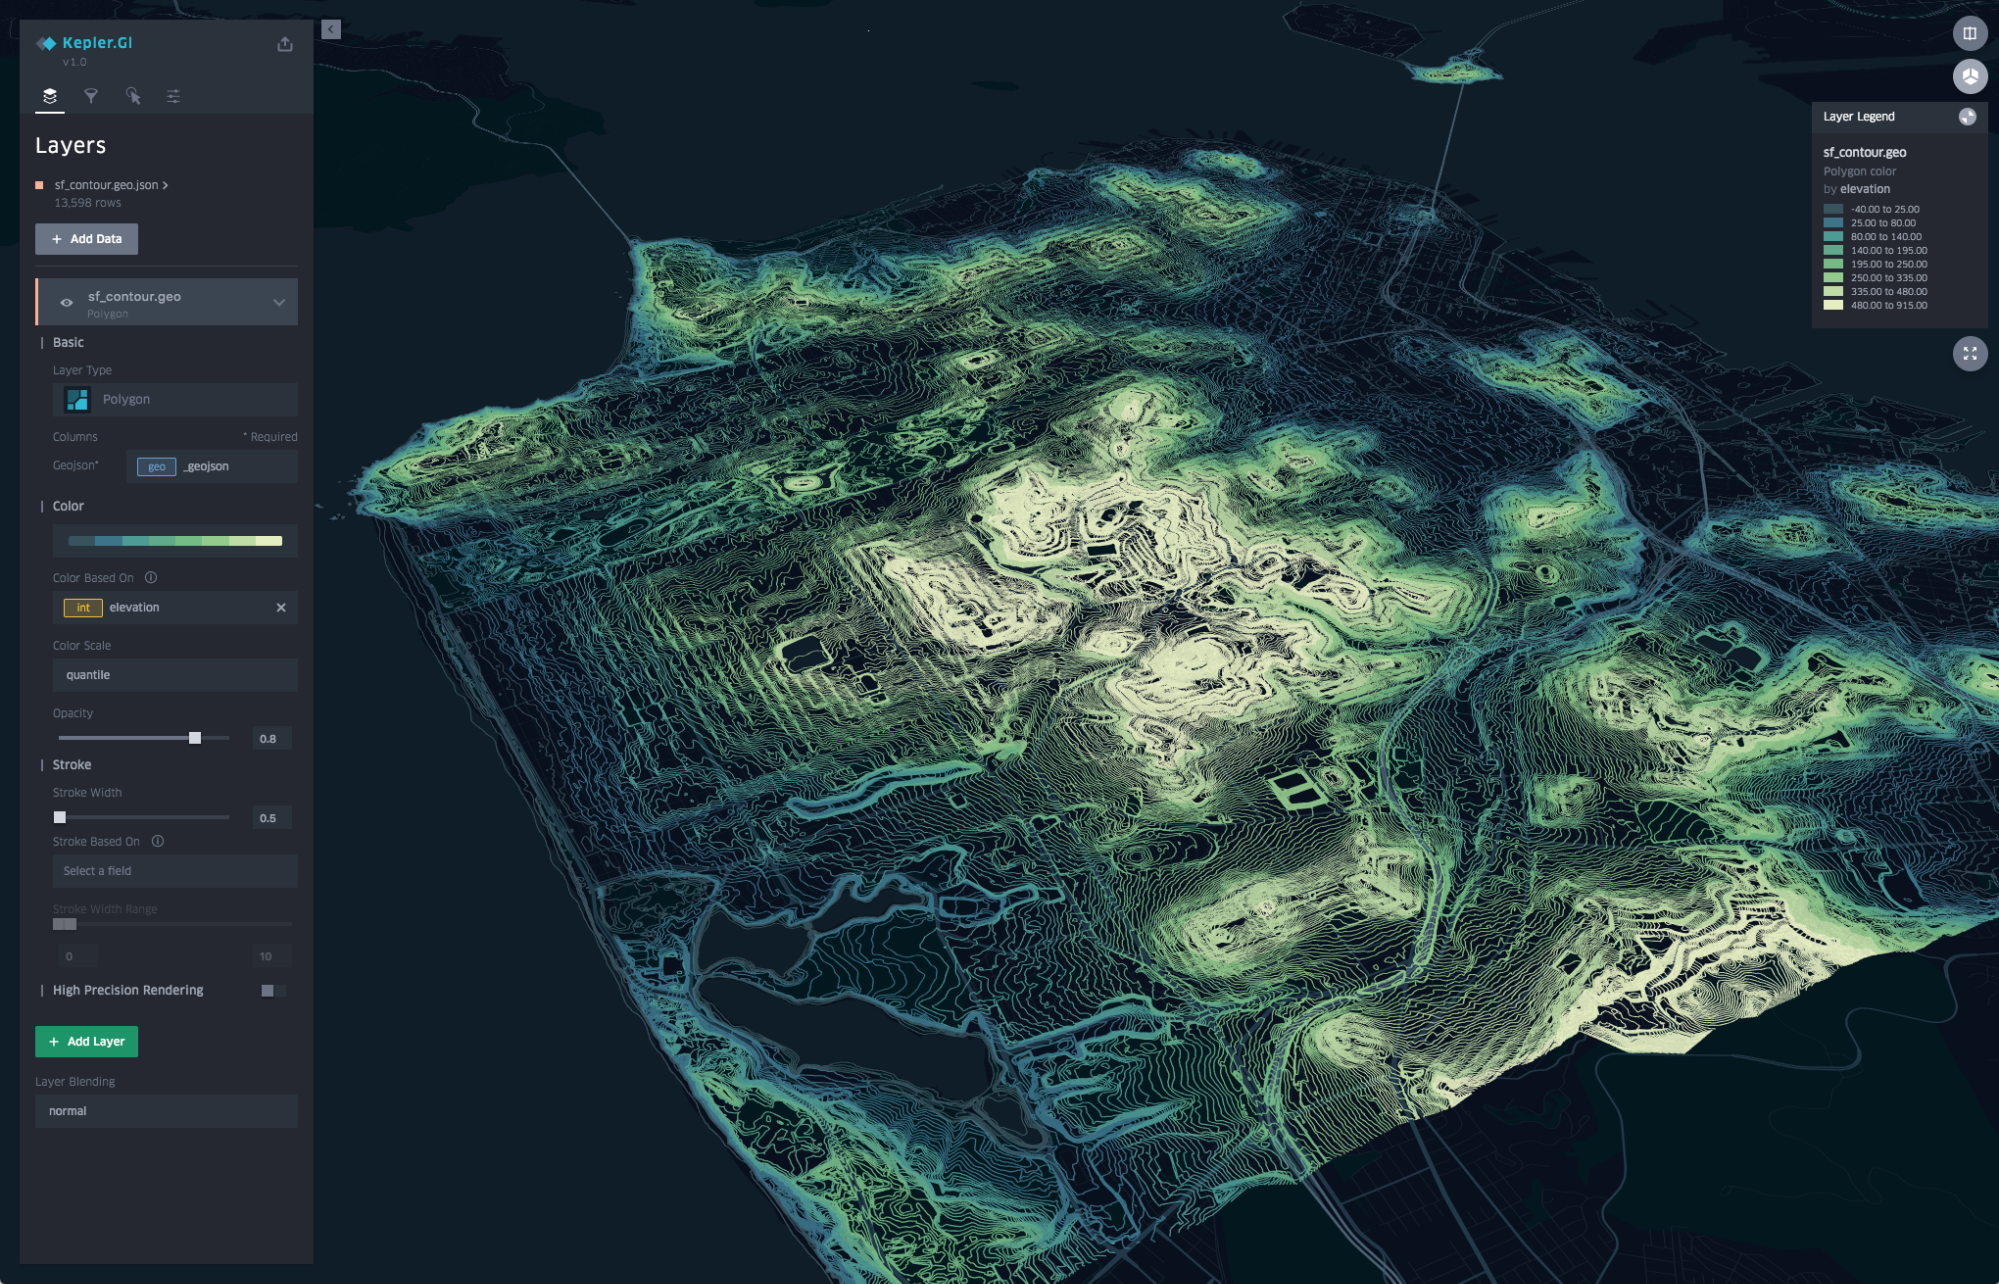
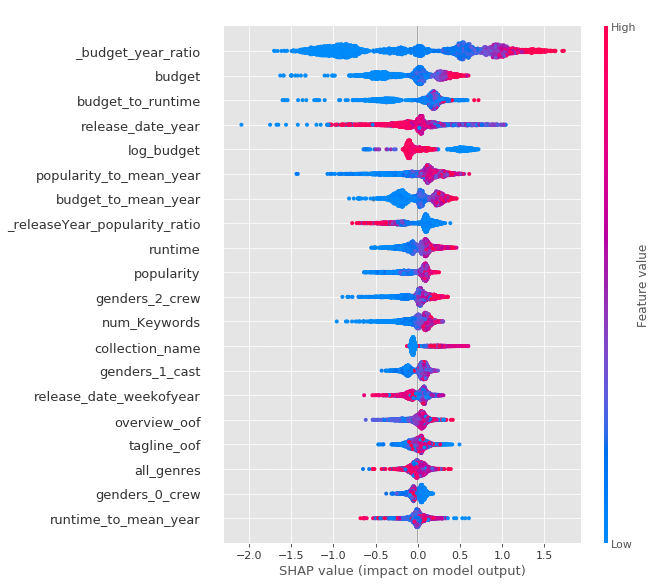
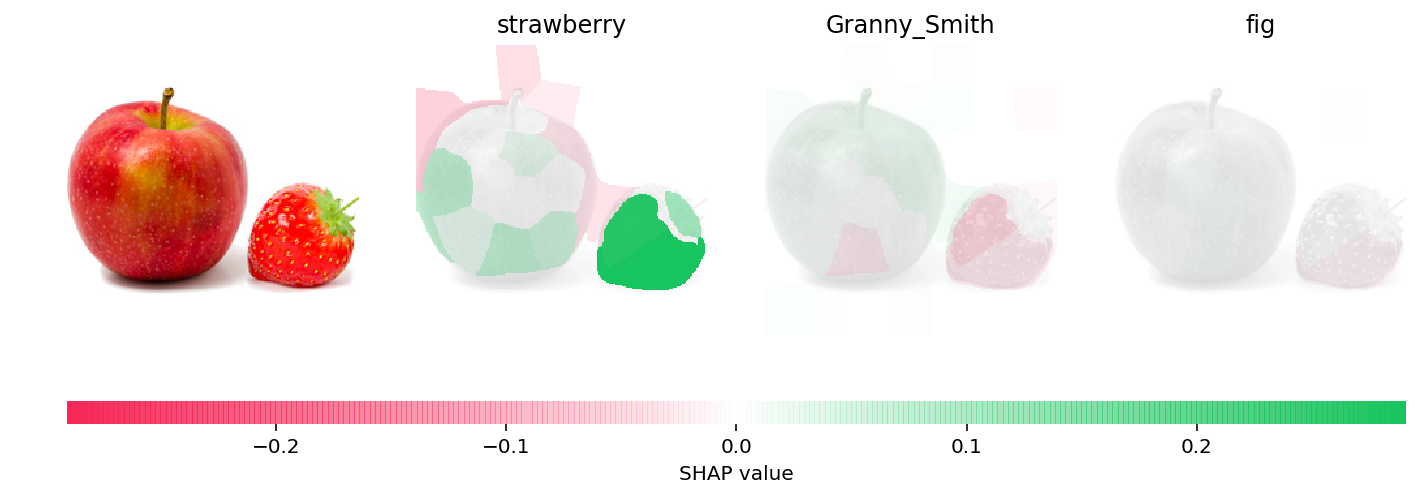
import shap
explainer = shap.TreeExplainer(model1, X_train)
shap_values = explainer.shap_values(X_train)

shap.summary_plot(shap_values, X_train)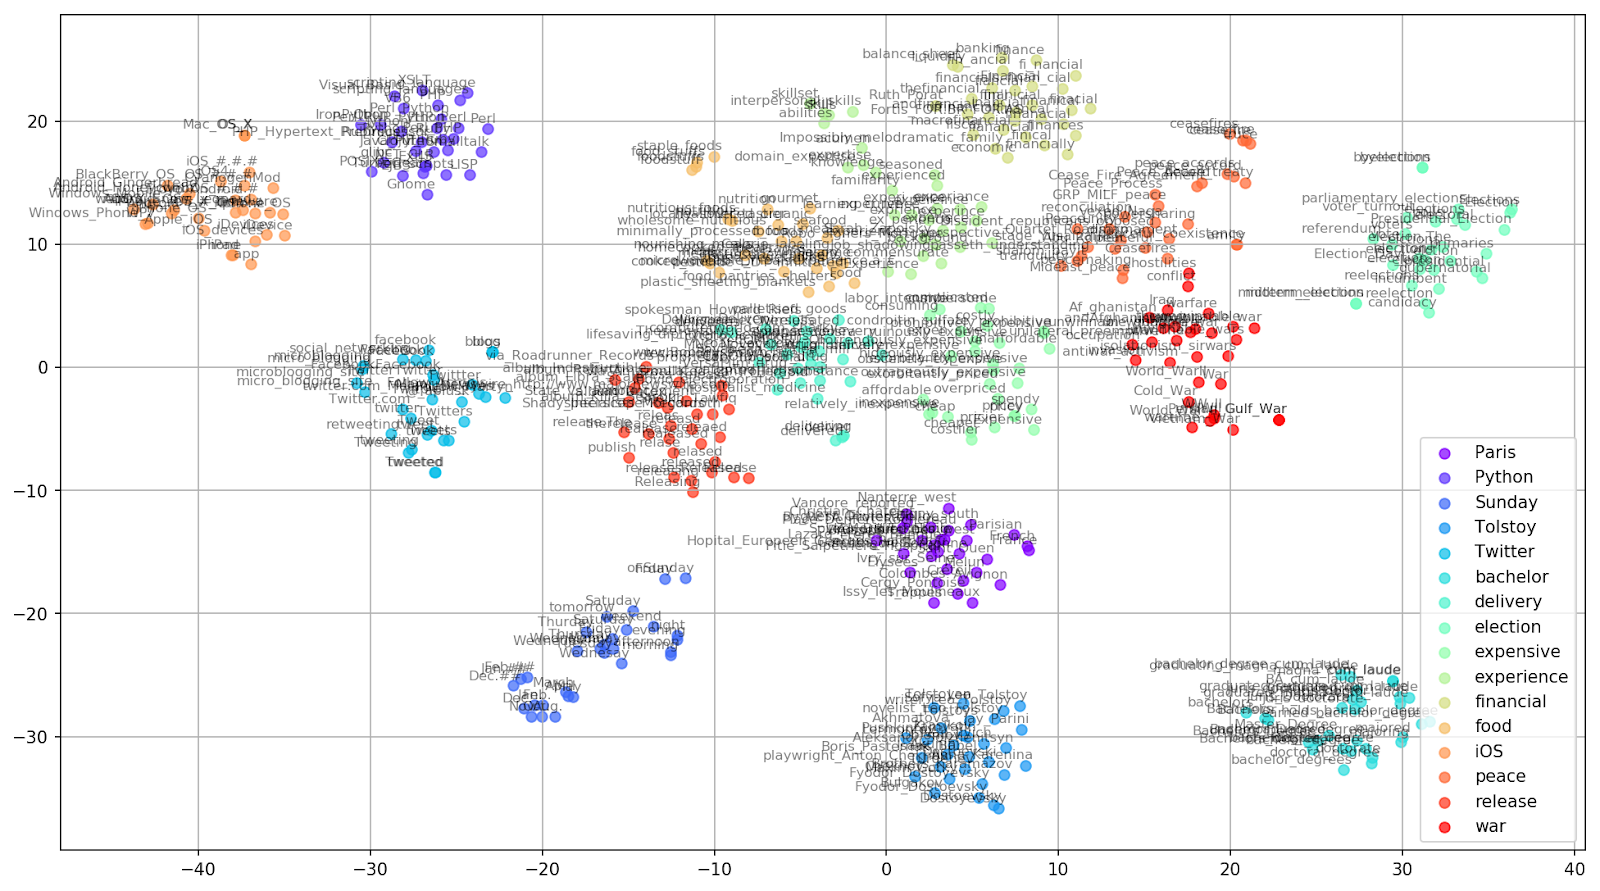


References
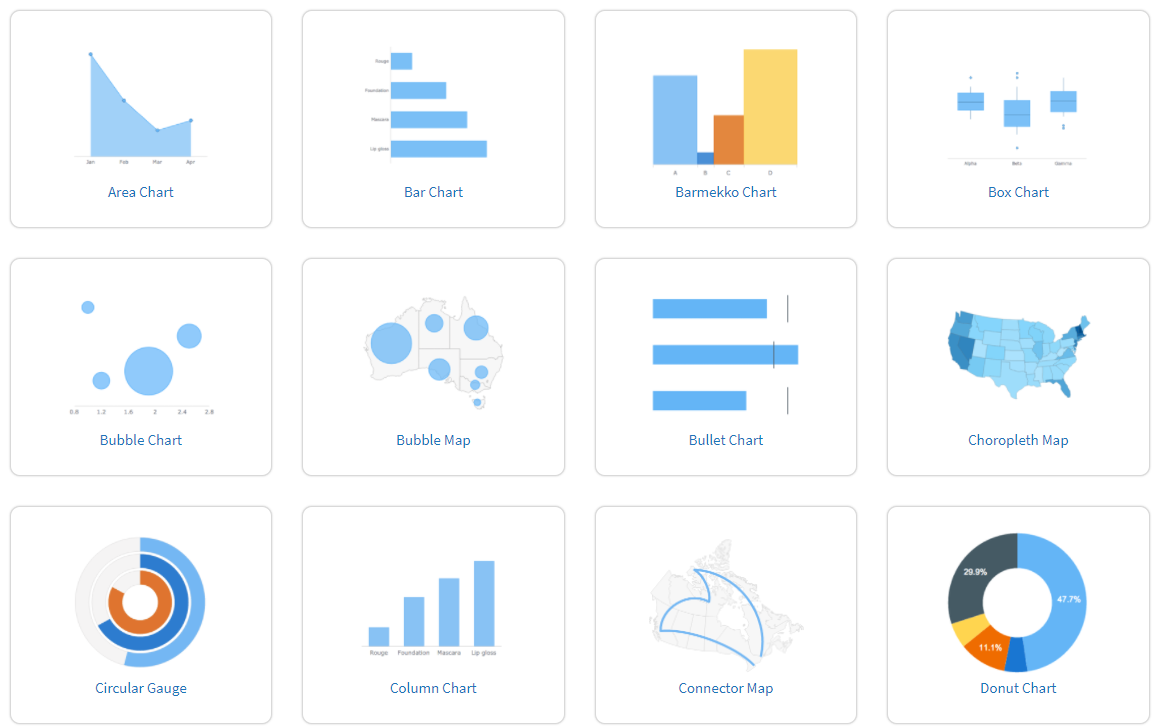
- https://www.anychart.com/chartopedia/usage-type/
- https://gramener.github.io/visual-vocabulary-vega/#
- https://www.python-graph-gallery.com/
- https://raw.githubusercontent.com/Financial-Times/chart-doctor/main/visual-vocabulary/poster.png
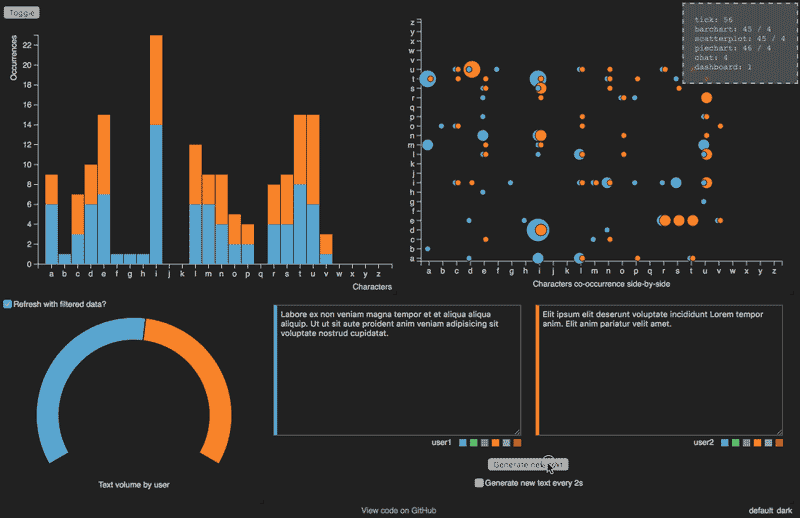
- https://textvis.lnu.se/
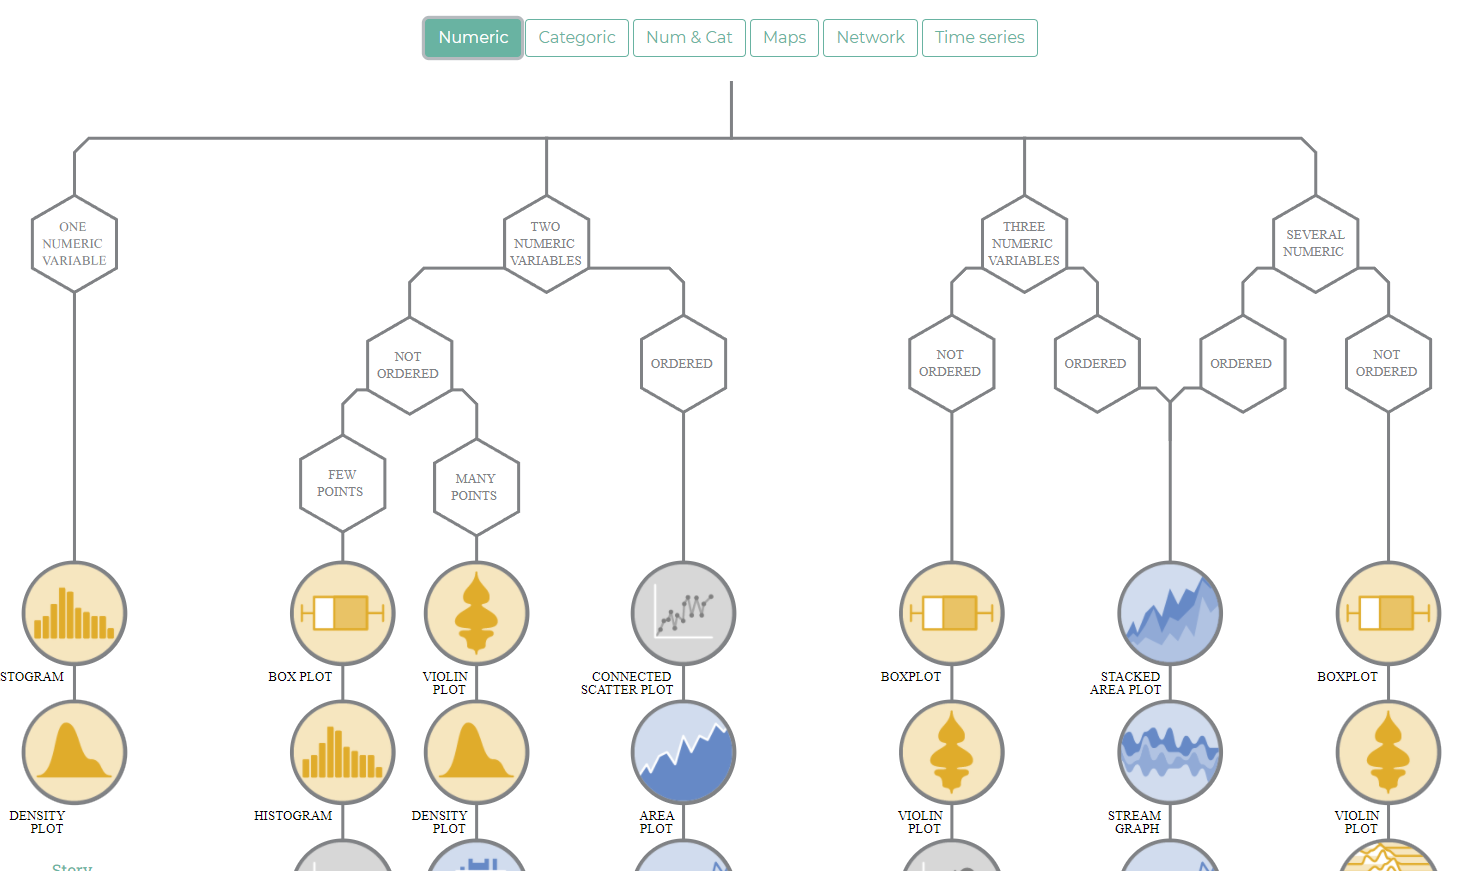
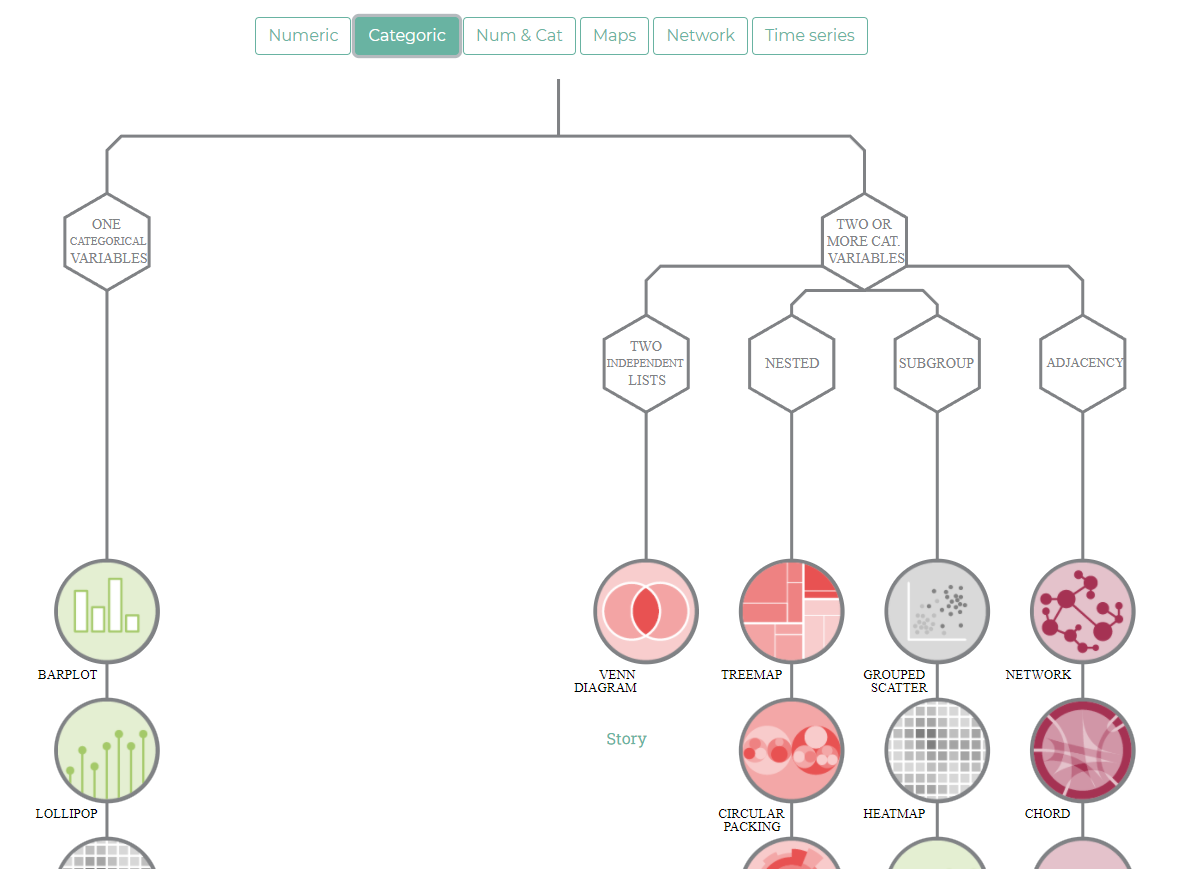
- https://www.data-to-viz.com/
- https://www.datavisualizationsociety.org/
References
-
https://towardsdatascience.com/data-visualization-in-data-science-5681cbdde5bf
-
https://github.com/Financial-Times/chart-doctor/tree/main/visual-vocabulary
-
https://revealthedata.com/blog/all/navyki-dlya-vizualizacii-dannyh-i-dataviz-inzhenerov/
-
https://docs.google.com/document/d/1SUZ_DXt_WXPlv1IfqlrwTa00S7b3ghJ_2o_W4yE6_UA/edit#
-
https://blog.datawrapper.de/better-charts/
References
-
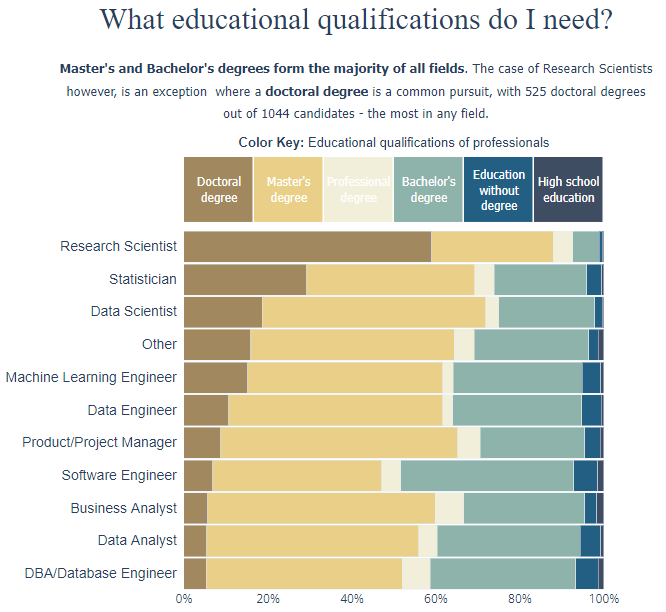
https://www.kaggle.com/spitfire2nd/enthusiast-to-data-professional-what-changes/
-
https://medium.com/nightingale/style-guidelines-92ebe166addc
-
https://www.tableau.com/learn/articles/best-data-visualization-blogs
-
https://boostlabs.com/blog/10-types-of-data-visualization-tools/
-
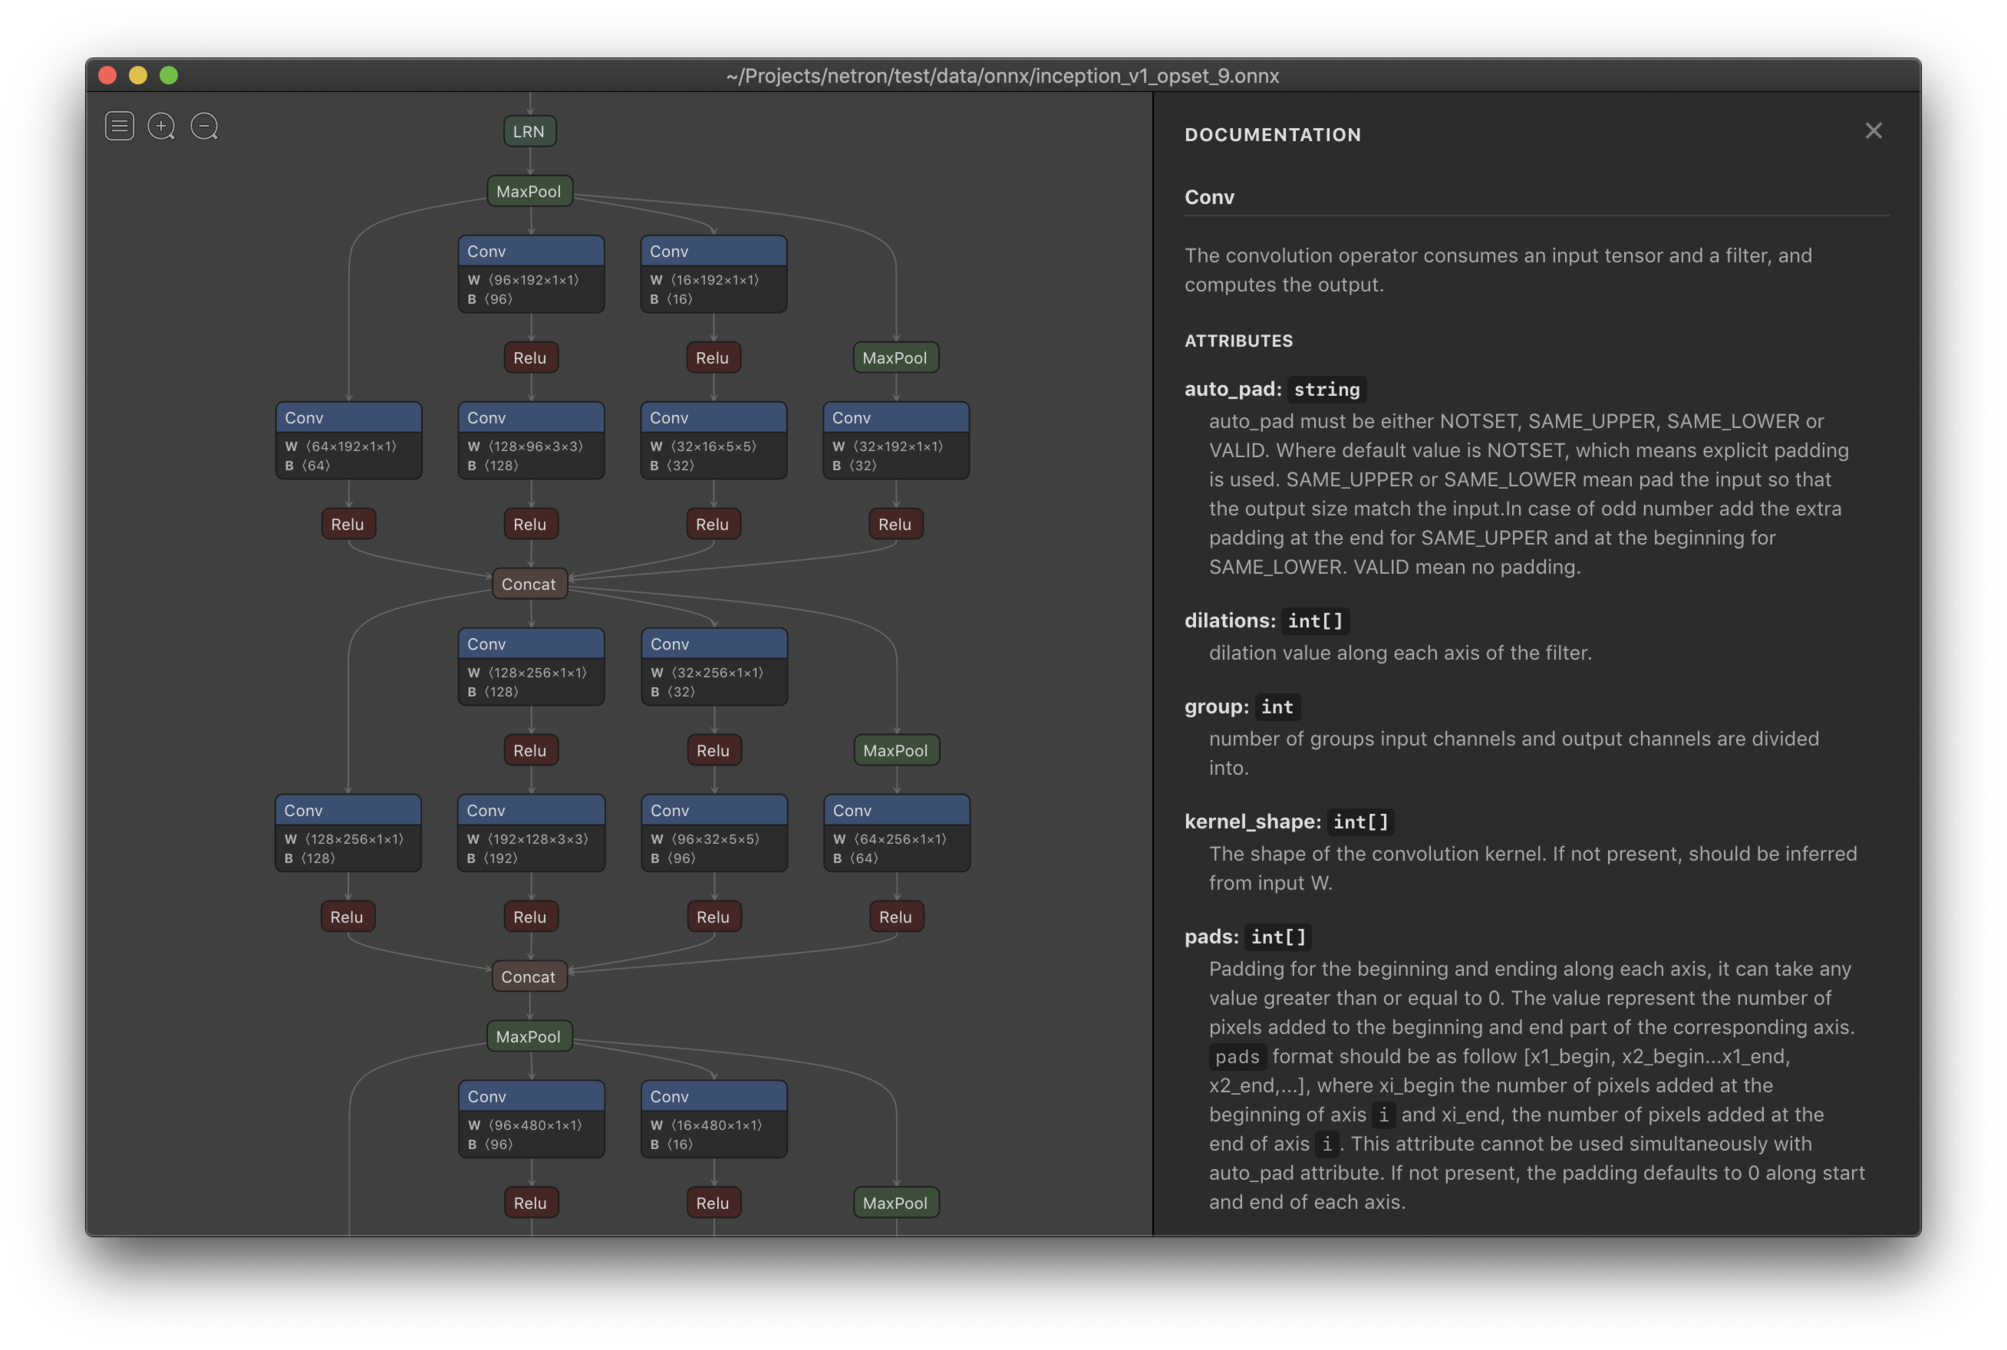
https://github.com/lutzroeder/netron
References
References
Contacts
Data Visualization talk
By Andrey Lukyanenko


