ArcGIS Tutorial
5/16/2017
https://slides.com/andyrutkowski/arcgis/live
Why?
ArcGIS provides a powerful solution for managing, analyzing, and visualizing data.

Lets use ArcGIS to explore this article.
Data
Data is one of the most important aspects of using ArcGIS. You will need to find and in many cases prepare your data for ArcGIS. Using reliable sources and documenting your work is essential.
For this workshop you will use the following data:
Collision Profile from http://geohub.lacity.org/
Direct Link - http://geohub.lacity.org/datasets/4580bf2d004746dea388db8690205493_0
Point Data
Boundary Files
LA County Neighborhoods V.6 from LA Times Mapping LA Boundaries - http://boundaries.latimes.com/sets/
Direct Link - http://boundaries.latimes.com/1.0/boundary-set/la-county-neighborhoods-v6/?format=shp
LA County 2010 Census Tracts - https://egis3.lacounty.gov/dataportal/2011/07/19/census-tracts-2010/
Line Data
Los Angeles Bikeways from Metro - http://developer.metro.net/introduction/bikeways-data/download-bikeways-data/
Open the link below and download the folder called "ArcGISWorkshop" and put it on your desktop.
Be sure to unzip any zipped files.
Lets load some data into ArcGIS!
ArcGIS projects begin as "blank maps." Meaning right from the start you will need to add data (including a basemap) before you see anything on your map.
Connecting a folder
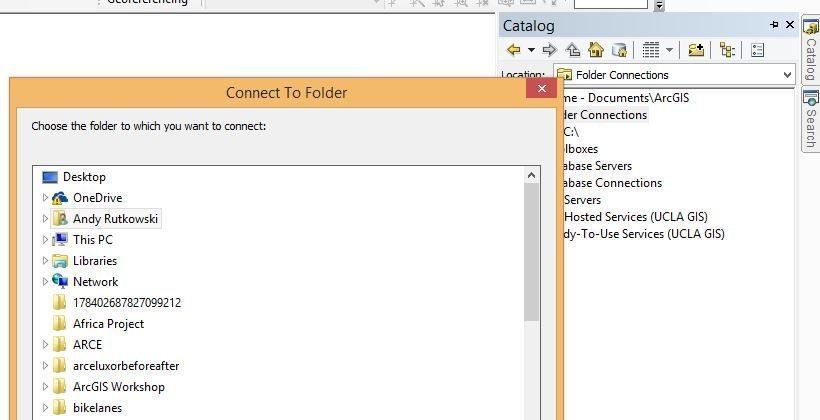
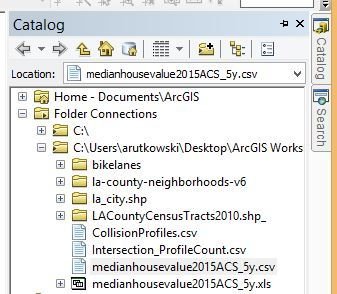
You should
see your folder
connected
with data files
nested below.
Select, drag, and drop
Working with the layers:
Switch between "list by source" and "list by drawing order".
The Attribute Table
Once you load data you can look at the attribute table
Lets add some points to the map!
Right click on data file and then click on "Display XY data"
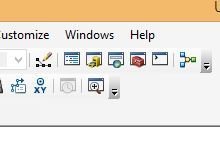
Lets pause and look at some basic functions
1. Zoom to
Layer
2. Pan
3. Identify
Joining Data
Lets join the collision data to the neighborhood file. This will be a "spatial join." You will join and sum up the data.
You can open the attribute table now in your new file "Join_output."
Scan the table and see how the data has been joined from both files.
You can also rename this file in order to better describe it.
Now we can do a simple choropleth map - colors by numerical data.
Symbolize!
Lets do another join
This time its a little harder.
We will be joining a tabular census data to a shapefile of census tracts.
Social Explorer aside!
(this is where we quickly demo Social Explorer)
The data is already downloaded for you!
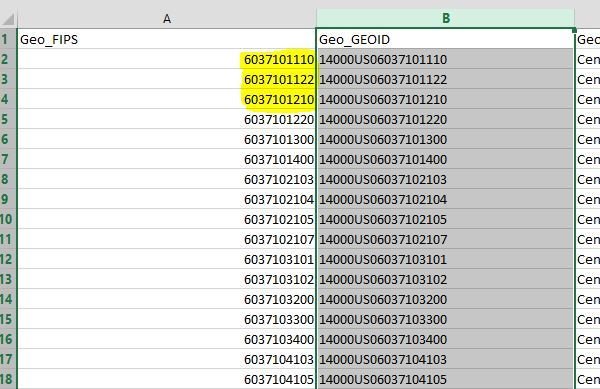
You should have two "median house value" files. One CSV and one Excel. Open up the CSV.
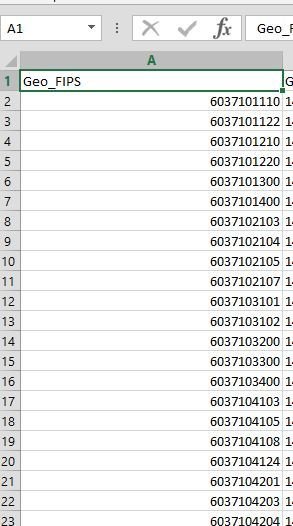
Notice how the Geo_FIPS number is 10 digit number with no zero at the beginning.
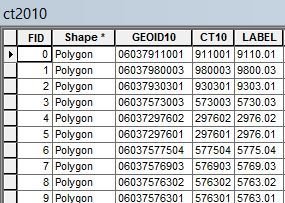
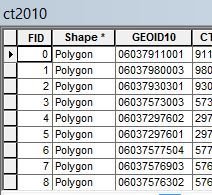
If you go to your ArcGIS data and open the
attribute table for the ct2010 you will notice that the GEOID10 column has a zero appended to the same 10 string number(this is the file with census tracts for LA County).
We need to make
sure that the column for
housing value
aligns correctly
with data from the
Census Tract file.
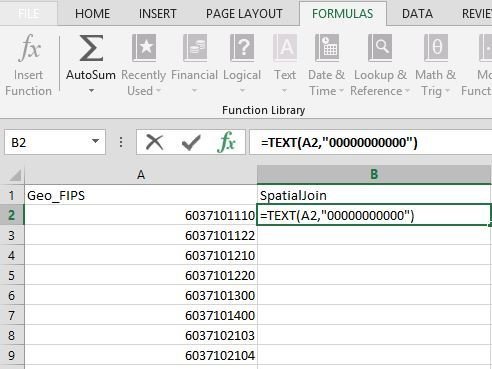
In Excel go to formulas
and select Text and create
the following formula. You are taking A2, the FIPS code, and then adding 11 "0"s in order to append one zero at the beginning. In the process we are turning this number to text so that it will be read as a "string" in ArcGIS.
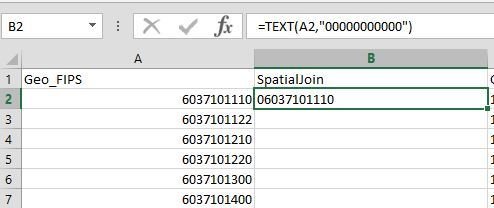
You should have the Zero appended to the front. You can now just drag the formula for the remaining cells.
IMPORTANT - save as "Exel 97 - 2003 Yearbook"
appending the zero in action
IMPORTANT
- save as a new file
- name it "housingvaluebytract"
- select "Exel 97 - 2003 Yearbook"
- add it to your ArcGIS project
You can now join the data using your "spatialjoin" column!
You can double check your attribute table to see if the data was joined or go straight to symbolizing it!
If you want you can save this join and make it permanent.
Playtime
ArcGIS
By andyrutkowski


