Configuring IDE with debugger
Evgeniy Melnikov
www.angarsky.ru
@angarsky
How to start?
- Download and install the PhpStorm (Free 30-day trial)
- Create a Project
- Configure Settings
- Configure a Git
- Configure a Debugger
- Enjoy a development!
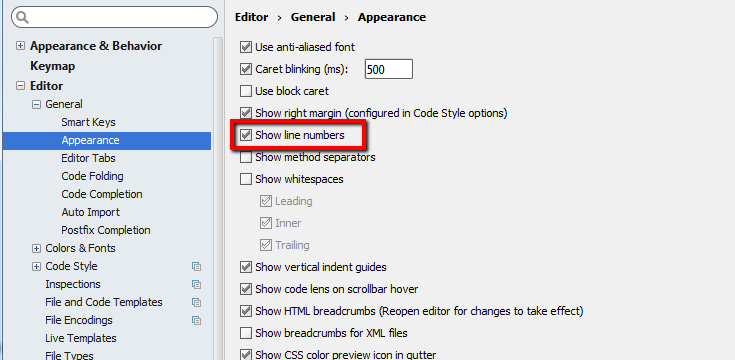
Configure Settings
Show line numbers
Settings - Editor - General - Appearance
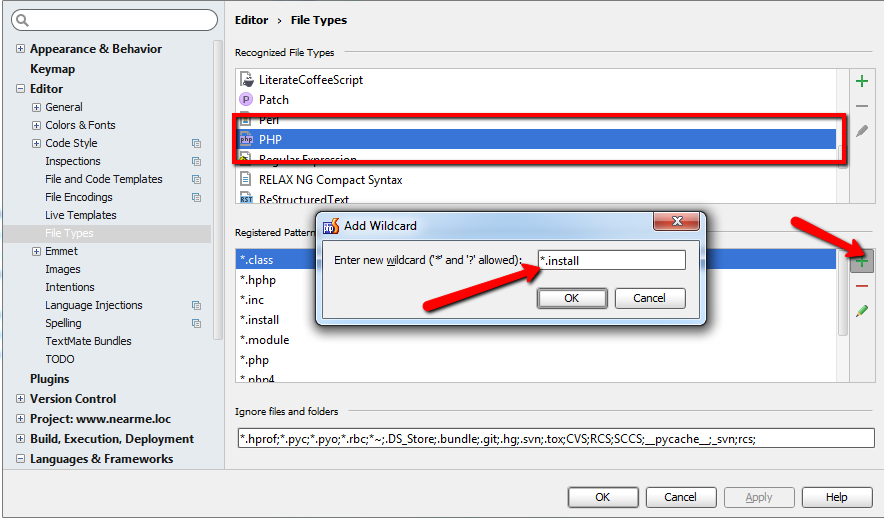
Configure Settings
Recognizing of PHP files
Settings - Editor - File Types
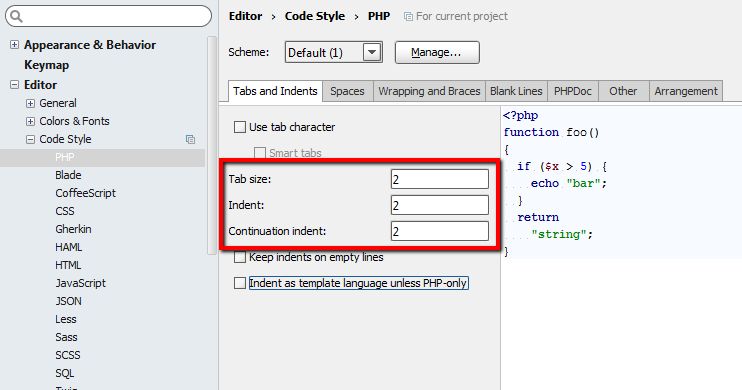
Configure Settings
Code styles
Settings - Editor - Code style
- Branch switching
- Performing commits, pushes
- Resolving conflicts
- Reviewing of history
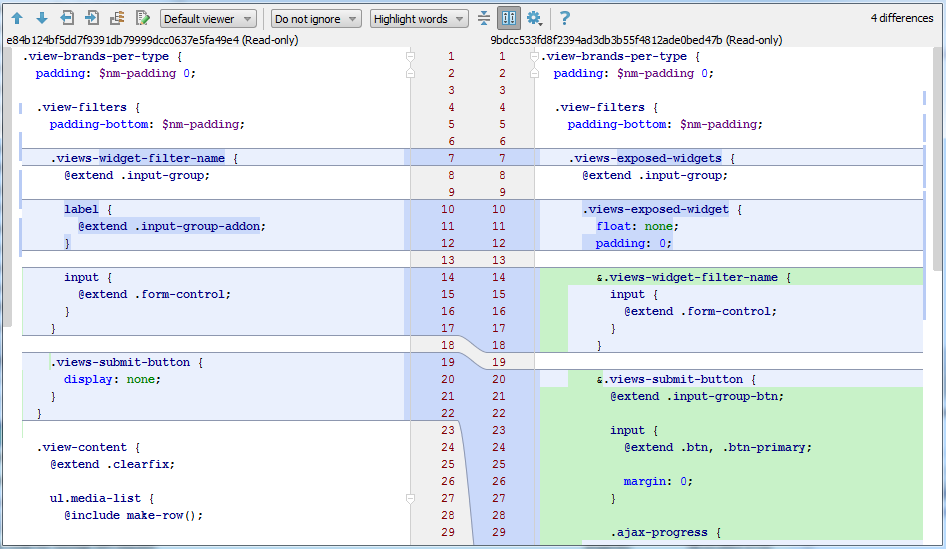
- Highlighting of code changes
- Other commands: "tag", "reset", "stash", "revert", etc.
Configure a Git
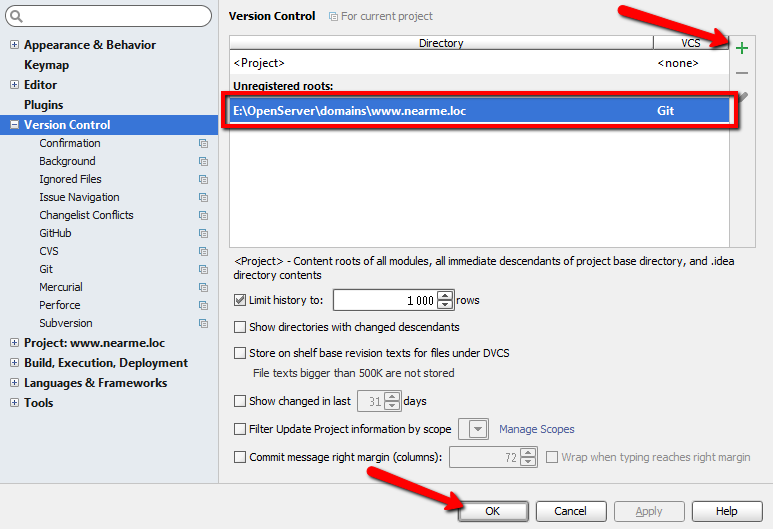
Settings - Version Control
Git tools in PhpStorm

Git tools in PhpStorm
- Installation on server
- Configuration at virtual machine (VirtualBox)
- Configuration for debugging PHP-CLI scripts
- Configuration at remote server
Xdebug: installation on server
-
sudo apt-get update
-
sudo apt-get install php5-xdebug
Create an .ini file for Xdebug configuration:
- sudoedit /etc/php5/mods-available/xdebug.ini
- Add to file: "zend_extension = xdebug.so"
Enable Xdebug configurtion and restart your web-server:
-
sudo php5enmod xdebug
-
sudo service apache2 restart
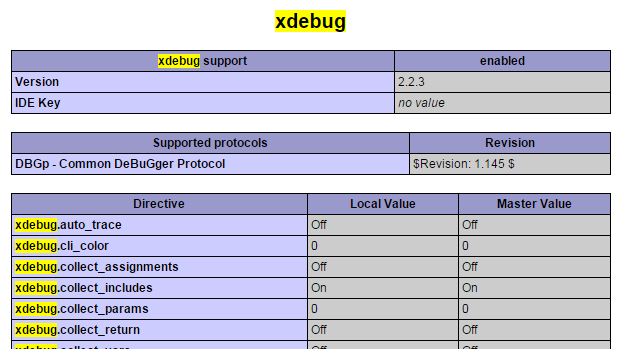
Xdebug: check installation
Check via terminal:
-
php - i | grep "xdebug"
Check via PHP code:
- phpinfo ( ) ;
Xdebug: config for virtual machine
xdebug.ini:
zend_extension=xdebug.so
[xdebug]
xdebug.remote_enable = 1
xdebug.remote_connect_back = 1
xdebug.idekey = "PHPSTORM"
xdebug.remote_port = 9000
xdebug.var_display_max_data = 2048
xdebug.var_display_max_depth = 128
xdebug.max_nesting_level = 500
Xdebug: config for debugging PHP-CLI scripts
xdebug.ini:
zend_extension = xdebug.so
[xdebug]
xdebug.remote_enable = 1
xdebug.remote_autostart = 1
xdebug.remote_host = 192.168.56.1
xdebug.idekey = "PHPSTORM"
xdebug.remote_port = 9000
xdebug.var_display_max_data = 2048
xdebug.var_display_max_depth = 128
xdebug.max_nesting_level = 500
If you use the VirtualBox
Xdebug: config for debugging PHP-CLI scripts
Configuration in xdebug.ini is not enough for debugging PHP-CLI scripts because Xdebug hasn't information about mapping of local and server files.
Perform a command:
- export PHP_IDE_CONFIG="serverName=MyServer"
"MyServer" is a Server name with mappings in PhpStorm debugger configuration.
(more information in next slides)
Xdebug: config for remote server
Dynamic IP address?
Your way is port forwarding via SSH tunnel!
Linux
ssh -R 9000:localhost:9000 user@host
Windows
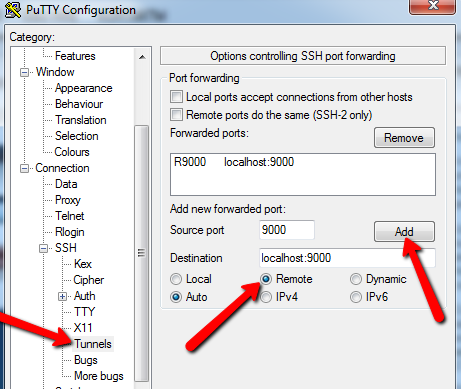
PuTTY client
Xdebug: config for remote server
xdebug.ini:
zend_extension = xdebug.so
[xdebug]
xdebug.remote_enable = 1
xdebug.remote_host = 127.0.0.1
xdebug.idekey = "PHPSTORM"
xdebug.remote_port = 9000
xdebug.var_display_max_data = 2048
xdebug.var_display_max_depth = 128
xdebug.max_nesting_level = 500
How to configure a debugger in PhpStorm?
General configuration
- debuging at local virtual machine
- debugging of PHP-CLI scripts
- remote debugging
General configuration
export PHP_IDE_CONFIG="serverName=MyServer"
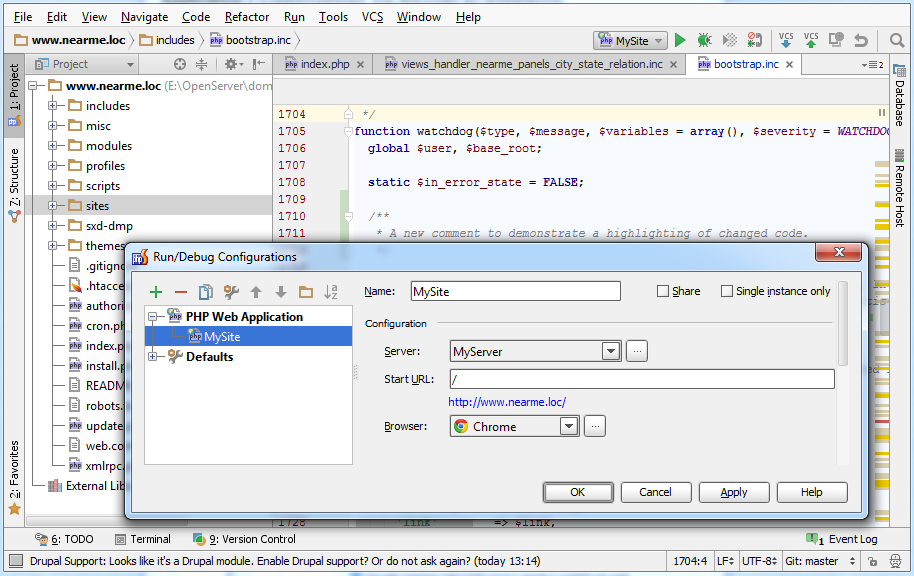
General configuration
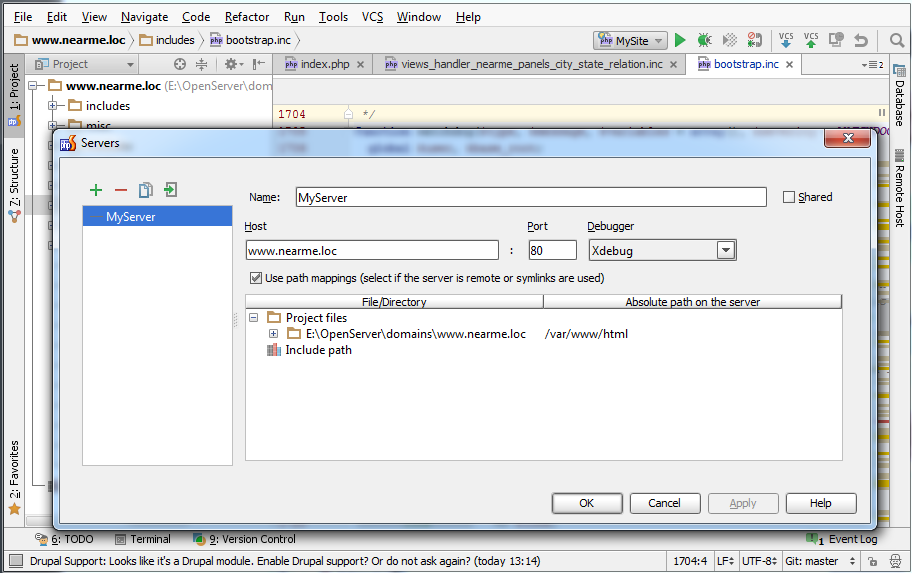
General configuration
Summary
- Navigate "Run" - "Edit Configurations..."
- Add a new PHP Web Application
- Add a new Server
- Define a Server name, host and port
- Add a mapping for files that are stored locally and at the server (virtual machine) side
- Save configuration for Server and PHP Web Application
Let's start debugging!
Debugging with PhpStorm
- Set breakpoints in code
- Run a debugger (click on a green bug icon or press Shift + F9)
- Analize values of variables step by step in real time

For PHP-CLI scripts:
- Enable mode: "Run" - "Start Listening for PHP Debug Connections"
- Run a script execution via terminal

Debugging with PhpStorm
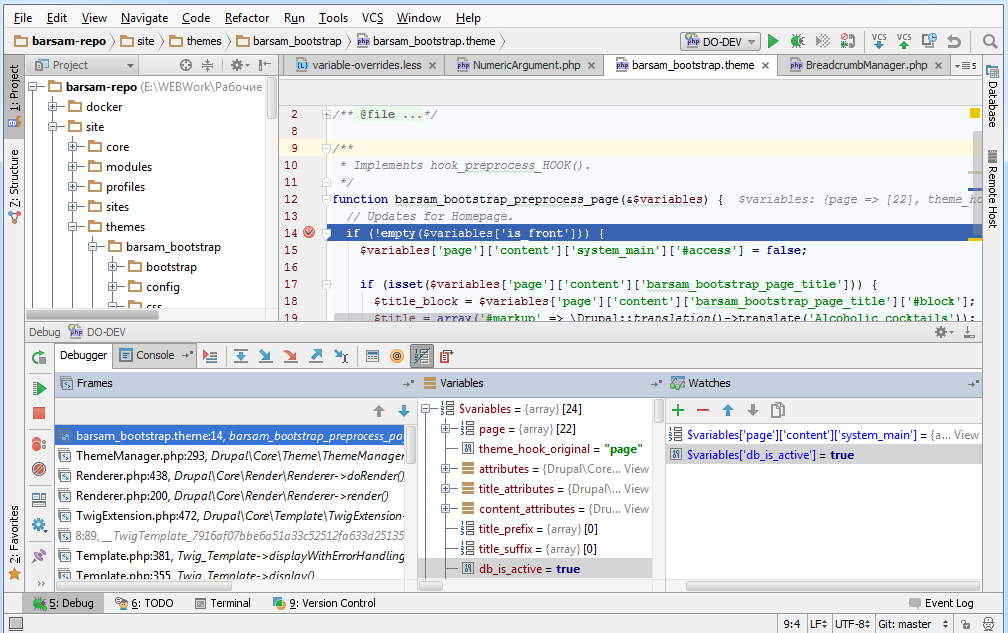
Debugging with PhpStorm
Hot keys
- F7 — go to the next line of code (step into a function)
- F8 — go to the next lin of code (step over a function)
- Shift + F8 — step out from function
- F9 — go to the next breakpoint or finish a debugging process
- Shift + F9 — start a debugging process
Debugging with PhpStorm
Tips
- If you want to set a breakpoint on array — set it on a first element of array. In another case the breakpoint will be inactive.
- Use conditional breakpoints (right click of mouse by the breakpoint).
- Change files of Drupal core only if you use Git.
- Use CTRL + Click by function name to navigate into this function.
- Set a breakpoint into index.php to ensure that the debugger works.
- Add a parameter ?XDEBUG_SESSION_STOP to the URL if you want to stop a debugging process on server side.
Questions?
Configuring IDE with debugger
Evgeniy Melnikov
www.angarsky.ru
@angarsky
DS - Configuring IDE with debugger
By Semen Angarsky


