Improving Student Comprehension Through Interactive Model Visualization
Simon D. Halliday (Bristol), Christopher Makler (Stanford),
Douglas McKee (Cornell), and Anastasia Papadopoulou (Bristol)

Outline
-
Motivation
-
What did we do?
-
Examples
-
How?

Motivation
• Students have trouble connecting mathematical models to the real world (e.g., Bayer et al. 2020)
• Students have common misconceptions about how models work (Chew and Cerbin, 2021)
• Novices and experts approach problems very differently (e.g., Sherin, 2010)
• Scaffolded exercises with visualization help novices think more like experts (e.g., Dreyfus and Halevi, 1991; Hegedus and Kaput, 2004)
What did we do?
• Created more than 20 carefully scaffolded exercises that use EconGraphs.org
• Used them in Intermediate Microeconomics courses at three Universities
• Surveyed students about their experiences
Institutions
- 2 Universities in the US and 1 in the UK
- Intermediate microeconomics is a core course in all of them; in two of them is taught throughout the year (split or not)
- Teaching was in-person
- More than 100 students took the class(es) in each institution
How they were used
Institution A:
- Students worked on interactive exercises outside of class
- Included in problems sets (20% of grade)
- Students had to “guess” based on intuition, then use the graph and check, then confirm with algebra
Institution B:
- Check your understanding: Simple and low stakes with immediate feedback
- Illustrative questions: Walk students through a concept in the textbook/reading
- Puzzle questions: Harder; geared towards understanding cause and effect; questions part of a Canvas quiz for grades
Institution C:
- Used primarily during exercise lectures, but also signposted in seminars, and available in the e-textbook
- Questions about the theory and comparative statics
- None used in summative assessment
Student feedback
• Results from student surveys
• Open comments of students on what they thought on the interactive graphs and exercises
Institution A
Students' comments coded on a scale from less to very helpful
Institution A
• Helpful: “The interactive visualization exercises helped me better understand the material because I was able to take the concepts that I just learned and see it put into play with the problems. I would also write down what would happen in the simulations/problems.”
• Not helpful: "Not sure. I didn’t find the visualization particularly helpful, but I also tend to be a less visual person. I could see how these types of exercises would be helpful for other students, though.”
• Relevant evidence from Institution C: Many students think of themselves as more “mathematical” or “visual” and some of them who self-perceive as more mathematical think the interactives are less helpful.
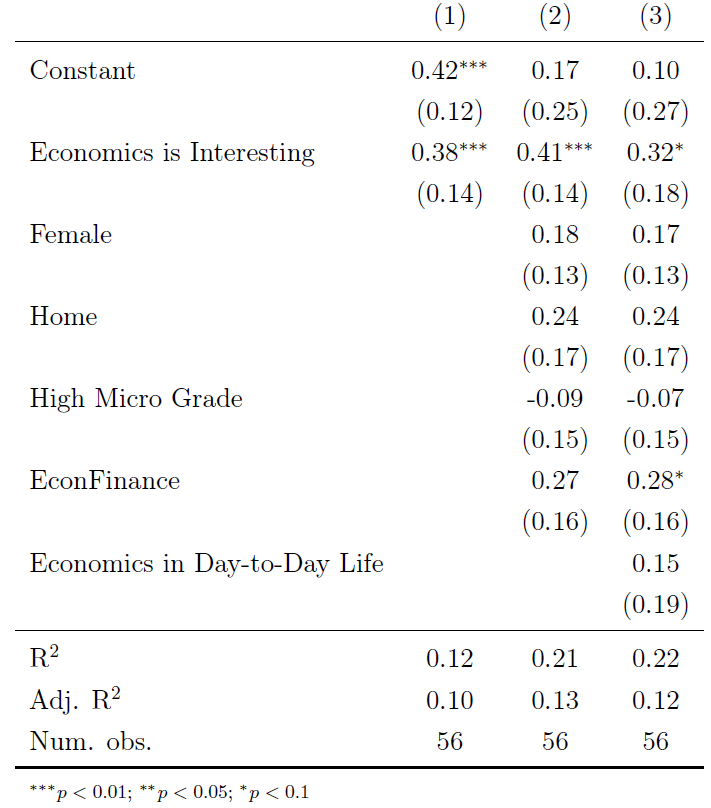
Institution A
Assessments of prerequisite skills were given at start of the term:
- Mathematics for Economics Skills Assessment (MESA-Intermediate)
- Principles of Economics Assessment for Microeconomics (PESA-Micro)
Asked about demographic characteristics (including gender, race, father’s education, parental education, and parental occupation).
Asked for their level of agreement with two statements about their attitude toward economics:
- "I think about economic events I experience and witness in day to day life (e.g., in your own life and decisions, on the news, internet articles, etc.)”
- "I think economics is interesting and applicable for people like me."
Institution A
Institution A
Attitude toward interactive exercises
Institution B
Microeconomics I: Likert scale questions
Institution B
Microeconomics II: Likert scale questions
Institution B
In general, did you feel that the pre-lecture quiz questions (both interactive and non-interactive) helped you to come to class better prepared? If so, how?
•“I thought the pre-class quizzes allowed me to be more prepared for class and get a better understanding of the material in class because it was the second time seeing it. I liked the interactive ones with the graphs because I liked how you could visually see the changes.”
•"They helped with organizing the way to process the readings, but they were very stressful and as someone who has difficultly [sic] learning from a textbook it felt somewhat unfair to be tested on the material before class[…] I thought that the ones with interactive visualized questions were particularly helpful, the reading/written ones seemed less helpful as it was harder to process than during the in class explanation."
Institution B
In general, did you feel that pre-lecture quiz questions which used interactive visualization helped you to come to class better prepared? If so, how?
•"Yes! It’s super helpful to see it change in real time, rather than trying to juggle all the concepts mentally. Made this so much more enjoyable than Econ 1.”
•"Those helped me a LOT and I would really like to have more of them! When I see a static diagram or a bunch of math equations in Varian I’m usually thinking like ‘ok, I’ll just accept this at face value.’ But when I get to play around with the sliders and see how the graphs change, I start to truly believe that ‘oh, setting the price/quantity at this level does indeed make everyone better off!’"
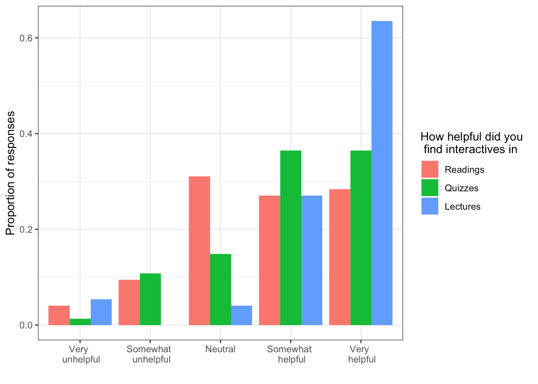
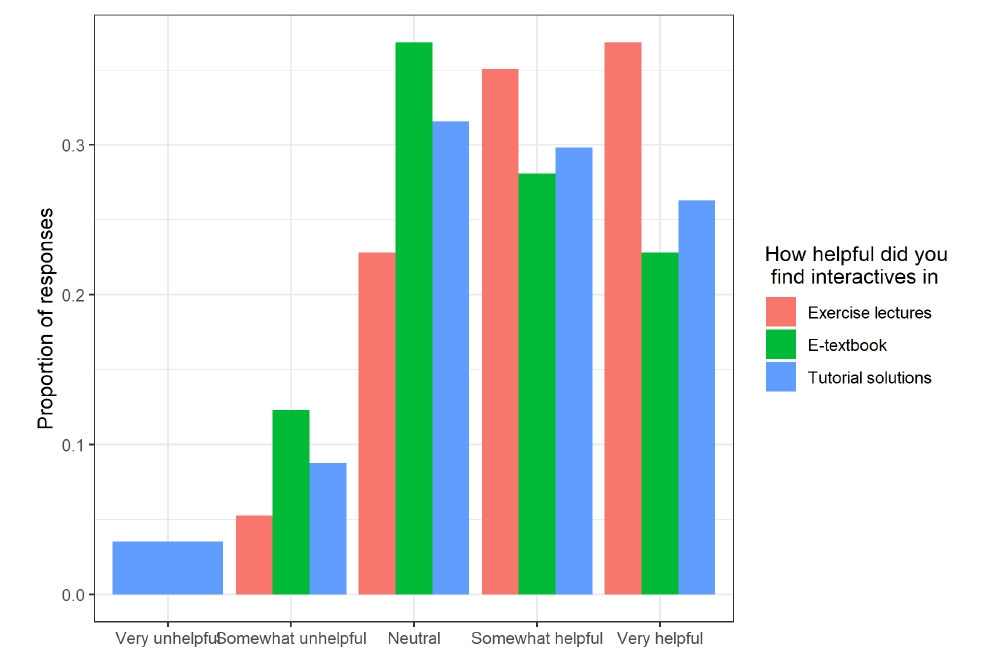
Institution C
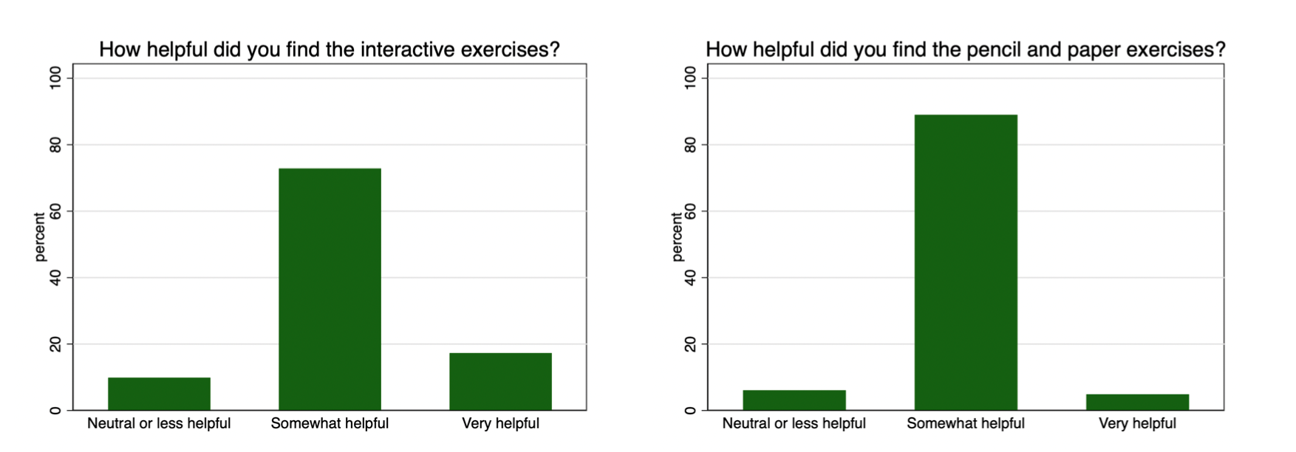
Likert scale question: "How helpful were interactive exercises?"
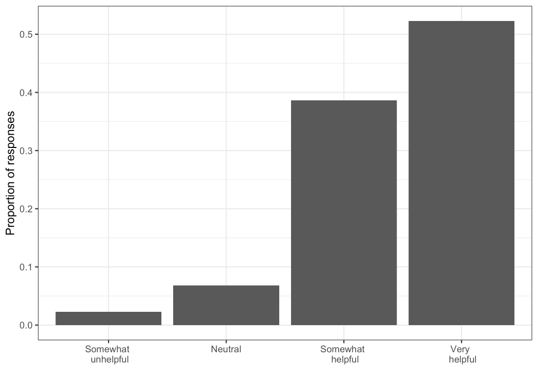
Institution C
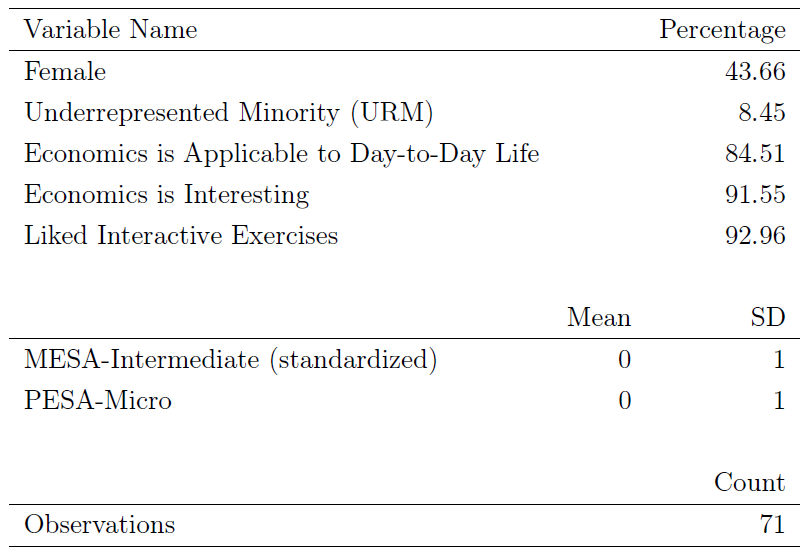
Likert scale question: "How helpful were pen and paper exercises?"
Institution C
Students' quotes: negative/neutral
•"[Interactive graphs] can sometimes be useful in visualising shifts, but I find it easier to understand by looking at equations and seeing how a variable changing will affect curve.”
•"I tend to understand the equations of the curves, I don’t find the interactive graphs very useful." (student answering "neutral")
Institution C
Students' quotes: positive
•"They are all helpful and really aid my understanding of the models."
•"The interactive graphs work really well and are really helpful in understanding the effects of specific variables."
•"The exercises where lots of questions were asked on one graph helped get a large overview and understanding on each line and interpretation of the graph."
•"The labour market example was really helpful - there were a number of factors which all affected the model in different ways and so it was good to visualise how each variable affects the curves/outcomes.”
• Some students report that the interactive graphs are more appropriate in some teaching modes rather than others, for example: "I find it more useful in seminars [small-group classes of 15-30] rather than exercise lectures."
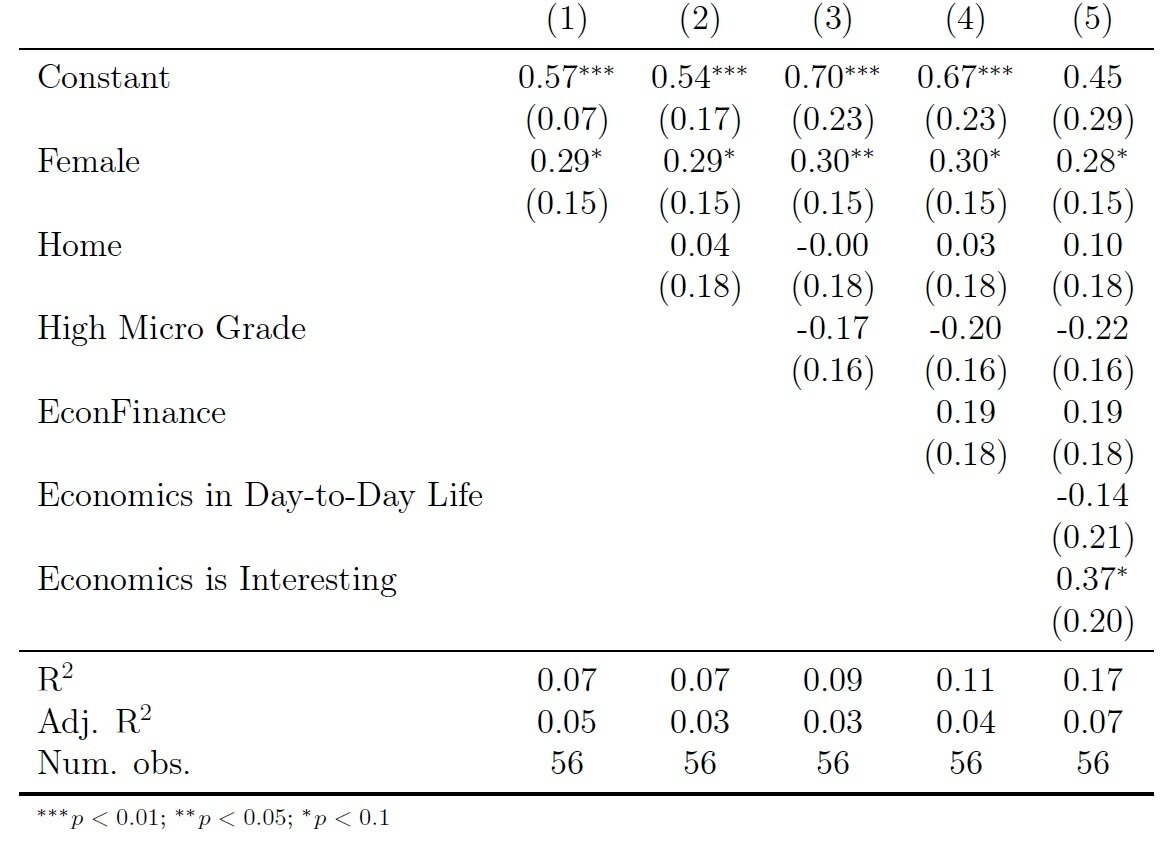
Institution C
Final grade in Micro course (using classification)
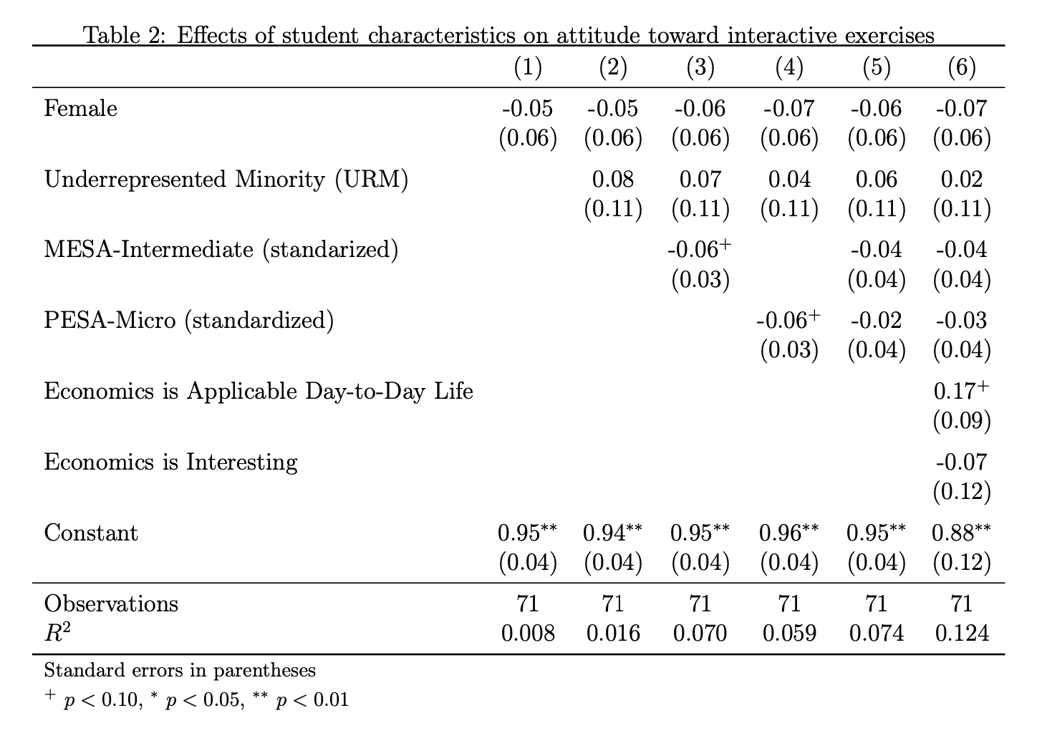
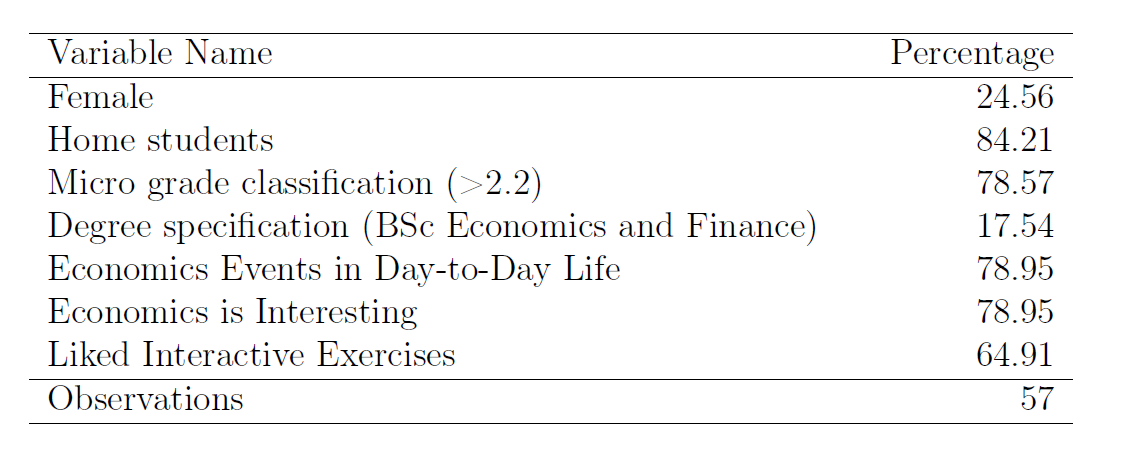
Expanded the dataset with some student characteristics (i.e., sex, home/international status, degree specification)
Asked for their level of agreement with two statements about their attitude toward economics:
- "I think about economic events I experience and witness in day to day life (e.g., in your own life and decisions, on the news, internet articles, etc.)”
- "I think economics is interesting and applicable for people like me."
Institution C
Summary statistics
Institution C
Attitude toward interactive exercises (lectures)
Institution C
Attitudes toward interactive exercises (all)
Main take-aways
• Students find that working through exercises that use interactive graphs is helpful.
• Students who enter the course less technically prepared in particular find the interactive graphs valuable (evidence from Institution A).
• Female students find the interactive graphs more valuable on average (evidence from Institution C).
• Students that are more intrinsically motivated to study Economics appreciate the value of the exercises more than other students.
• Interpretation of comments like “more mathematical” and responses in a ”neutral/somewhat unhelpful/very unhelpful” way.
Future research
This is part of a broader project that studies how interactive graphing and problem-solving can be used in economics alongside other practices informed by the learning sciences to improve student learning outcomes:
• Estimate effect of IEs on student learning
• Investigate the effect of IEs on student mindset and belonging
• Develop IEs for introductory courses and advanced electives
Thanks
• Bridget Diana for excellent RA work on the interactive graphs for Bowles and Halliday (2022) and the Santa Fe Institute for funding
• Thanks to the Cornell Economics department for generous funding and work done by Vidya Balaji and Tuan Anh Dang
Example

rb.gy/670jf
Example 1

rb.gy/5hnft
Example 2

rb.gy/ensg9
How?
- Helpful to first test them on Desmos.com
- Then, write them into Econgraphs
- Implement them in exercises

econgraphs.org

kineticgraphs.org
schema: BowlesHallidaySchema
colors:
  indifferenceCurve: "'#009E73'"
  otherPlayerAction: lightgrey
  principalAction: "'#0072B2'"
  bestResponse: "'#CC79A7'"
  cbblue: "'#0072B2'"
  cbmustard: "'#E69F00'"
  cbgreen: "'#009E73'"
  cbyellow: "'#F0E442'"
  cbred: "'#CC79A7'"
  cborange: "'#D55E00'"
params:
  - name: ubar
    value: 0.0157
    min: 0
    max: 1
    round: 0.01
  - name: B
    value: 0.2
    min: 0
    max: 1
    round: 0.01
  - name: t
    value: 0.7
    min: 0
    max: 1
    round: 0.01
  - name: b
    value: 0.15
    min: 0.1
    max: 0.5
    round: 0.01
  - name: gamma
    value: 0.9
    min: 0.5
    max: 1
    round: 0.01
  - name: rho
    value: 0.05
    min: 0.01
    max: 0.1
    round: 0.01
calcs:
U: (0.9-calcs.H)
G: (calcs.U + calcs.H -(1-calcs.U)*(calcs.wc))
wc: (((1 - params.b)*params.gamma)/(1 + params.rho))
Hstar: (1- ((1-params.t)*params.ubar)/((calcs.wc - params.B - params.ubar)*params.t))
H: (0.9 * calcs.Hstar)
X: (calcs.H*100*params.gamma)
firmExpand: calcs.wc > (((1 - 0.15)*0.9)/(1 + 0.05))
firmContract: calcs.wc < (((1 - 0.15)*0.9)/(1 + 0.05))
no: (calcs.Hstar < 0.5)
nothing: ((params.B + params.ubar + params.ubar*(1-params.t)/(params.t)) > calcs.wc)
something: ((params.B + params.ubar + params.ubar*(1-params.t)/(params.t)) < calcs.wc) layout:
OneGraphPlusSidebar:
graph:
xAxis:
min: 0
max: 1
title: Hours of employment as a fraction of labor supply, H
ticks: 4
yAxis:
intercept: 0
max: 1
title: Wage, w
ticks: 4
objects:
- Curve:
fn: "params.B + params.ubar + params.ubar*(1-params.t)/(params.t*(1-(x))) "
color: cbgreen
samplePoints: 2000
label:
text: "'w^N(H)'"
x: 0.7
position: t
- Line:
yIntercept: calcs.wc
color: cbblue
label:
text: "'w = w^c'"
x: 0.85
- Rectangle:
a: [0,calcs.wc]
b: [1,1]
fill: purple
clipPaths:
- Area:
fn: "params.B + params.ubar + params.ubar*(1-params.t)/(params.t*(1-(x)))"
samplePoints: 200
above: true
show: calcs.something
- Rectangle:
a: [0,calcs.wc]
b: [1, 0]
fill: blue
clipPaths:
- Area:
fn: "params.B + params.ubar + params.ubar*(1-params.t)/(params.t*(1-(x)))"
samplePoints: 200
above: true
show: calcs.something
- Point:
coordinates: [calcs.Hstar, calcs.wc]
droplines:
vertical: calcs.Hstar.toFixed(2)
sidebar:
controls:
- title: Equilibrium in the product and labour markets
- title: Policy Instruments
sliders:
- {param: B, label: B}
- {param: t, label: t}
- {param: b, label: b}
- {param: gamma, label: \\\gamma}
- title: Exogenous variables
sliders:
- {param: ubar, label: u}
- {param: rho, label: \\\rho}
divs:
- html: "`$P = 100$`"
- html: "`$E = 10$`"
- title: Endogenous variables
divs:
- html: "`<table>
<tr>
<td>Real wage rate ($w$):</td>
<td>${calcs.wc.toFixed(2)}</td>
</tr>
<tr>
<td>Employed population ($H$):</td>
<td>${calcs.Hstar.toFixed(2)}</td>
</tr>
</table>`"
show: calcs.something
- title: Endogenous variables
divs:
- html: "`<table>
<tr>
<td>Real wage rate ($w$):</td>
<td> $n/a$ </td>
</tr>
<tr>
<td>Fraction of population employed ($h$):</td>
<td> $n/a$ </td>
</tr>
</table>`"
show: calcs.nothing
- title: Legend
divs:
- html: "`<table>
<tr>
<td>$B$: </td>
<td> unemployment benefits </td>
</tr>
<tr>
<td>$t$: </td>
<td> termination probability </td>
</tr>
<tr>
<td>$b$: </td>
<td> barriers to entry </td>
</tr>
<tr>
<td>$\\\\gamma$: </td>
<td> output per worker </td>
</tr>
<tr>
<td>$u$: </td>
<td> disutility of effort </td>
</tr>
<tr>
<td>$\\\\rho$: </td>
<td> opportunity cost of capital </td>
</tr>
<tr>
<td>$P$: </td>
<td> total population </td>
</tr>
<tr>
<td>$E$: </td>
<td> number of employers </td>
</tr>
</table>`"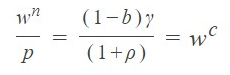
schema: EconSchema
colors:
  cbblue: "'#0072B2'"
  cbmustard: "'#E69F00'"
  cbgreen: "'#009E73'"
  cbyellow: "'#F0E442'"
  cbred: "'#CC79A7'"
  cborange: "'#D55E00'"
params:
  - name: n
    value: 3
    min: 0
    max: 20
    round: 1
  - name: x
    value: 1
    min: 0
    max: 37
    round: 0.01
  - name: beta
    value: 0.5
    min: 0
    max: 1
    round: 0.01
  - name: p
    value: 20
    min: 8
    max: 22
    round: 0.5
  - name: c
    value: 2
    min: 0
    max: 8
    round: 0.5
  - name: showBestResponse
    value: false


calcs:
  br: (((params.p - params.c)/(params.beta))-2*params.x)
  nash: ((params.p - params.c)/((params.n+1)*params.beta))
  nashX: (calcs.nash)*(params.n-1)
  totaloutput: calcs.nash + calcs.nashX
  price: (params.c + (params.p - params.c)/(1+params.n))
  profit: (calcs.price-params.c)*calcs.nash*params.n
  cs: (params.beta*(params.p-calcs.price))*calcs.nash*params.n
  sum: calcs.profit + calcs.cs
  interY: ((params.p - params.c)/(params.beta))
  interX: ((params.p - params.c)/(params.beta*2))
  n : ((params.p*(1-params.b)) - params.c)/(params.b*params.c)
  p : (params.c + (1/(params.n+1)) * (params.p-params.c))
  phat : (1-params.b)*calcs.p
  ecprofits: (calcs.n*(1/(calcs.n+1)^2))*((params.p-params.c)^2/(params.b))
  <!-- cs: (1/2)*(params.p - (params.c + ((1/(calcs.n+1))*(params.p -params.c)  )) )*(calcs.n/(calcs.n+1))*( (params.p - params.c)/(params.b)) -->
  markup: calcs.p - params.c
  <!-- eccs: calcs.ecprofits + calcs.cs -->
  nneg : (calcs.n < 0)
layout:
TwoHorizontalGraphsPlusSidebar:
leftGraph:
xAxis:
max: 37
title: The firm's output, $x^{i}$
ticks: 0
yAxis:
max: 37
title: Other firms' total output, $X^{-i}$
ticks: 0
objects:
- Line:
yIntercept: calcs.interY
slope: -2
color: cbgreen
label:
text: "\\text{BRF}"
x: 17
align: left
- Point:
coordinates: [calcs.interX,0]
r: 0
color: cbgreen
droplines:
vertical: "\\large\\frac{\\bar{p}-c}{2\\beta}"
- Point:
coordinates: [0,calcs.interY]
r: 0
color: cbgreen
droplines:
horizontal: "\\large\\frac{\\bar{p}-c}{\\beta}"
- Contour:
level: [(1/(params.n+1)^2)*(params.p - params.c)^2/(params.beta)]
fn: "(params.p - params.beta*y)*(x) - params.beta*(x)^2 - params.c*(x)"
color: cbgreen
- Label:
coordinates: [31,3]
text: \pi_{n}
color: cbgreen
- Line:
yIntercept: 0
slope: params.n-1
color: cbblue
label:
text: "\\small X^{-i}"
y: 36
- Point:
coordinates: [calcs.nash, calcs.nashX]
color: black
droplines:
horizontal: calcs.nashX.toFixed(2)
vertical: calcs.nash.toFixed(2)
rightGraph:
xAxis:
title: "Number of firms, n"
max: 20
ticks: 5
yAxis:
title: "Costs, price, expected price"
max: 12
ticks: 3
objects:
- Curve:
fn: params.c + (1/((x)+1)) * (params.p-params.c)
color: colors.cbgreen
label:
x: 16
text: "{p}(n)"
- Line:
yIntercept: params.c
slope: 0
color: colors.cbblue
label:
text: "cost"
x: 19
sidebar:
      controls:
      - title: Nash equilibrium output with n firms


        sliders:
        - {param: n, label: n}
        - {param: p, label: p}
        - {param: c, label: c}
        - {param: beta, label: β}
InteractiveGraphs
By apapad


