Improving Student Comprehension Through Interactive Model Visualization
Simon D. Halliday (John Hopkins), Christopher Makler (Stanford),
Douglas McKee (Cornell), and Anastasia Papadopoulou (Bristol)
How?
- Helpful to first test them on Desmos.com
- Then, write them into Econgraphs
- Implement them in exercises

econgraphs.org

kineticgraphs.org
schema: BowlesHallidaySchema
colors:
  indifferenceCurve: "'#009E73'"
  otherPlayerAction: lightgrey
  principalAction: "'#0072B2'"
  bestResponse: "'#CC79A7'"
  cbblue: "'#0072B2'"
  cbmustard: "'#E69F00'"
  cbgreen: "'#009E73'"
  cbyellow: "'#F0E442'"
  cbred: "'#CC79A7'"
  cborange: "'#D55E00'"
params:
  - name: ubar
    value: 0.0157
    min: 0
    max: 1
    round: 0.01
  - name: B
    value: 0.2
    min: 0
    max: 1
    round: 0.01
  - name: t
    value: 0.7
    min: 0
    max: 1
    round: 0.01
  - name: b
    value: 0.15
    min: 0.1
    max: 0.5
    round: 0.01
  - name: gamma
    value: 0.9
    min: 0.5
    max: 1
    round: 0.01
  - name: rho
    value: 0.05
    min: 0.01
    max: 0.1
    round: 0.01
calcs:
U: (0.9-calcs.H)
G: (calcs.U + calcs.H -(1-calcs.U)*(calcs.wc))
wc: (((1 - params.b)*params.gamma)/(1 + params.rho))
Hstar: (1- ((1-params.t)*params.ubar)/((calcs.wc - params.B - params.ubar)*params.t))
H: (0.9 * calcs.Hstar)
X: (calcs.H*100*params.gamma)
firmExpand: calcs.wc > (((1 - 0.15)*0.9)/(1 + 0.05))
firmContract: calcs.wc < (((1 - 0.15)*0.9)/(1 + 0.05))
no: (calcs.Hstar < 0.5)
nothing: ((params.B + params.ubar + params.ubar*(1-params.t)/(params.t)) > calcs.wc)
something: ((params.B + params.ubar + params.ubar*(1-params.t)/(params.t)) < calcs.wc) layout:
OneGraphPlusSidebar:
graph:
xAxis:
min: 0
max: 1
title: Hours of employment as a fraction of labor supply, H
ticks: 4
yAxis:
intercept: 0
max: 1
title: Wage, w
ticks: 4
objects:
- Curve:
fn: "params.B + params.ubar + params.ubar*(1-params.t)/(params.t*(1-(x))) "
color: cbgreen
samplePoints: 2000
label:
text: "'w^N(H)'"
x: 0.7
position: t
- Line:
yIntercept: calcs.wc
color: cbblue
label:
text: "'w = w^c'"
x: 0.85
- Rectangle:
a: [0,calcs.wc]
b: [1,1]
fill: purple
clipPaths:
- Area:
fn: "params.B + params.ubar + params.ubar*(1-params.t)/(params.t*(1-(x)))"
samplePoints: 200
above: true
show: calcs.something
- Rectangle:
a: [0,calcs.wc]
b: [1, 0]
fill: blue
clipPaths:
- Area:
fn: "params.B + params.ubar + params.ubar*(1-params.t)/(params.t*(1-(x)))"
samplePoints: 200
above: true
show: calcs.something
- Point:
coordinates: [calcs.Hstar, calcs.wc]
droplines:
vertical: calcs.Hstar.toFixed(2)
sidebar:
controls:
- title: Equilibrium in the product and labour markets
- title: Policy Instruments
sliders:
- {param: B, label: B}
- {param: t, label: t}
- {param: b, label: b}
- {param: gamma, label: \\\gamma}
- title: Exogenous variables
sliders:
- {param: ubar, label: u}
- {param: rho, label: \\\rho}
divs:
- html: "`$P = 100$`"
- html: "`$E = 10$`"
- title: Endogenous variables
divs:
- html: "`<table>
<tr>
<td>Real wage rate ($w$):</td>
<td>${calcs.wc.toFixed(2)}</td>
</tr>
<tr>
<td>Employed population ($H$):</td>
<td>${calcs.Hstar.toFixed(2)}</td>
</tr>
</table>`"
show: calcs.something
- title: Endogenous variables
divs:
- html: "`<table>
<tr>
<td>Real wage rate ($w$):</td>
<td> $n/a$ </td>
</tr>
<tr>
<td>Fraction of population employed ($h$):</td>
<td> $n/a$ </td>
</tr>
</table>`"
show: calcs.nothing
- title: Legend
divs:
- html: "`<table>
<tr>
<td>$B$: </td>
<td> unemployment benefits </td>
</tr>
<tr>
<td>$t$: </td>
<td> termination probability </td>
</tr>
<tr>
<td>$b$: </td>
<td> barriers to entry </td>
</tr>
<tr>
<td>$\\\\gamma$: </td>
<td> output per worker </td>
</tr>
<tr>
<td>$u$: </td>
<td> disutility of effort </td>
</tr>
<tr>
<td>$\\\\rho$: </td>
<td> opportunity cost of capital </td>
</tr>
<tr>
<td>$P$: </td>
<td> total population </td>
</tr>
<tr>
<td>$E$: </td>
<td> number of employers </td>
</tr>
</table>`"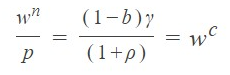
Copy of InteractiveGraphs
By apapad