airmet
analytics case by Anna Riera
4 things we will look at:


Overall Campaign & Data
Overall Campaign & Data
Optimal Campaign Timing
Optimal Station Selection
Seeing it all work together


Overall Campaign & Objectives

Marketing Campaign
Raise Awareness
Boost Acquisition
Docking Stations Takeover
£50,000 Total Budget
£100 creative + £200/week
GOAL OF ANALYSIS
Maximum Reach
High Efficiency

Data Used


cycle_data
station_data
cycle_data
end_station_id
start_station_id
station_data
id
station_data
common keys
3 Week Campaign Duration
OOH Media 2 - 4 weeks
High Exposure to Target audience
| #of Weeks | Fixed Cost | Variable Cost | Total Cost/Station |
|---|---|---|---|
| 3 | 100 | 600 (200*3) | 700 |
50,000 / 700 = 71.42
Budget for 71 Stations
Optimal Campaign Timing
High Season
Jul-Aug
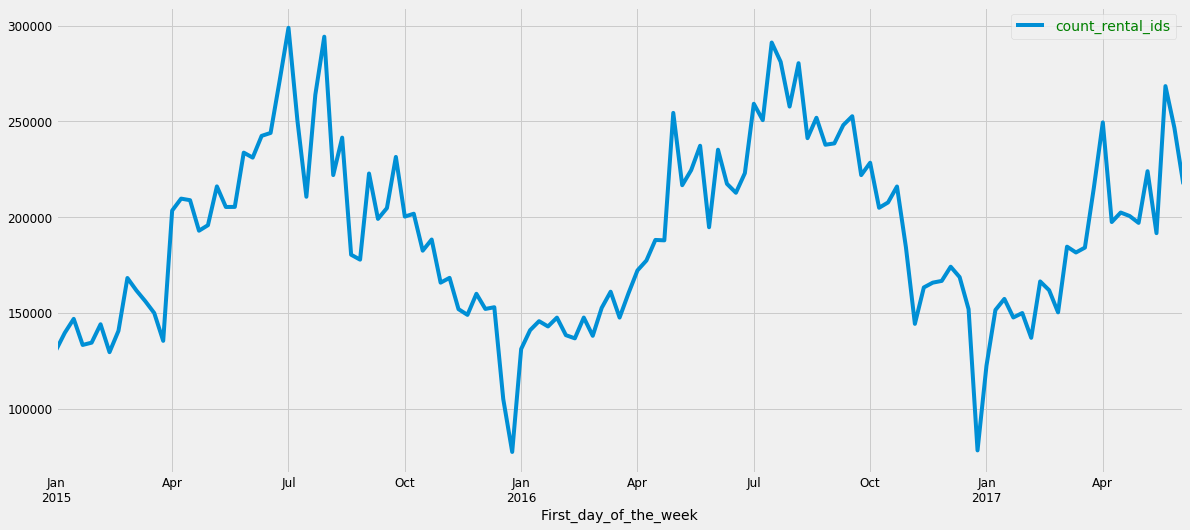
Let´s look at historical weekly rental trends
Low Season
Dec-Jan
Overall Year
Avg. Rentals/week
191,206
Avg. Rentals/week
249,467
Avg. Rentals/week
138,073
+30%
-27%
source: BigQuery London Cycle data - HISTORICAL
The volume of rentals is following a positive trend

| Q1 & Q2 | YOY Growth | |
|---|---|---|
| 2015 | 3,507,022 | |
| 2016 | 3,743,228 | 6,7% |
| 2017 | 4,087,084 | 9,2% |
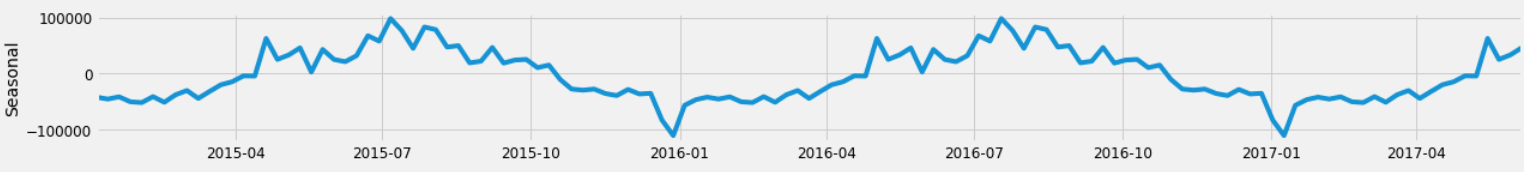
We can clearly identify seasonality
source: BigQuery London Cycle data - HISTORICAL
Building a predictive model
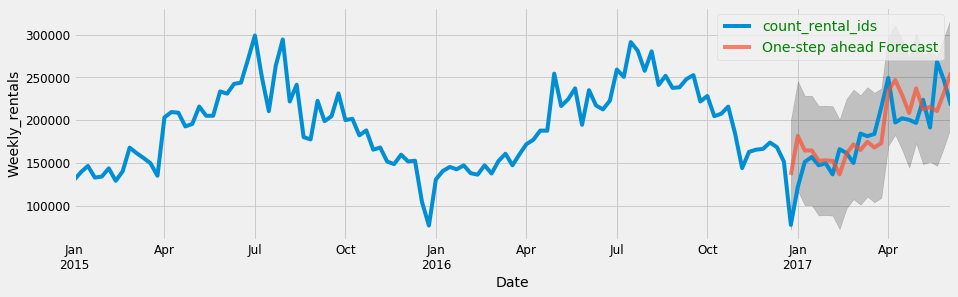
Test with historical data for validation
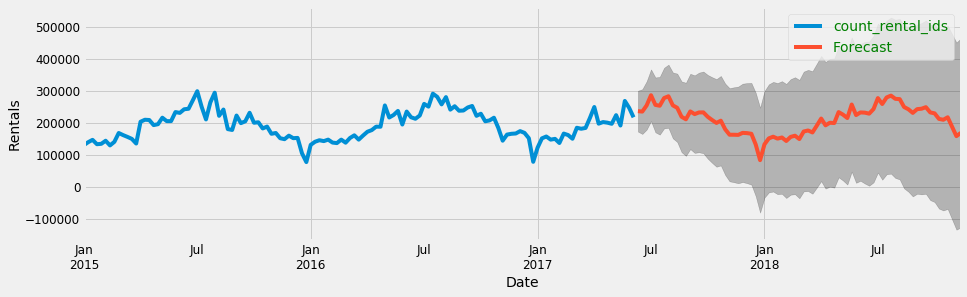
Predictive model applied for Forecasting

Rolling 3 weeks the forecast to define optimal
campaign timing
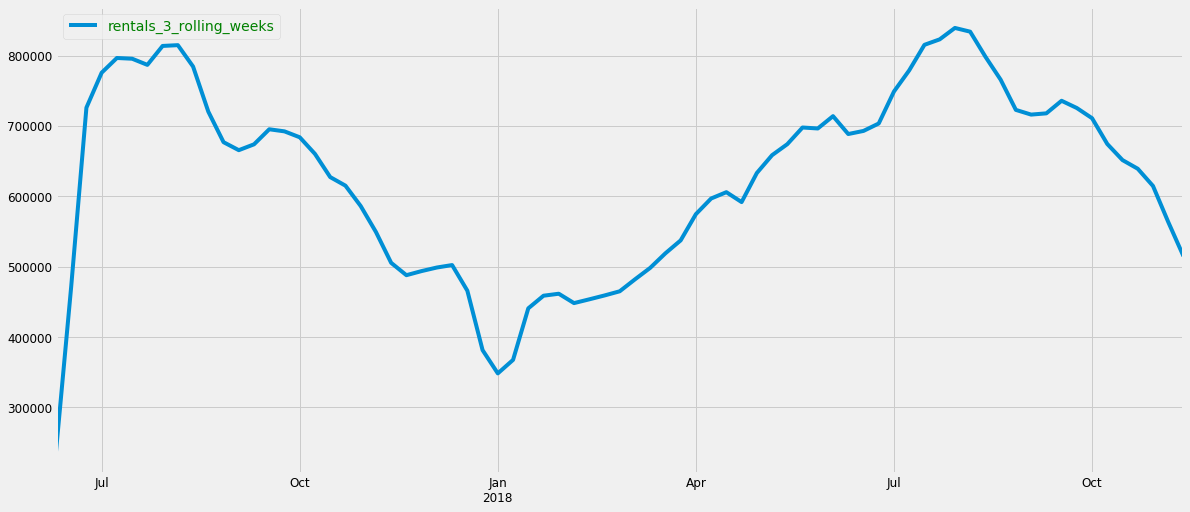
Campaign optimal window in rental volume
from 16-07-2018 until 05-08-2018
source: BigQuery London Cycle data - HISTORICAL
Optimal
Station
Selection
Is seasonality also present by month depending on station?
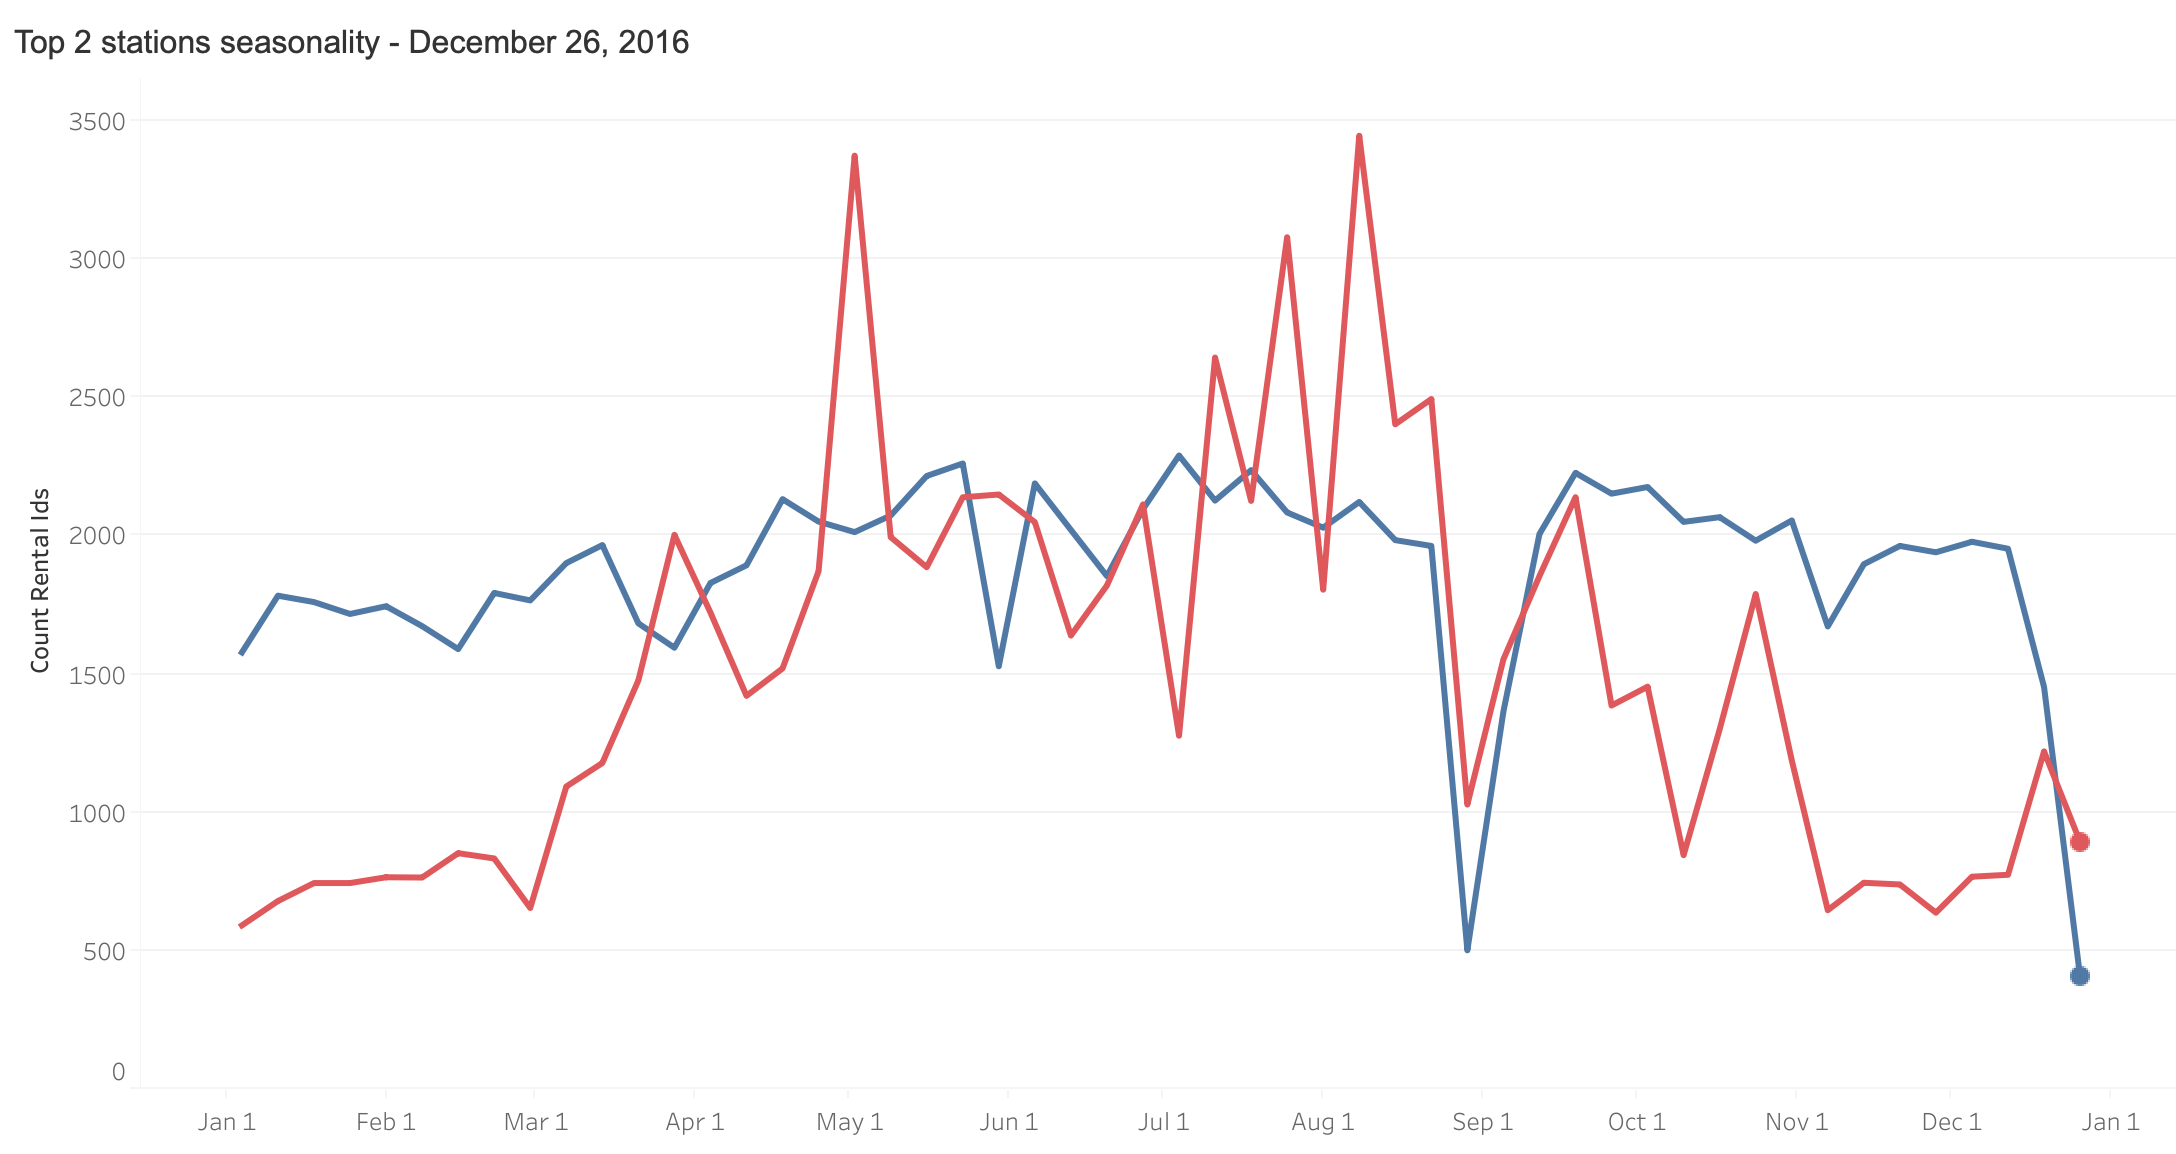
14.Belgrove Street - Kings Cross
19.Hyde Park Corner, Hyde Park
source: BigQuery London Cycle data - HISTORICAL
Is seasonality also present by month depending on station?
14.Belgrove Street - Kings Cross
19.Hyde Park Corner, Hyde Park
We will narrow our dataset to peak performance months - Jul & Aug
Yes!
Let´s narrow the analysis to Top Performing Stations
in the months of July & August by TOUCHPOINTS

1 Rental = 2 Touchpoints
Start Station
End Station
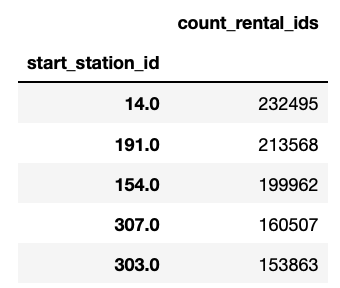
Sorting Station performance by Touchpoint Volume
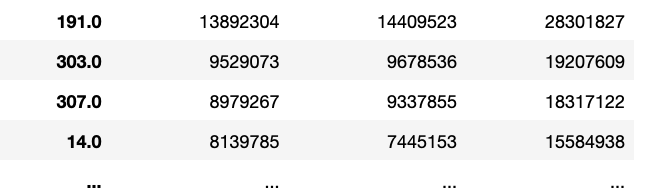
station_id
#_rent_start
#_rent_end
total_touchp
source: BigQuery London Cycle data - July&August - 2015,2016. 124 Days
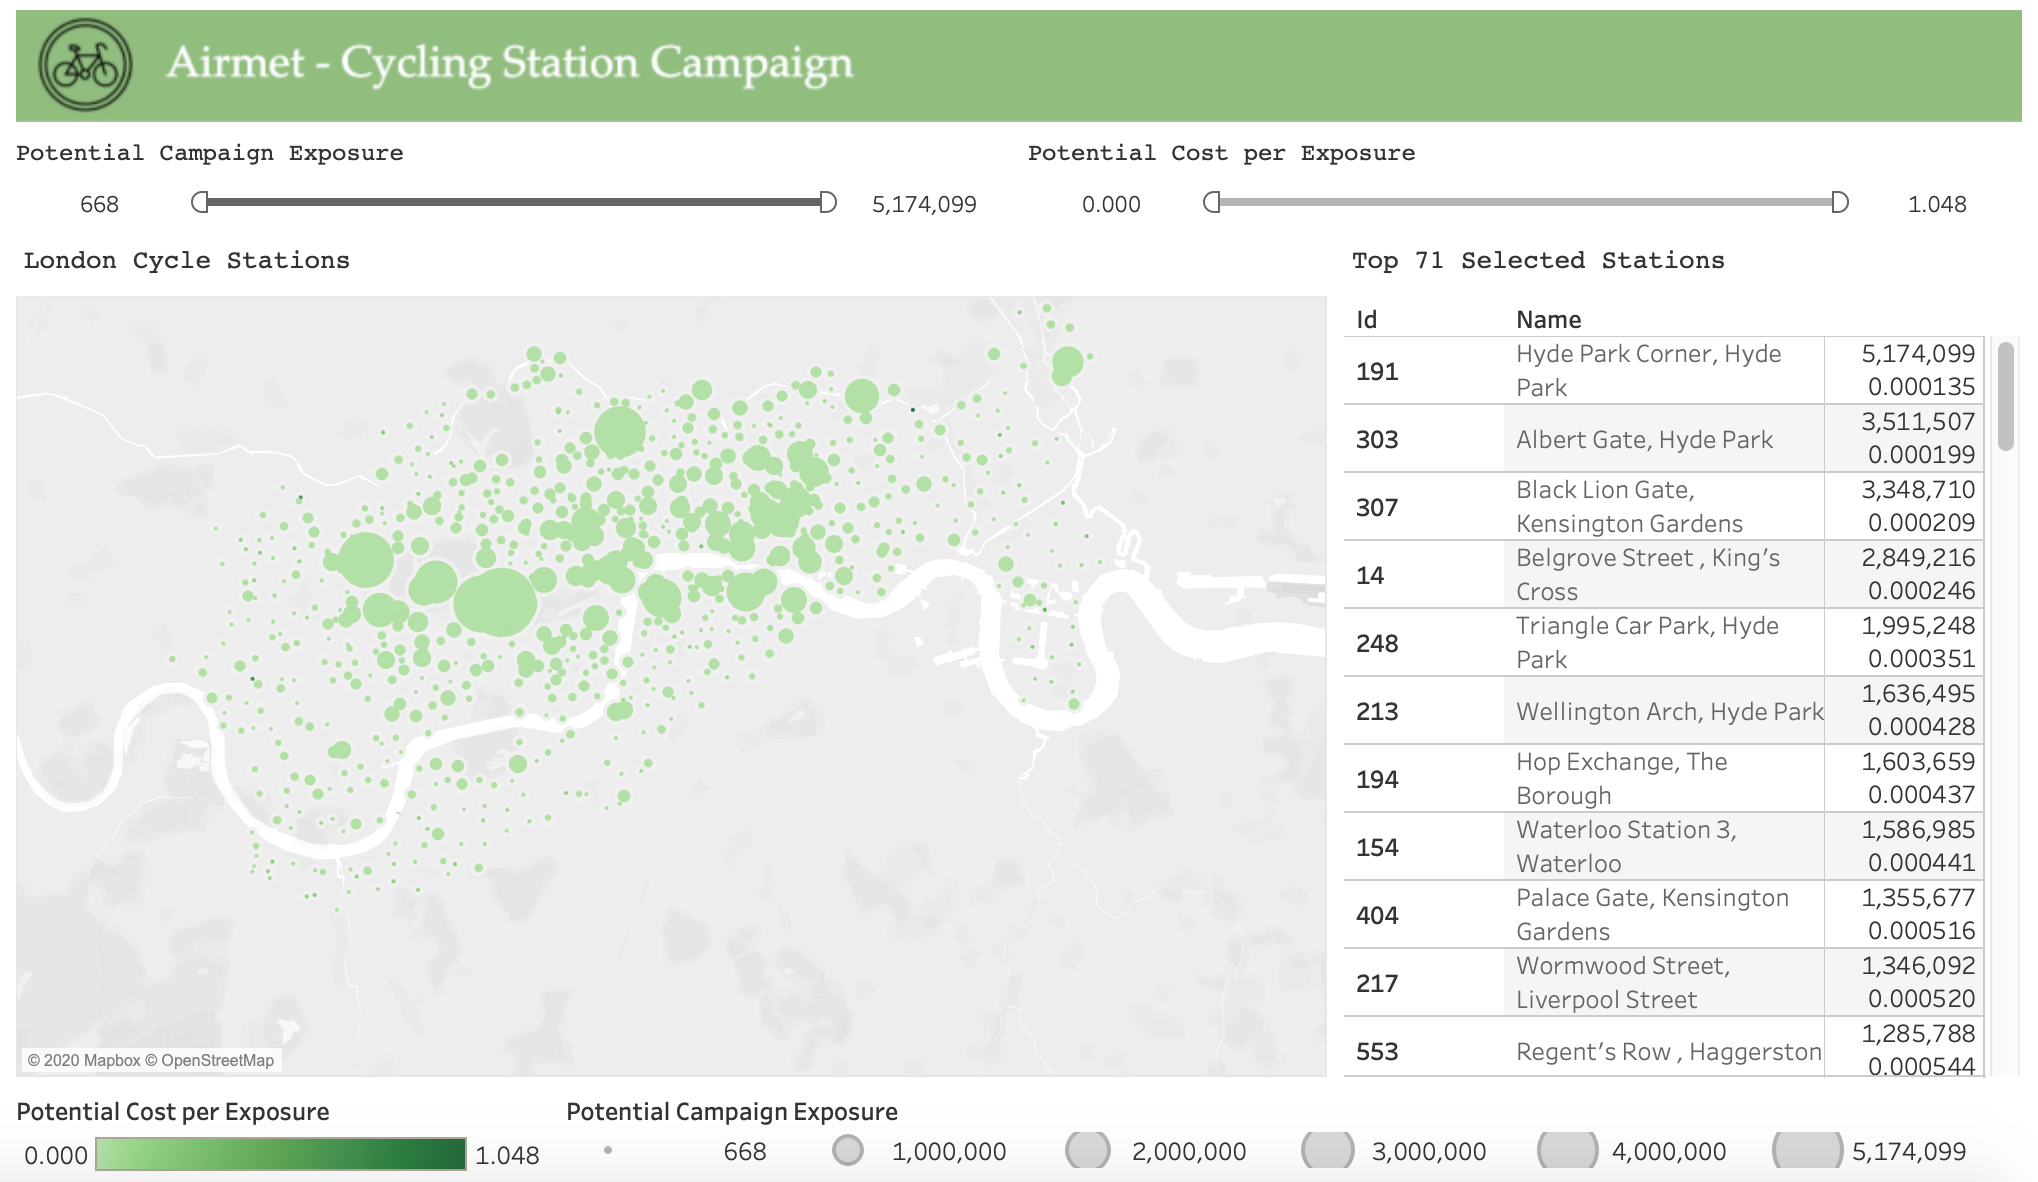
Station Selection Measurement
Observed Touchpoints
Potential Campaign Exposure
Potential Cost per Exposure
Sum of rentals per start station
+
Sum of rentals per end station
(Observed Touchpoints /124 days in date range)
X( 21 days in planned campaign)
X( 1.0795 Avg. Yearly Growth Rate)
source: BigQuery London Cycle data - July&August - 2015,2016 - 124 Days
700 cost per station / Potential Campaign Exposure
Seeing it all
work together
Airmet - Cycling Station Campaign

thank you
Airmet Case Study
By arierapa


