JUNE:
Modelling the spread of Covid-19 in the UK
June Dalziel Almeida
Box models
Individual based models
Differential equations averaging over the source population
\frac{dS}{d t} = - \beta S I
Susceptible
Infected
Follow individuals in the population
S
I
R
Introduce regional differences
As opposed to box models, can simulate the effect of interventions
(20-th century spanish flu)
(2000's influenza)
Examples: Imperial College (UK), Flute (US)
Individual based models
- Infection transmitted through social interactions
- Interactions take place in social groupings: household / school / work place / wider community
- Interactions take place in pre-defined daily timesteps of fixed duration and strength
- Infection transmitted probabilistically
A COVID-19 model of the 2020's
- Modular: Parameters changed easily, can be extracted from different distributions A tool for epidemiologists
- Allow time evolution of parameters (infectionsness evolution)
- Most important is mixing different scales and age groups: Realistic people that do realistic things
- Include uncertainties (e.g. combining data from different countries)
- All written in Python, by O(10) people
Individual based models can focus on how to get us out of lockdown!
- Test, track and trace (with a certain accuracy)
- Building closures
- Individual's complacency
- How hospitals manage their occupation and the availability of ICU beds
Creating a digital twin of the UK
- Population density
- Tourism
- Commuting
- etc.
Why?
The UK is not homogeneous
Somethings are homogeneous, though...
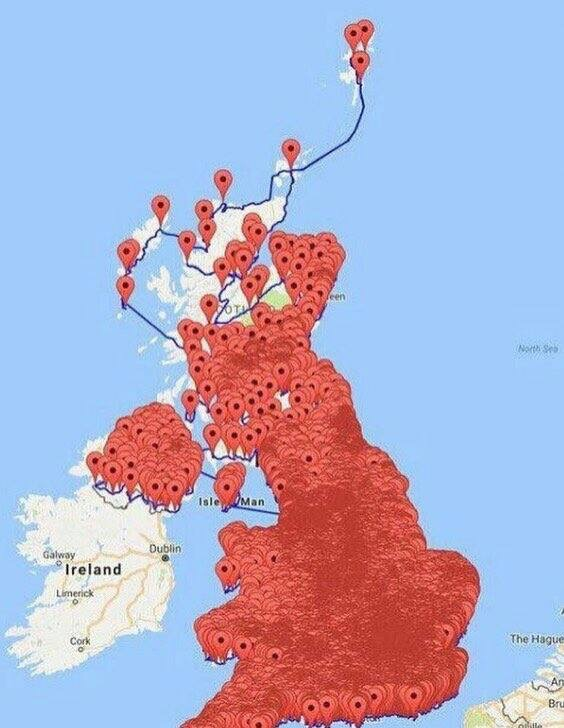
Pubs in the UK
How?
We use census data (mainly from NOMIS) to populate the UK with a realistic population.
Output areas as our statistical unit
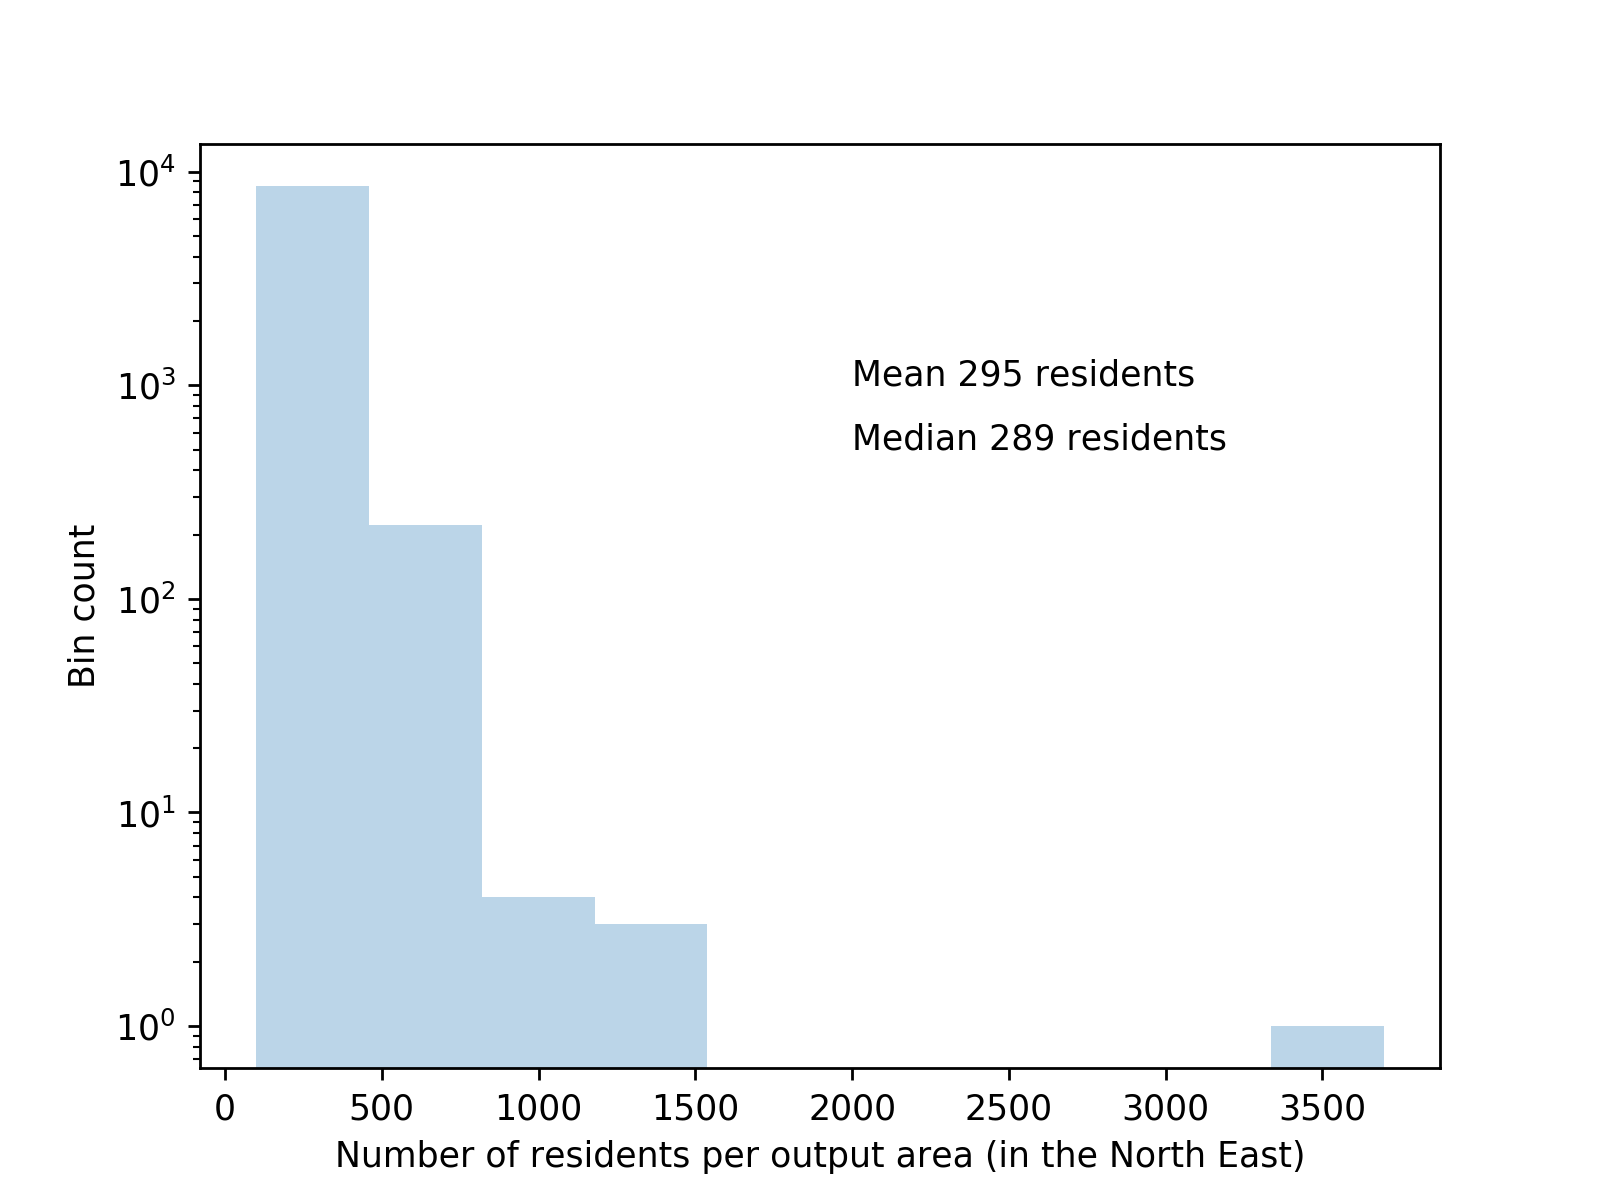
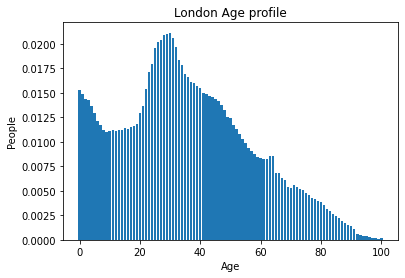
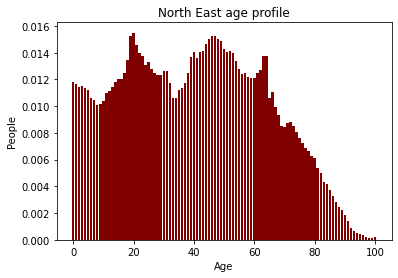
Demographics
We use data (NOMIS) on age, sex, and living arrangements to create households.
Age/sex distribution.
- Number of households that contain at least one person over 65 years old.
- Number of couples
- ....


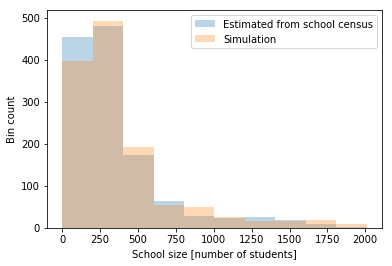
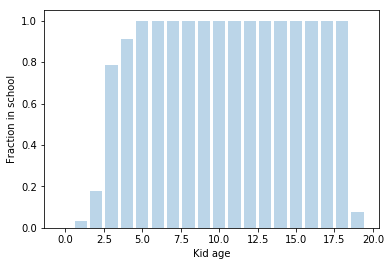
Schools
Data on every school in England & Wales
- Age range
- Location (coordinates)
- Number of pupils
Nearest Neighbour search with KD trees ->
Assign each kid to the closest school that fits their age range.
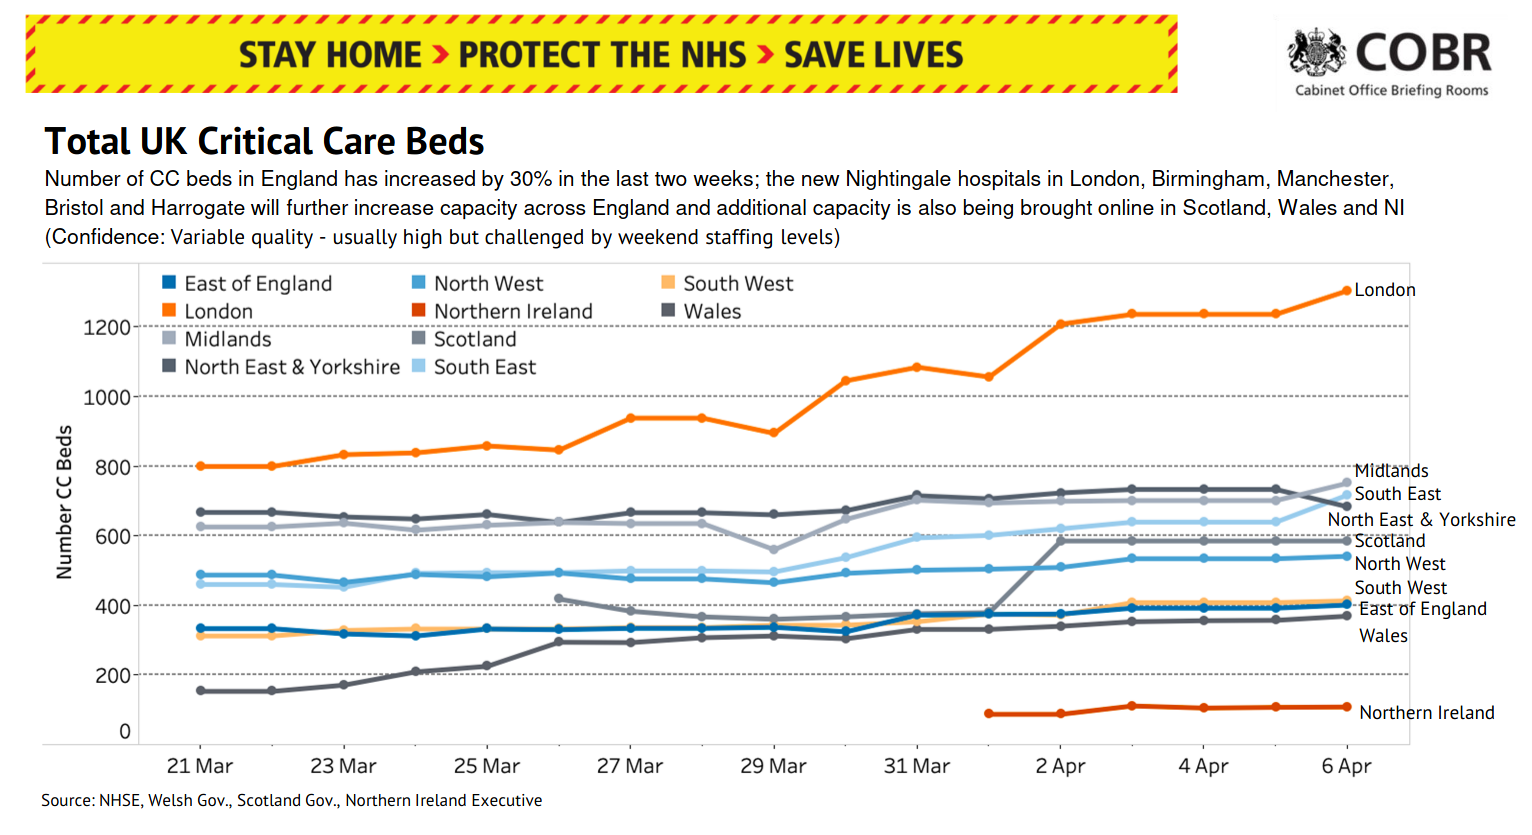
Hospitals
Data on every hospital in England & Wales
- Location (coordinates)
- Number of beds
- Similar to schools, organize hospitals in a NN tree.
- When someone's symptoms are serious enough, we put him in nearest non-full hospital, up to a maximum distance.
Hospitals
(One of the ) challenges: hospital capacity scales with the number of infected.
Workplace
- For every OA we know at which industry sector everyone works.
- We also know where all business/industries are.
- We use flow data to match the two.

Flow data
Durham, works in sector X
Newcastle, industry sector X
Social mixing
Interactions between individuals of different age is critically important
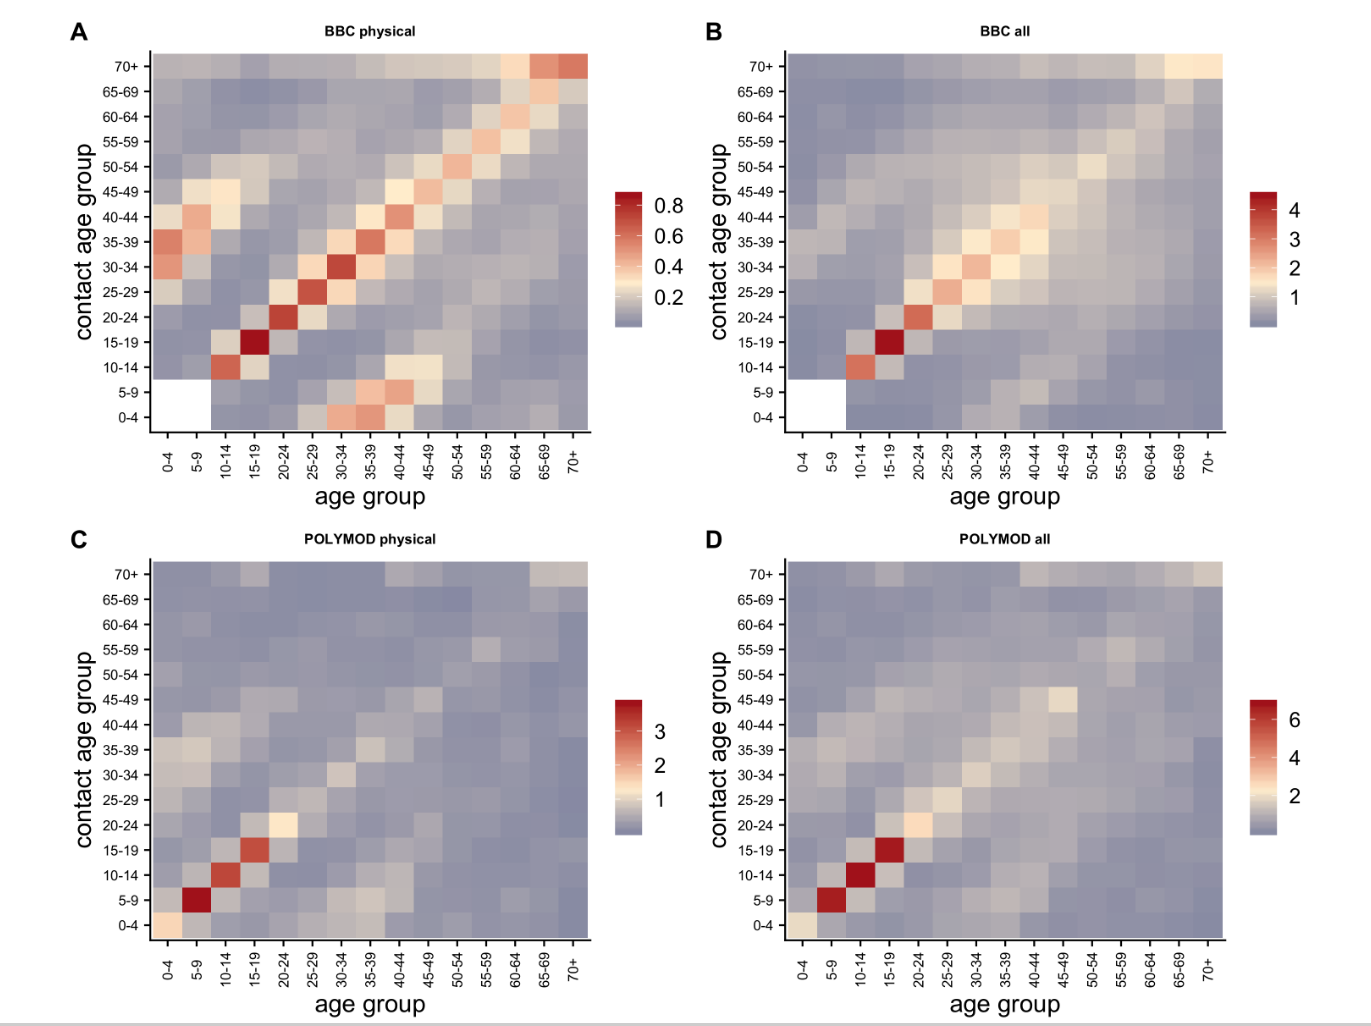
Mean number of contacts per day between two different age groups
Matrices also depend on location (work, school, etc.)
National travel (by rail)
- Data on number of travelers at the 15 largest UK cities (internal commutes excluded).
- We match the number of people at each station to infer travel routes in a probabilistic way.
London
Manchester
Liverpool
Birmingham
p \propto n(\mathrm{Manchester}) \times \mathrm{Connection \; quality}
How to help
- Carol (carolina.cuesta-lazaro@durham.ac.uk)
- Arnau (arnau.quera-bofarull@durham.ac.uk)
Still lots of work to do in
- Data processing
- Code optimization
- New features in the digital twin
- Testing
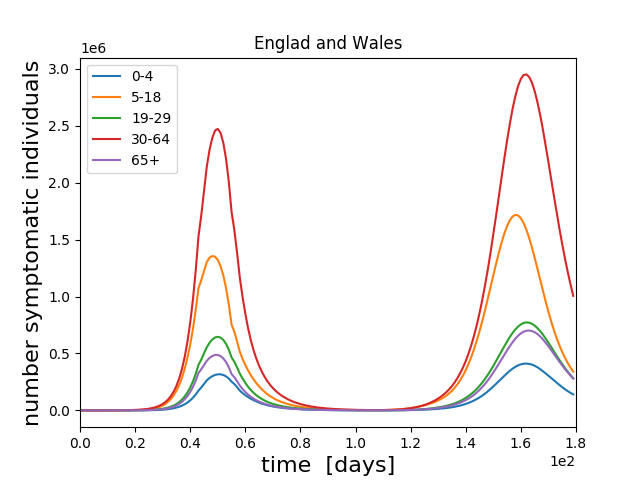
Simulating Covid-19
By arnauqb


