JUNE:
Modelling the spread of Covid-19 in the UK
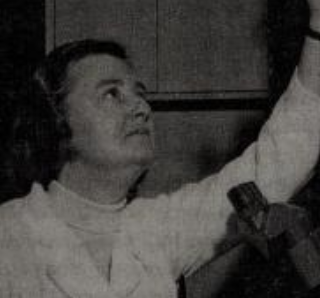
June Dalziel Almeida
Creating a UK digital twin
- Population density
- Tourism
- Commuting
- etc.
Why?
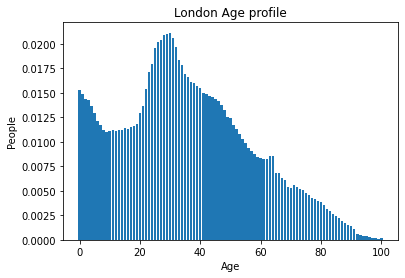
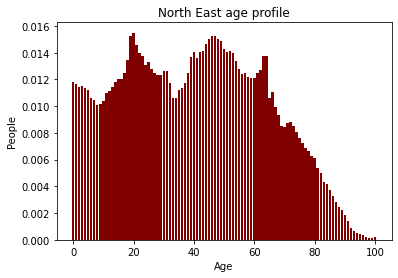
The UK is not homogeneous
Some things are homogeneous, though...
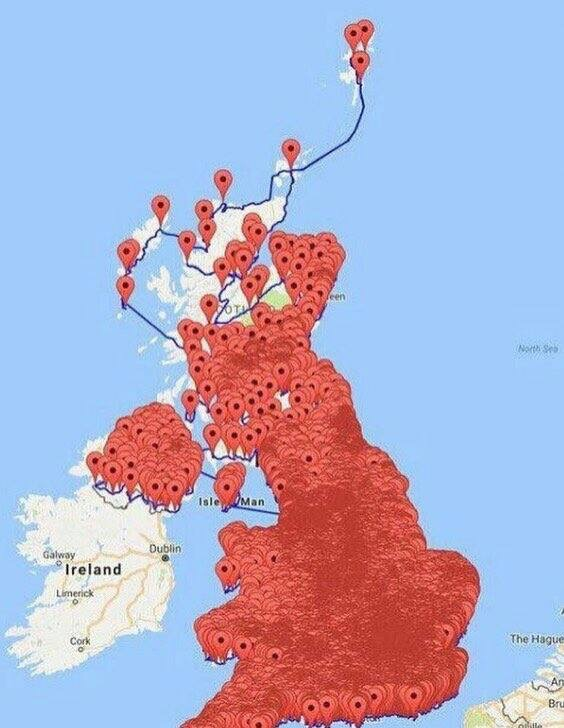
Pubs in the UK
How?
We use census data (mainly from NOMIS) to populate the UK with a realistic population.
Output areas as our statistical unit

Source : ukdataservice.ac.uk
- Output area's population ~ 300 residents.
- England & Wales contain 180k OAs
Available information at the OA level
- Single year age for every resident
- Sex in ~5 years bins
- Socio-economic index of the area
- Ethnicity
- Household composition
- Number of students
- Industry sector of workers
- Communal establishments
- Carehomes
- etc...
Households
We use data (NOMIS) on age, sex, and living arrangements to create households.
Age/sex distribution.
- Number of households that contain at least one person over 65 years old.
- Number of couples
- ....


Households


Care Homes
- ~380k people live in care homes in EW in ~15k carehomes.
- Care homes are filled by first born first served basis.
- Care homes have three subgroups: residents, workers, and visitors
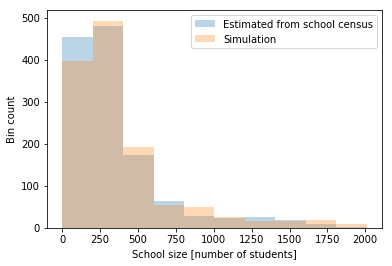
Schools
Data on every school in England & Wales
- Age range
- Location (coordinates)
- Number of pupils
Assign each kid to the closest school that fits their age range.
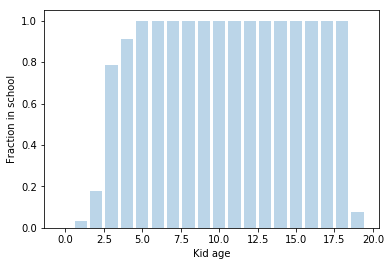
- Kids are subdivided into year groups
- We add teachers assuming constant ratio.
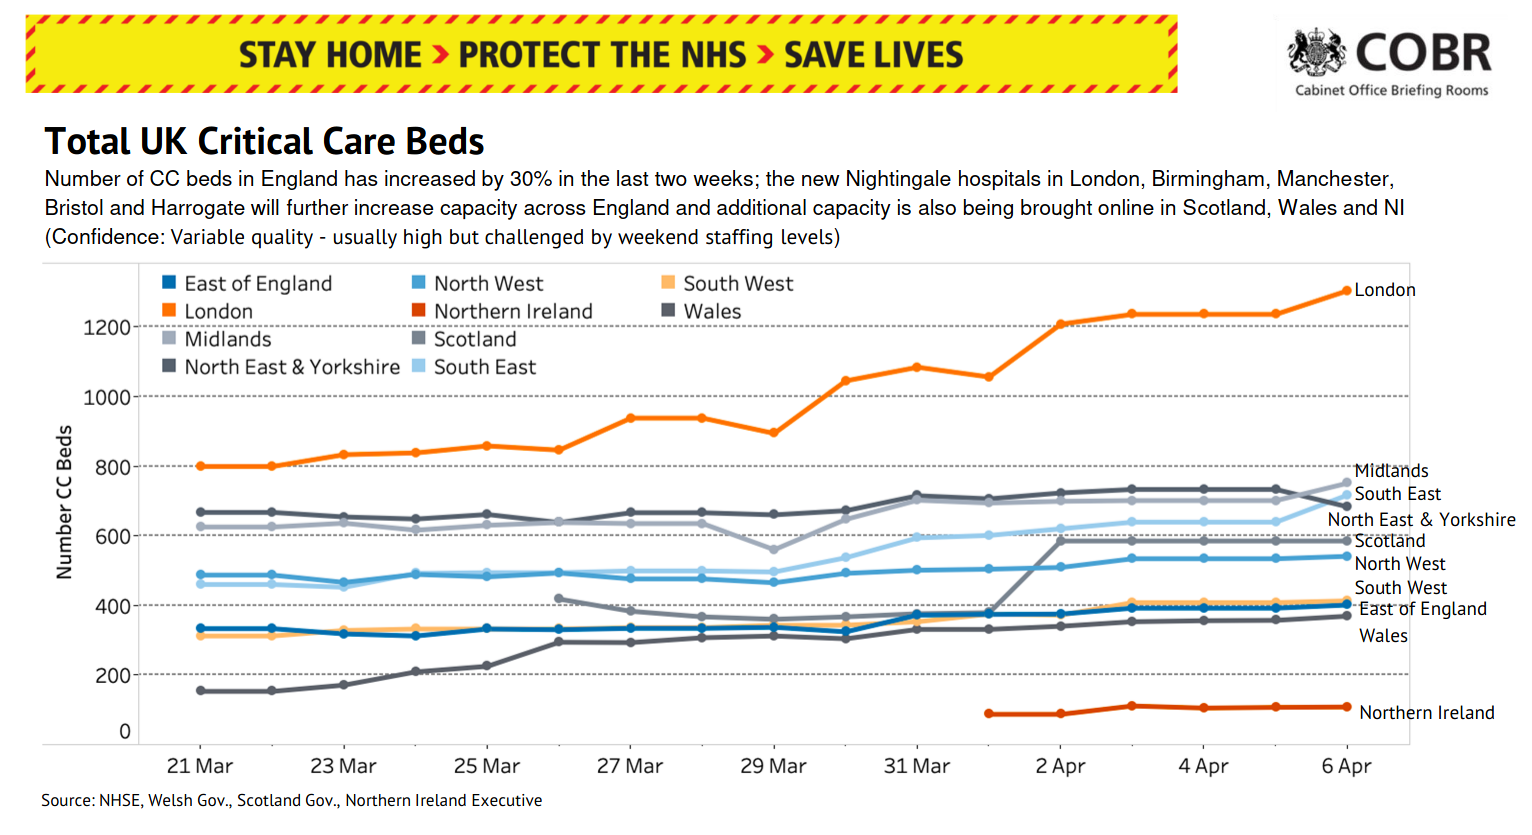
Hospitals
Data on every hospital in England & Wales
- Location (coordinates)
- Number of beds
- Similar to schools, organize hospitals in a NN tree.
- Infected people are sent to a certain Hospital based on distance and active policies.
- Every hospital contains 3 subgroups: medics, patients, and ICU patients.
Hospitals
We also (plan to) model
- Regular hospital admission rates (including additional subgroups)
- Number of ICU beds over time
Workplace
- For every OA we know at which industry sector everyone works.
- We also know where all business/industries are.
- We use flow data to match the two.

Flow data
Durham, works in sector X
Newcastle, industry sector X
Sector info also used for medics and teachers.
Commute
- From census data, we know the method of transport people use.
- Two kinds: Inner city commute, outer city commute
Hub

Hub
- Train carriage's passengers randomised every day.
- Intensity factor captures busy times
National travel (by rail)
- Data on number of travelers at the 15 largest UK cities (internal commutes excluded).
- We match the number of people at each station to infer travel routes in a probabilistic way.
London
Manchester
Liverpool
Birmingham
p \propto n(\mathrm{Manchester}) \times \mathrm{Connection \; quality}
Leisure
- Our virtual residents also enjoy different leisure activities.
- So far: pubs, grocery shopping, and cinemas
- We use exact locations of all Pubs and Cinemas, and a distribution of groceries at the super area level.
- Each "Social Venue" attracts different people depending on their characteristics.
- Probability of dragging the household depending on activity.
JUNE UK digital twin
By arnauqb


