Thinking in data
a wokshop
arogya koirala
tech+innovation@kll
Data opportunities are everywhere.
-
Formulate a question.
-
Make definitions.
-
Think about the data that’ll help you answer the question. Collect it.
-
Visualize.
-
Generate summary statistics
-
Don't stop there, ask "so what"?
-
Get a feel for variation.
Meetings always seem to start late. Is that really true?
What does data look like?
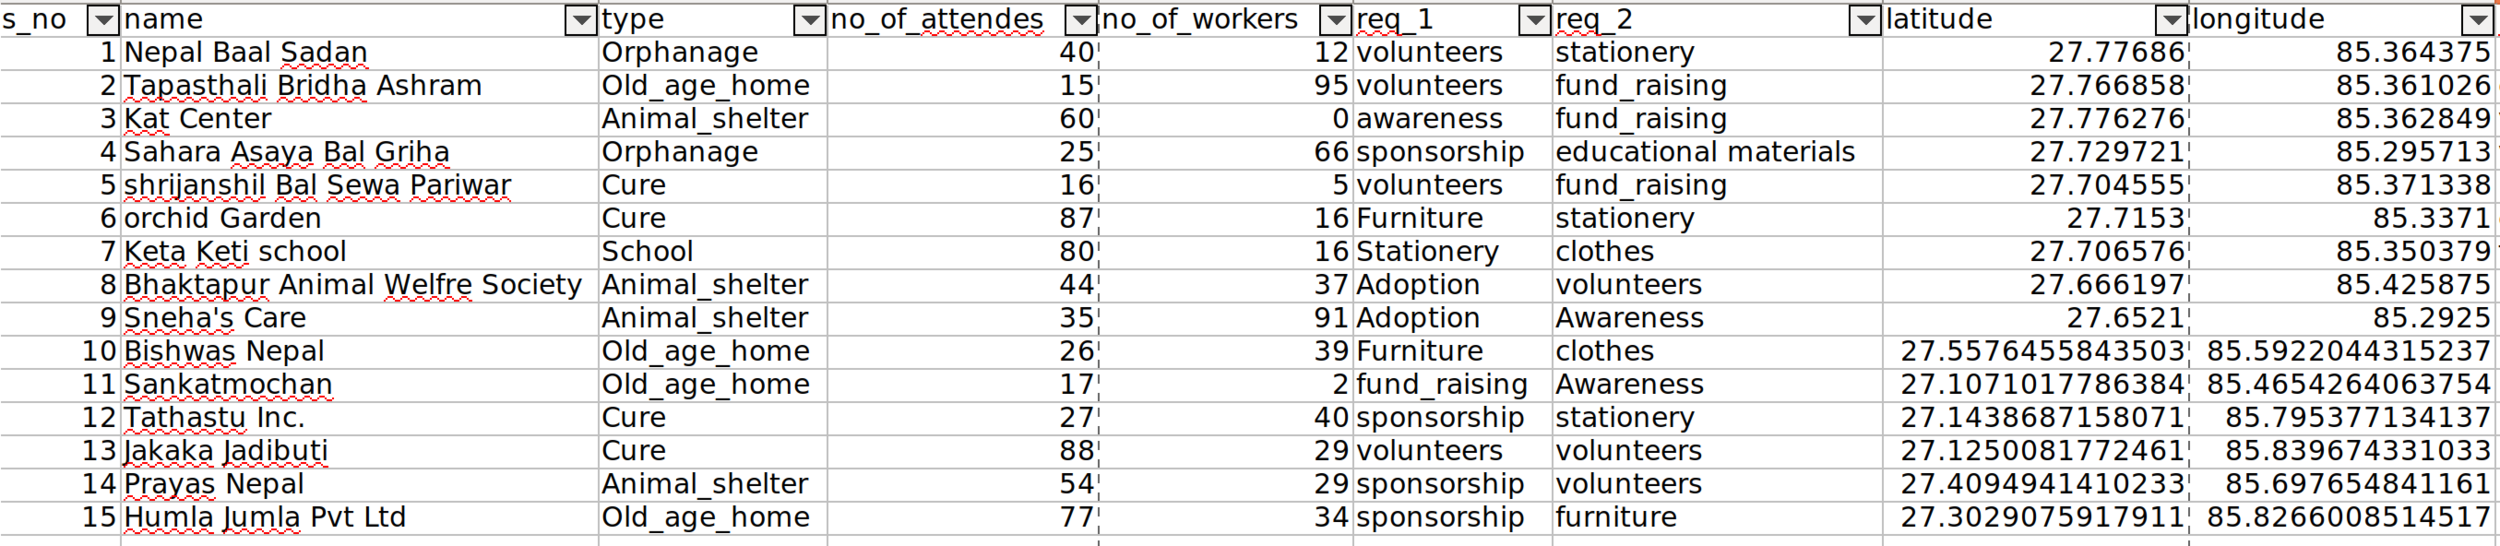
geographical
categorical
numerical
What data looks like to me...
- Is this the only form of data?
geographical
categorical
numerical
Notes on categorical data
- There should be a finite number of categories.
- Possibilities: frequency tables, cross-tabulations histograms, pie/donut/bar charts
geographical
categorical
numerical
Notes on numerical data
- Possibilities: summary statistics, box-and whisker plots, histograms, scatter plots and many more
Notes on structuring data
Each row is an observation, each column is an attribute.
- Good practice: one data point per column
- Good practice: higher granularity is always preferred
Thinking in data
By Arogya Koirala


