Measuring vertical track irregularities from instrumented heavy haul railway vehicle data using machine learning
Arthur Cancellieri Pires
Mechanical Engineer
Data Scientist


23/11/2021
Who I am
- Bachelors in Mechanical Engineering from UFES
- Cursando? Master's degree at Unicamp
- Machine learning and data science enthusiast
- Researcher at Lafer (Railway laboratory) in Unicamp
- Volunteer researcher from LabTDF at UFES

Arthur Pires
Today's presentation
- Introduction
- Objectives
- Methodology
- Results
- Future studies
Today's presentation
- Introduction
- Objectives
- Methodology
- Results
- Future studies
Introduction
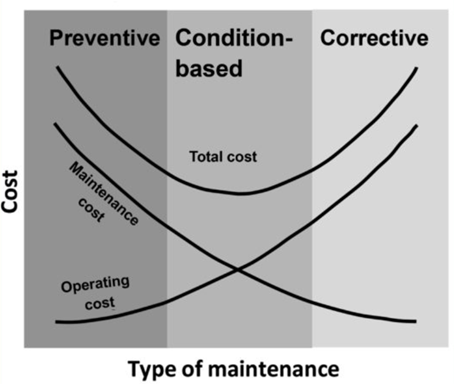
Typical railway problems
- Asset degradation
- Maintenance planning
- Maintenance cost
Advantages of CBM
- Continuous monitoring
- Increased safety
- Optimal planning
- Lower cost
Introduction
There are two main ways of quantifying track quality:
- Monitor track irregularities (more common)
- Monitor the dynamic response of the wagon to the track excitations
Introduction
There are two main ways of quantifying track quality:
- Monitor track irregularities (more common)
- Monitor the dynamic response of the wagon to the track excitations
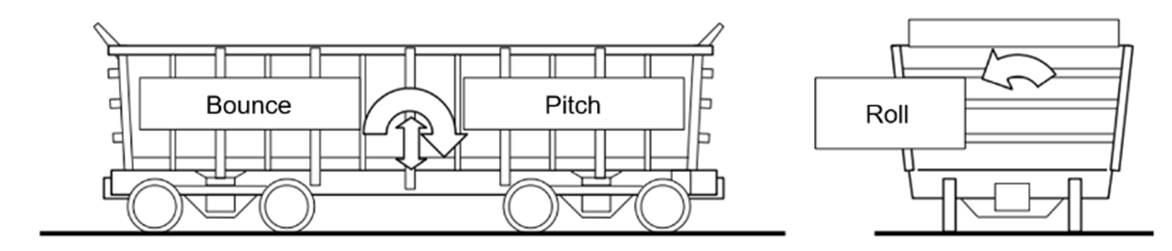
Carbody
Suspension
Track excitations
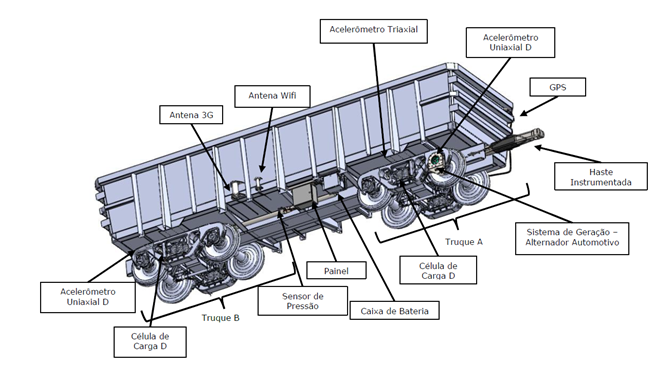
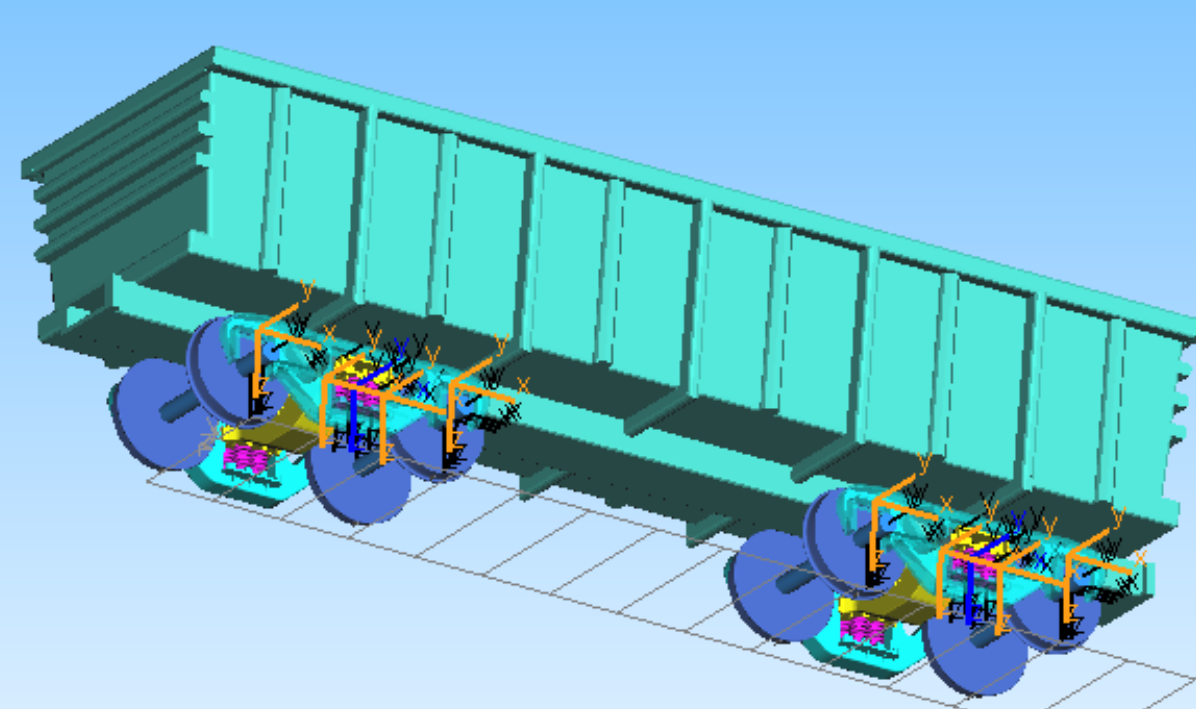
Introduction
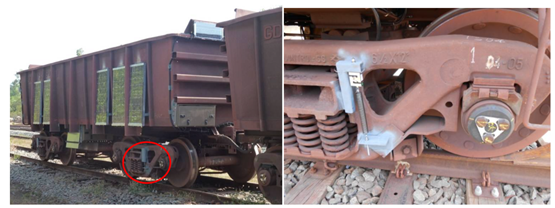
Figure: Instrumented railway vehicle (IRV)
Today's presentation
- Introduction
- Objectives
- Methodology
- Results
- Future studies
Objectives
- Create models that use IRV data to measure and monitor railway parameters;
- Verify if the current instrumentation of the BRA1 IRV is capable of measuring track irregularities;
- Achieve a root mean squared error (RMSE) better than 0.66 mm (results obtained by Urda et al.)
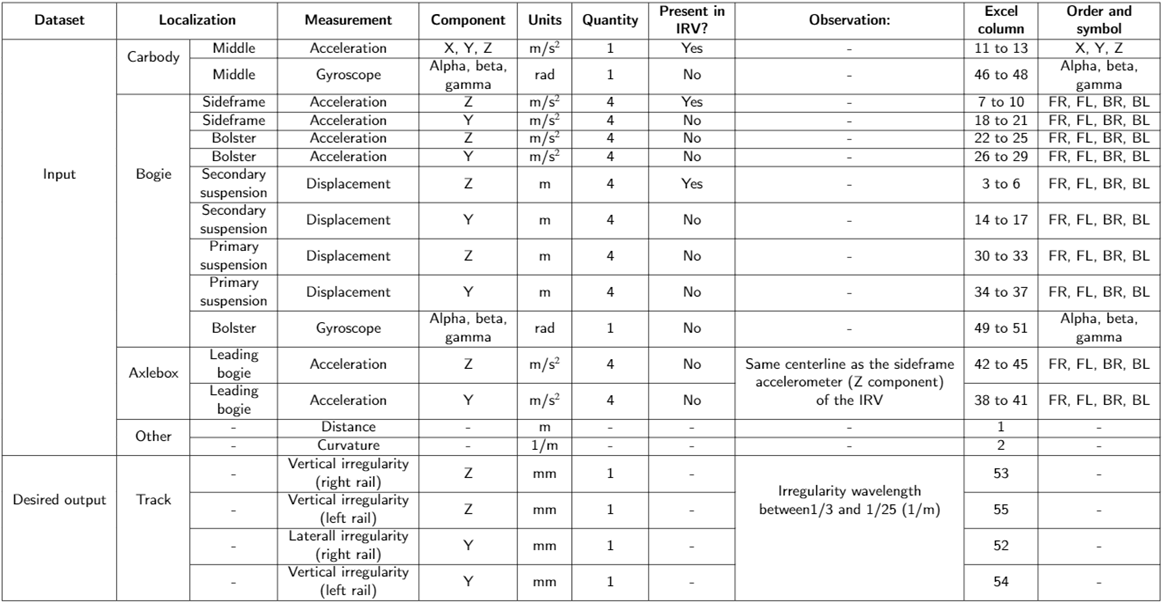
IRV data
Data driven models
Track irregularities
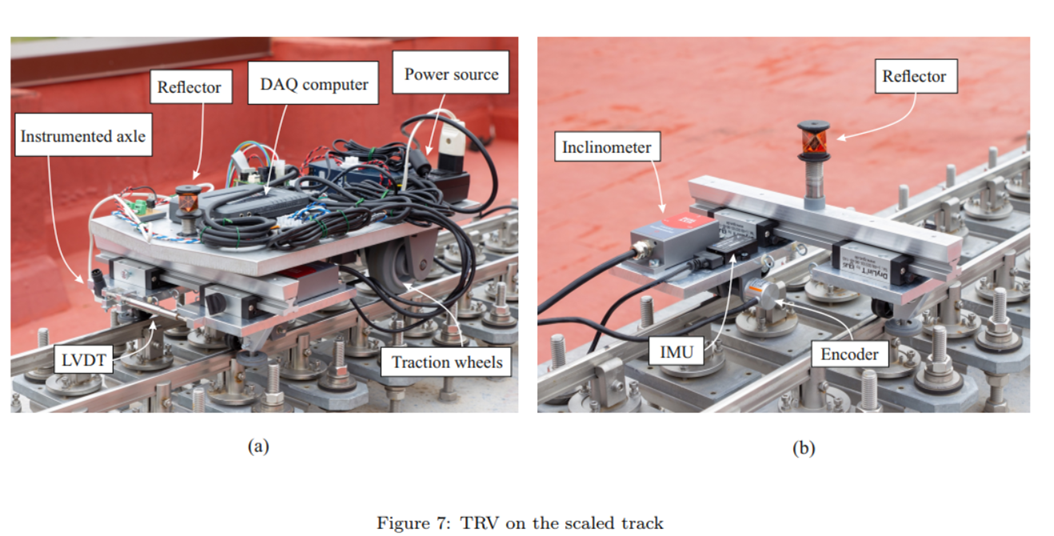
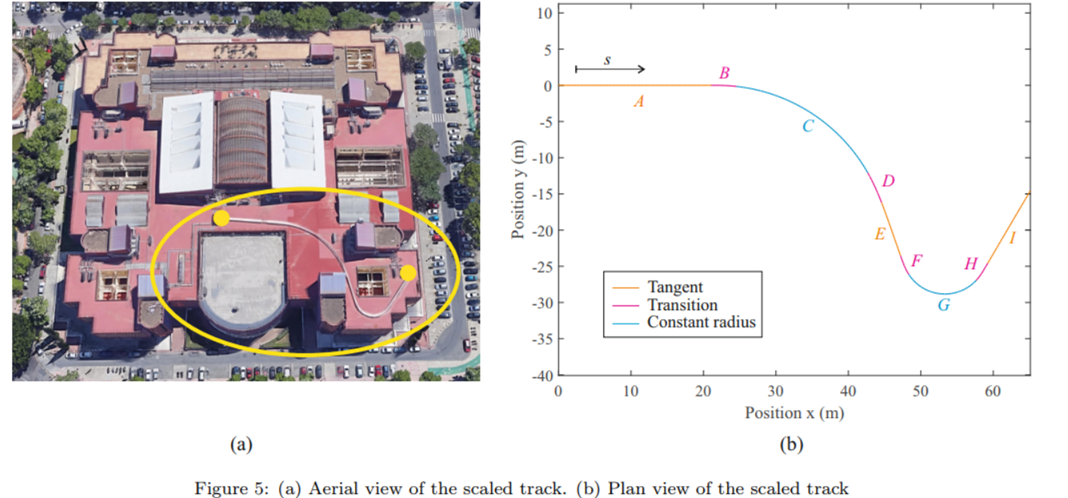
Article: Experimental measurement of track irregularities using a scaled track recording vehicle and kalman filtering techniques
Author: Pedro Urda et al;
Date: 2021
Objectives:
- Estimate track irregularities using a scaled IRV and Kalman filters
- Compare the proposed method with a previous publication


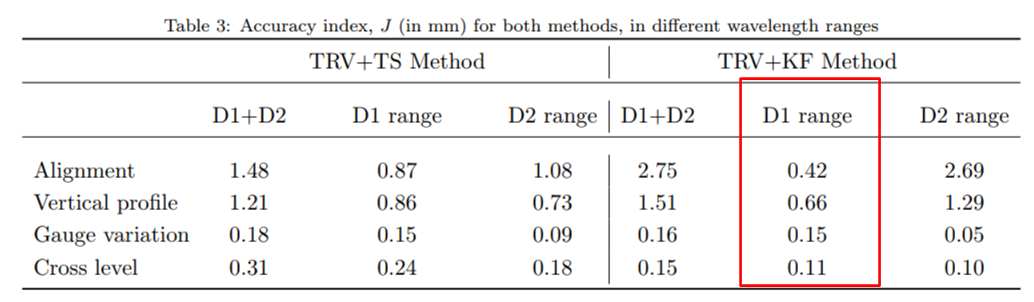
Specific objective:
- Obtain a RMSE lower than 0.66 m and 0.42 m for vertical and lateral irregularities respectively;
- Use class D1 wavelength.
Today's presentation
- Introduction
- Objectives
- Methodology
- Results
- Future studies
Methodology
Data analysis
Machine learning
Dynamic simulation
Methodology
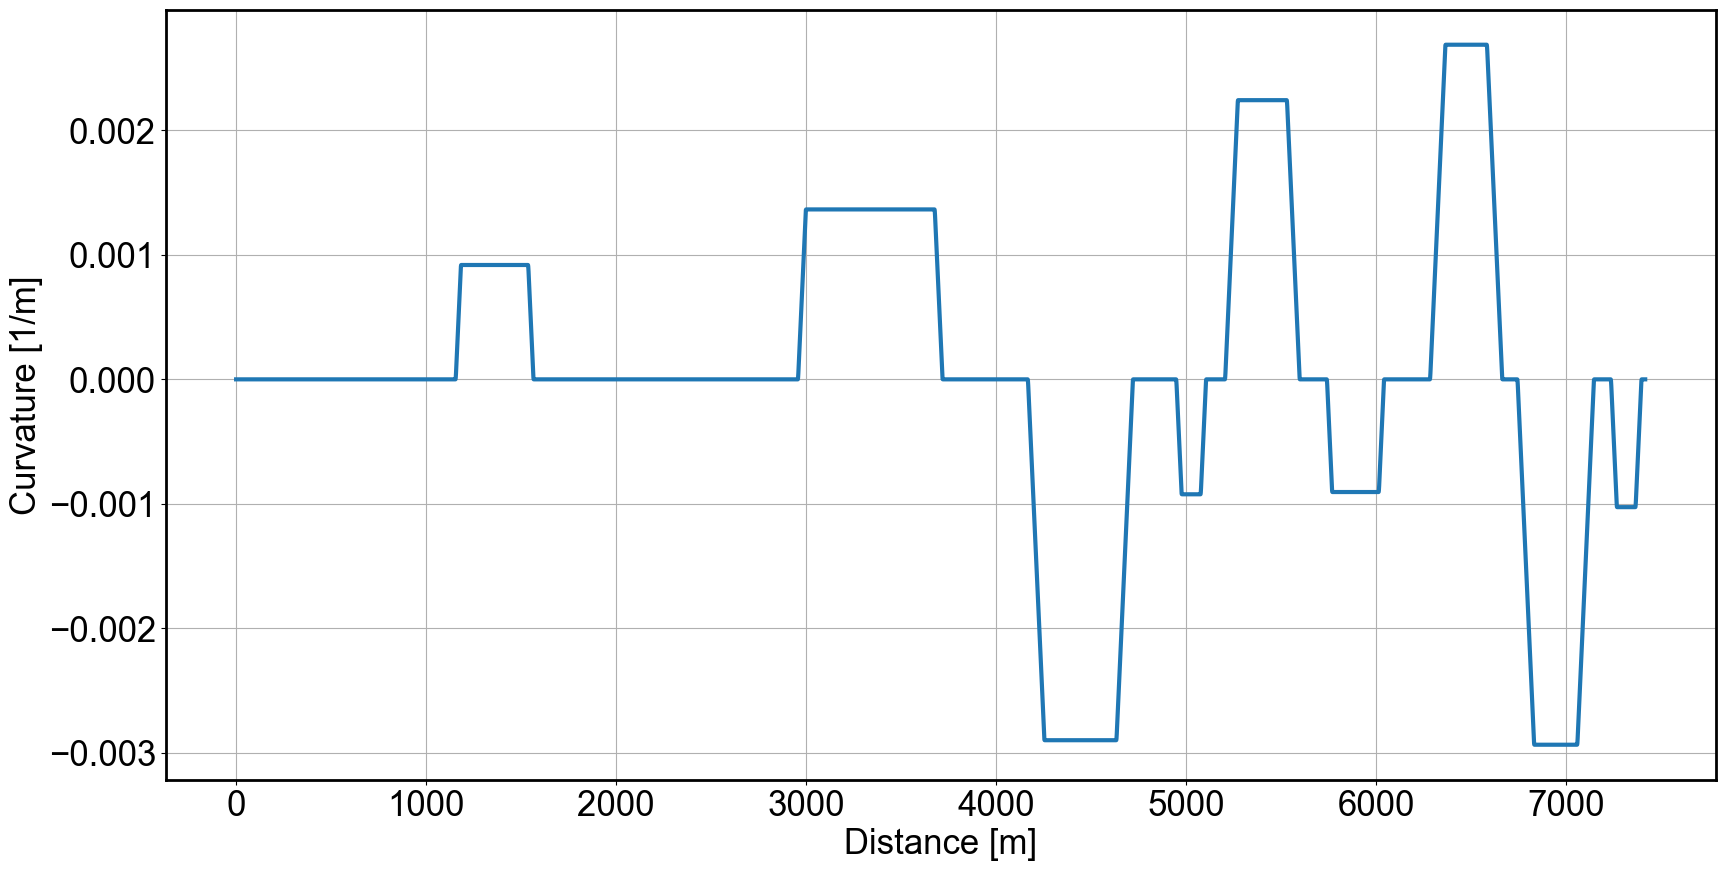
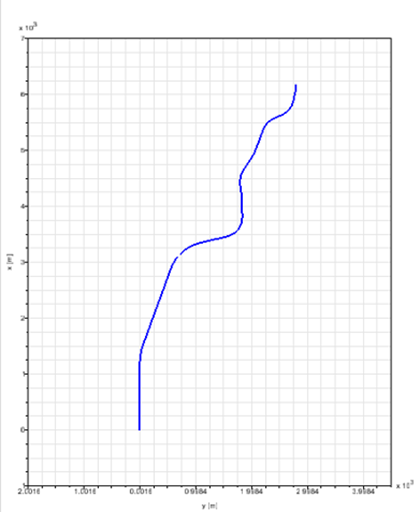
Dynamic simulation
Track geometry
IRV model
- Wagon: GDE Ride Control
- Wheel profile: Design 3
- Rail profile: TR 68
- Velocity: 10.8 m/s (constant)
Track irregularities
Dataset
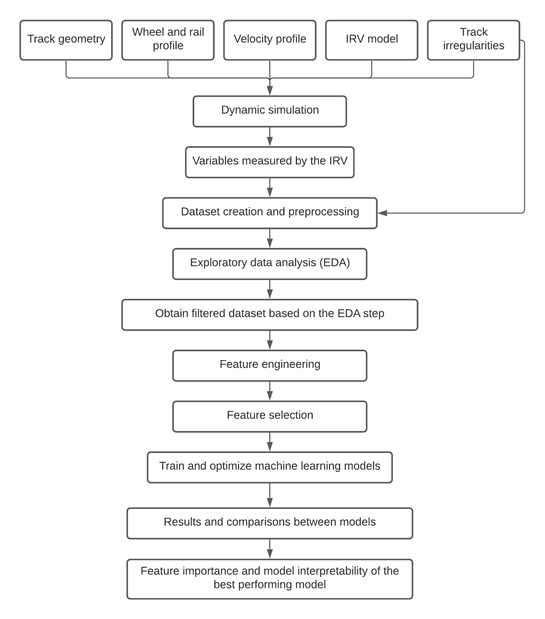
Methodology
Data Science
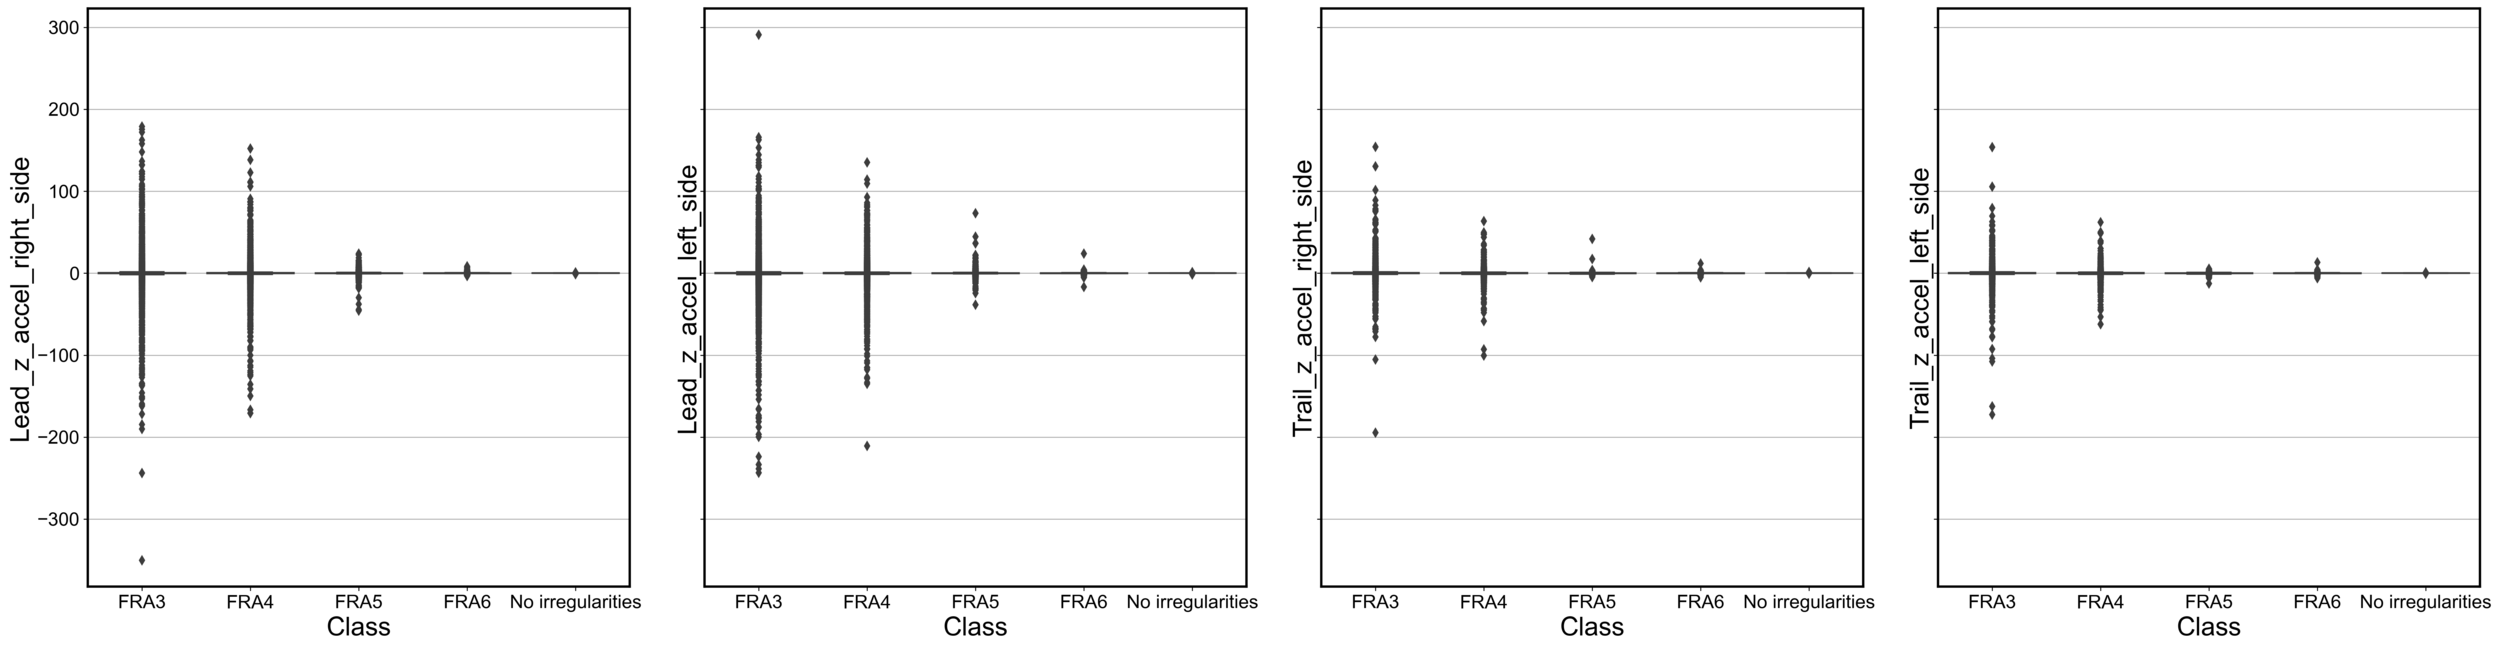
EDA - Outliers
EDA - Outliers
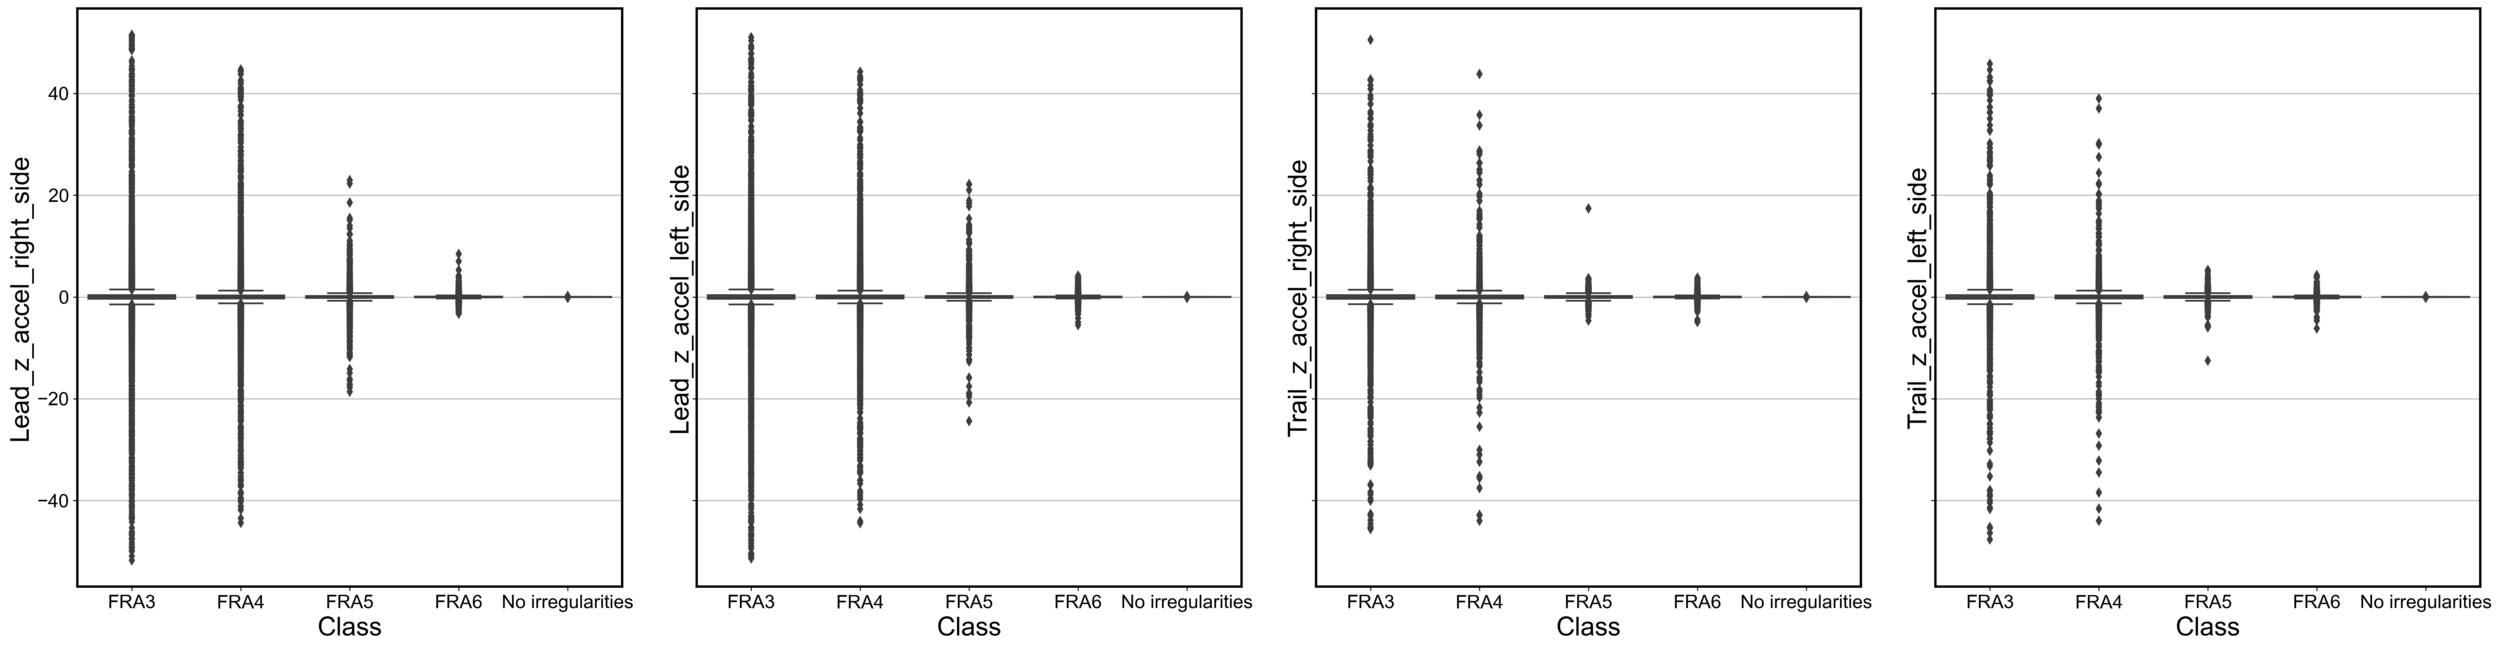
After outlier removal
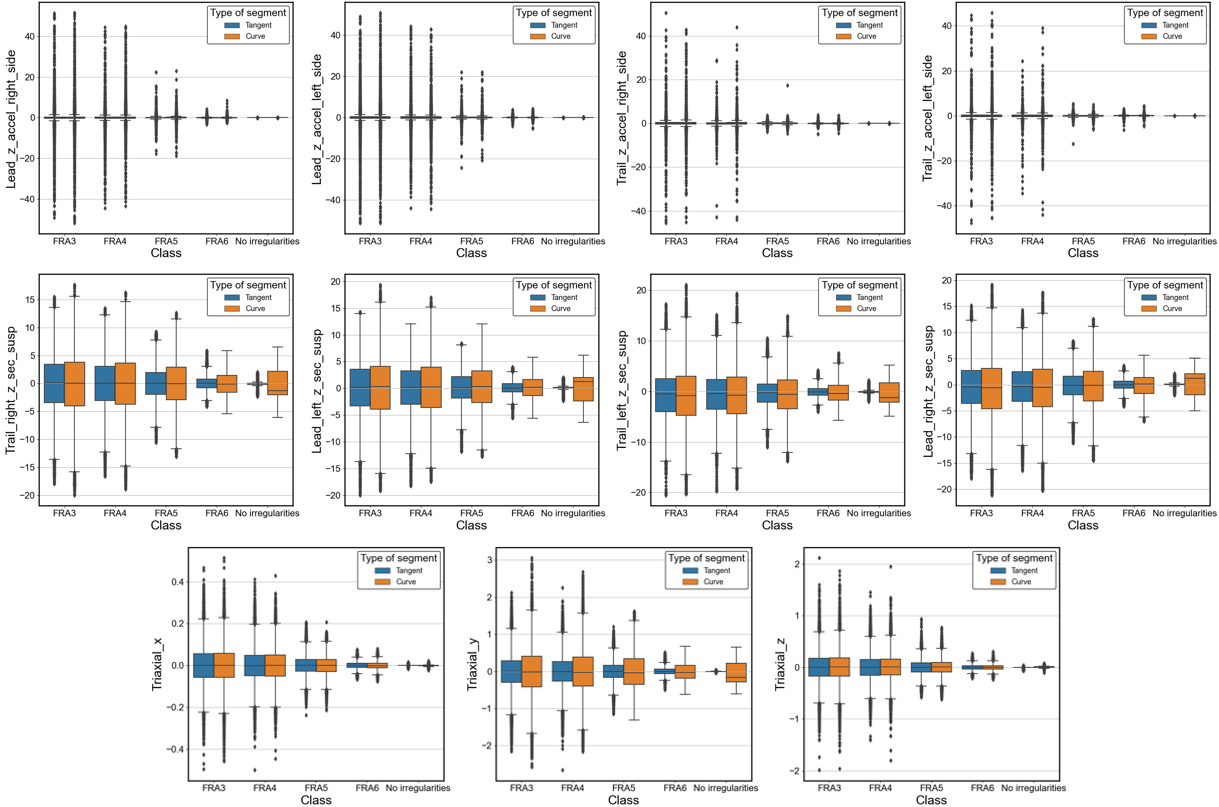
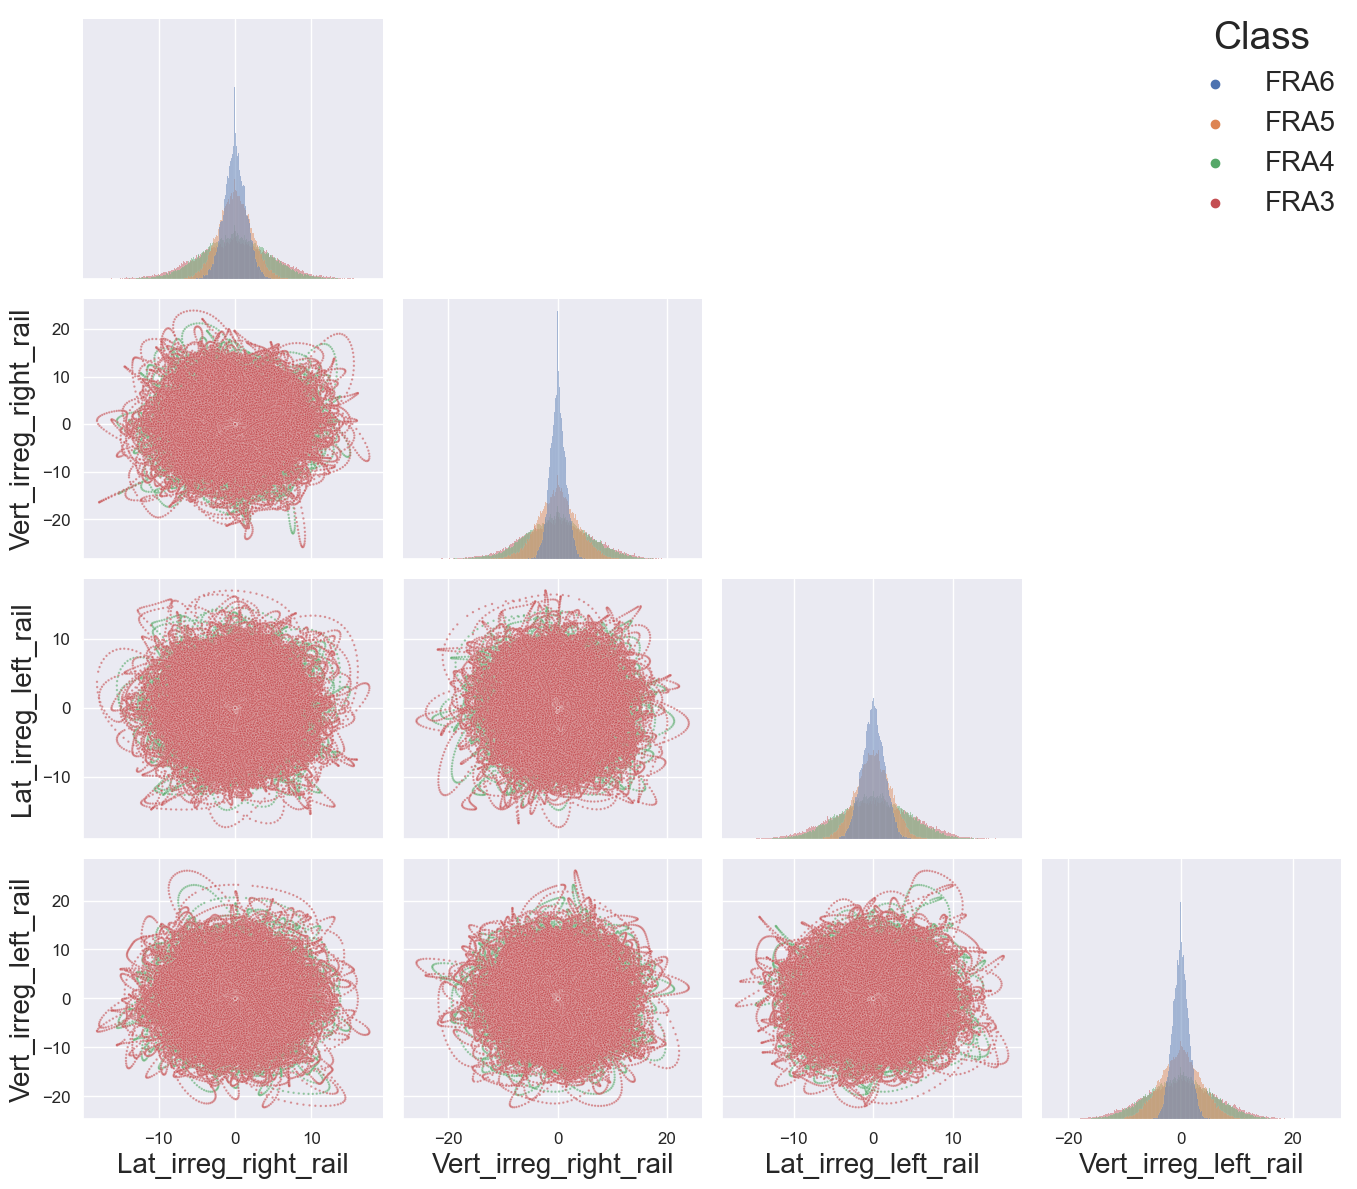
EDA - Effect of Track severity
EDA - Correlation
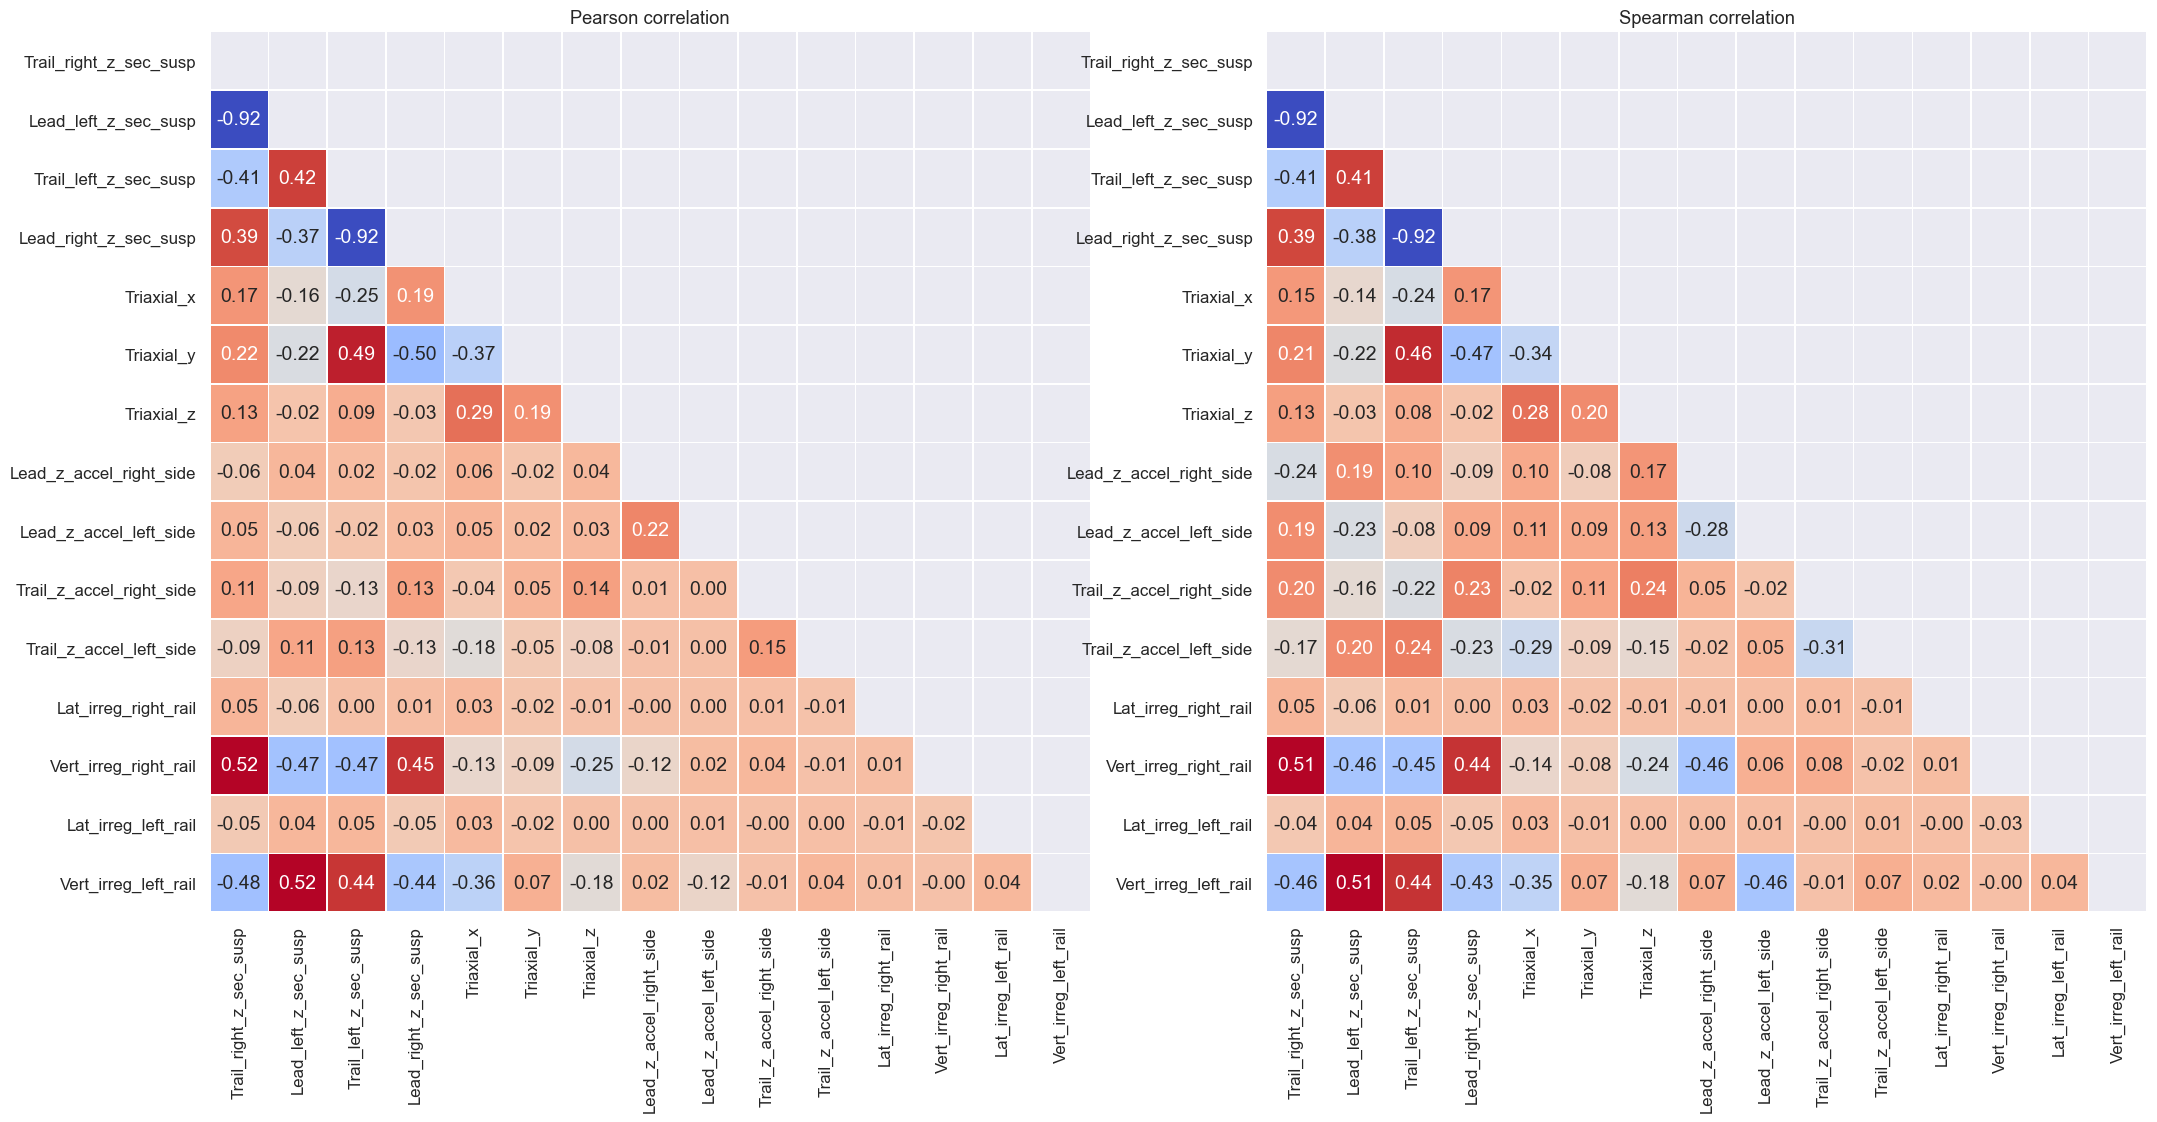
EDA - Correlation
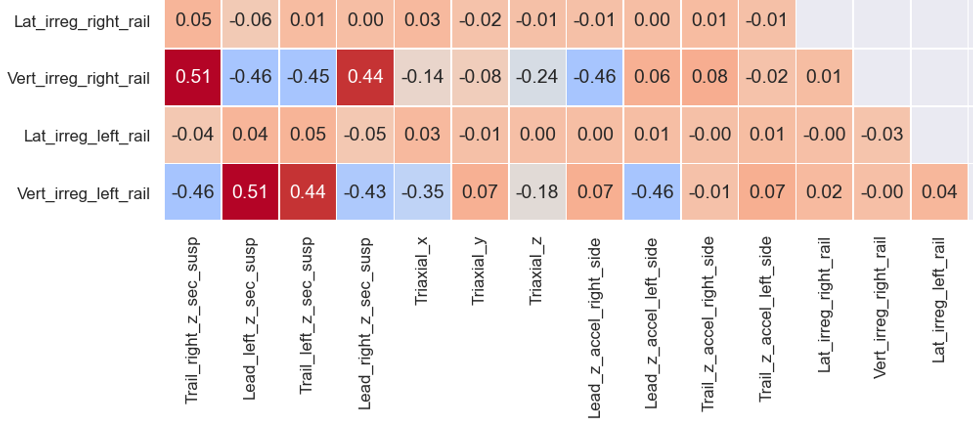
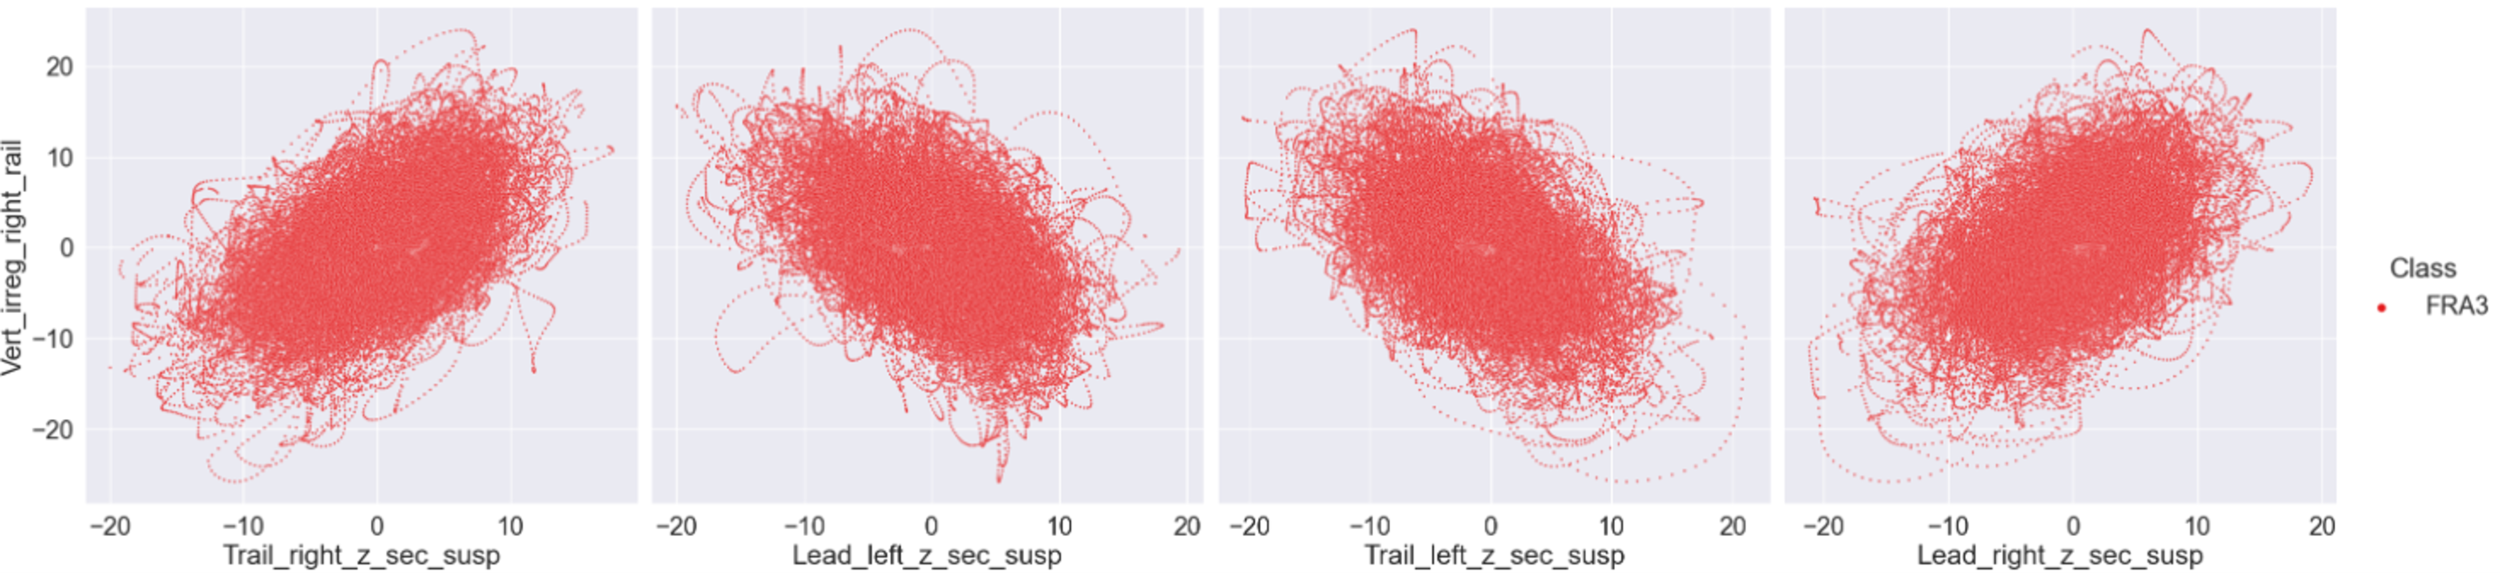
EDA - Correlation
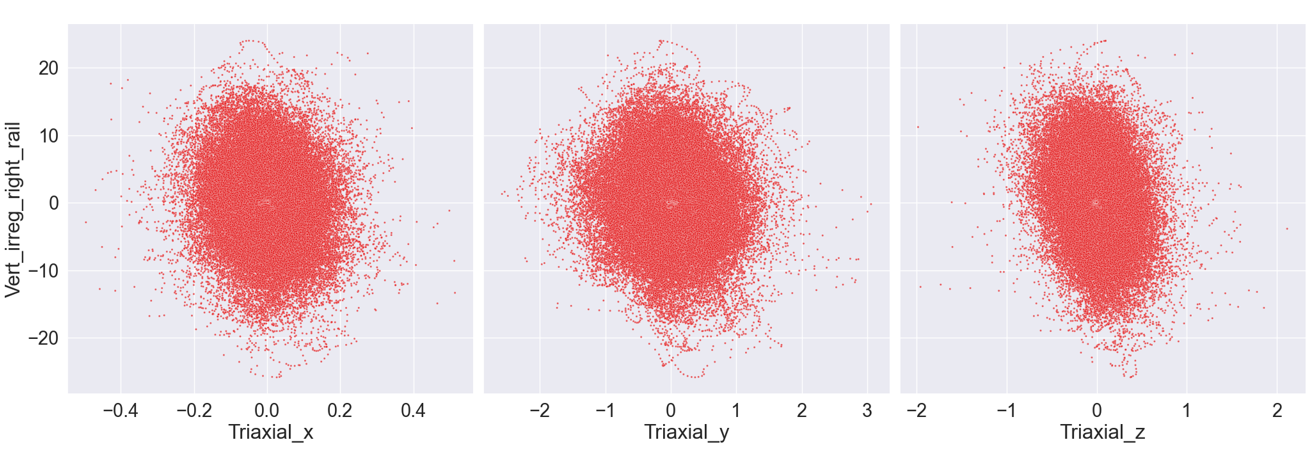
EDA - Correlation
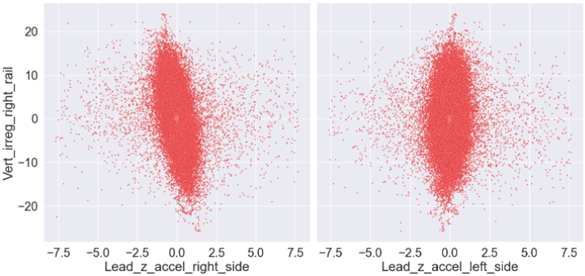
EDA - Correlation
With the current instrumentation, obtaining lateral irregularities from IRV data is unlikely
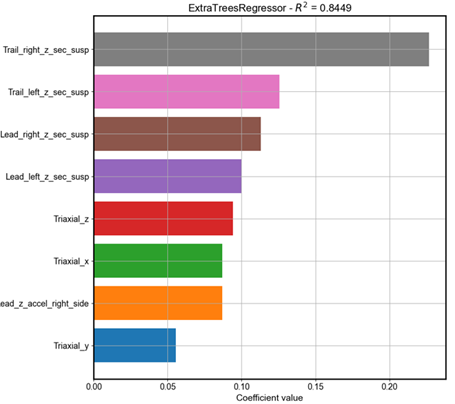
EDA - Baseline model
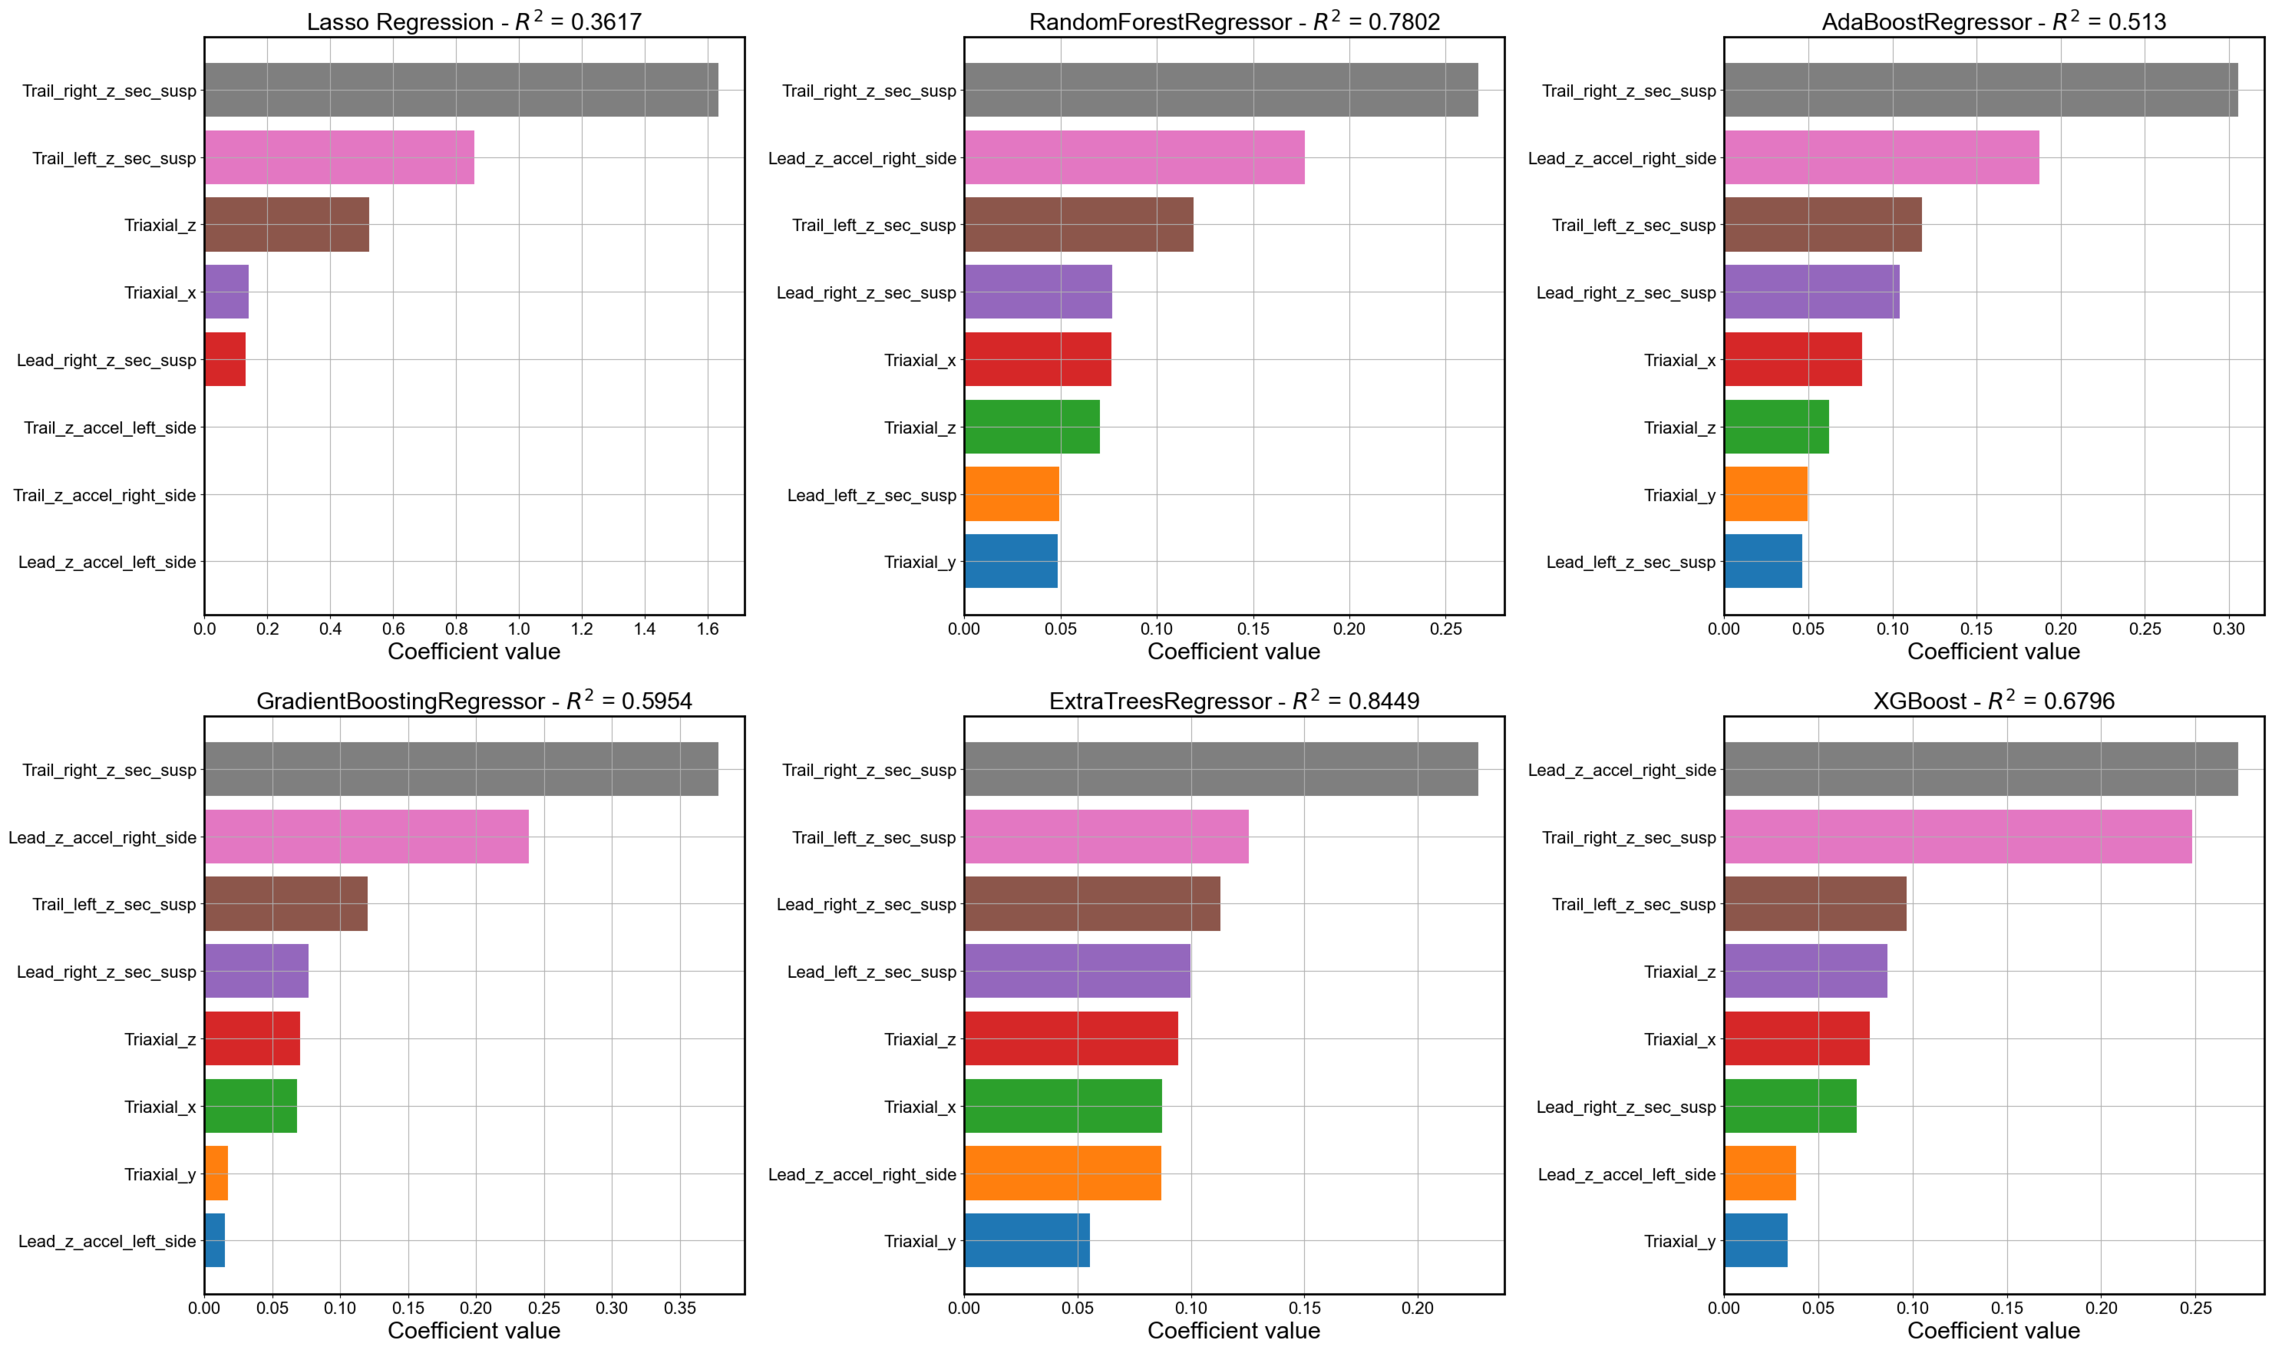
EDA - Baseline model
EDA - Baseline model
- Suspension variables have the largest importance
EDA - Baseline model
- Suspension variables have the largest importance
- Triaxial accelerometer variables have importance (not observed in univariate correlation)
EDA - Baseline model
- Suspension variables have the largest importance
- Triaxial accelerometer variables have importance (not observed in univariate correlation)
- Only the leading uniaxial accelerometers are shown in the top 8 most important variables
EDA - Conclusions
- Outliers appeared likely due numerical errors caused by impact loads in the wheel rail contact interface
- More severe track irregularities mask the effect that track curvature has on the measured variables. Therefore, this information is not that helpful and is removed.
- Suspension sensors will likely be the most important
- Accelerometers positioned in the trailing bogie have lower correlation with vertical irregularities (bad sensor placemente position for this application)
- Triaxial accelerometer has low univariate correlation with the target variables, but it is important considering all variables simultaneously
- A baseline model results in , which is far below the desired objective
R^2 = 0.845
Methodology
Data Science
Filtered dataset
- Umbalanced dataset
- Many small irrregulaties
- Only class FRA4 is used (railway classification)
Methodology
Data Science
Feature engineering - domain knowledge
Objective: Create new variables that better relate the input to the output
Carbody
Suspension
Track excitations
Objective: Create new variables that better relate the input to the output
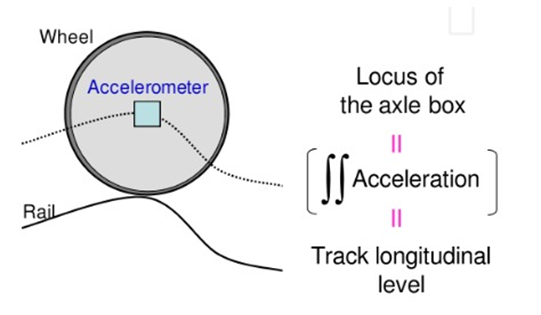
Integração numérica dos acelerômetros
Feature engineering - domain knowledge
Objective: Create new variables that better relate the input to the output
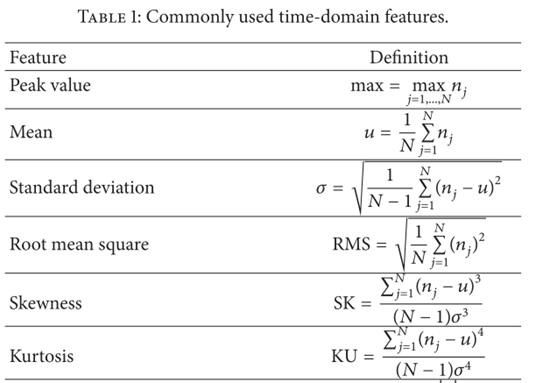
Feature engineering - statistical metrics
Methodology
Data Science
Feature selection
After feature engineering
380 columns!
After feature selection
30 columns
R^2 = 0.9738
R^2 = 0.9408
Today's presentation
- Introduction
- Objectives
- Methodology
- Results
- Future studies
Methodology
Machine learning
Results
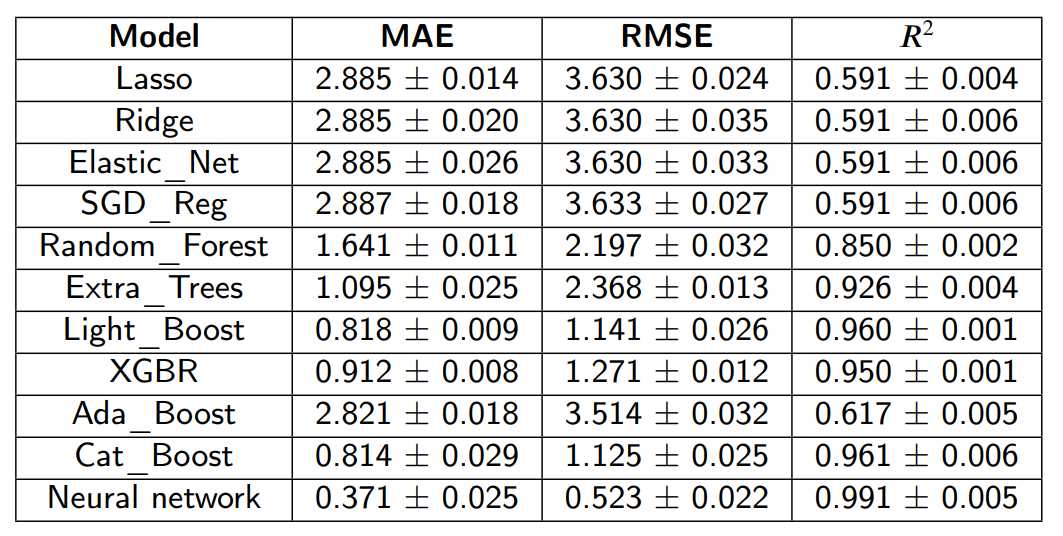
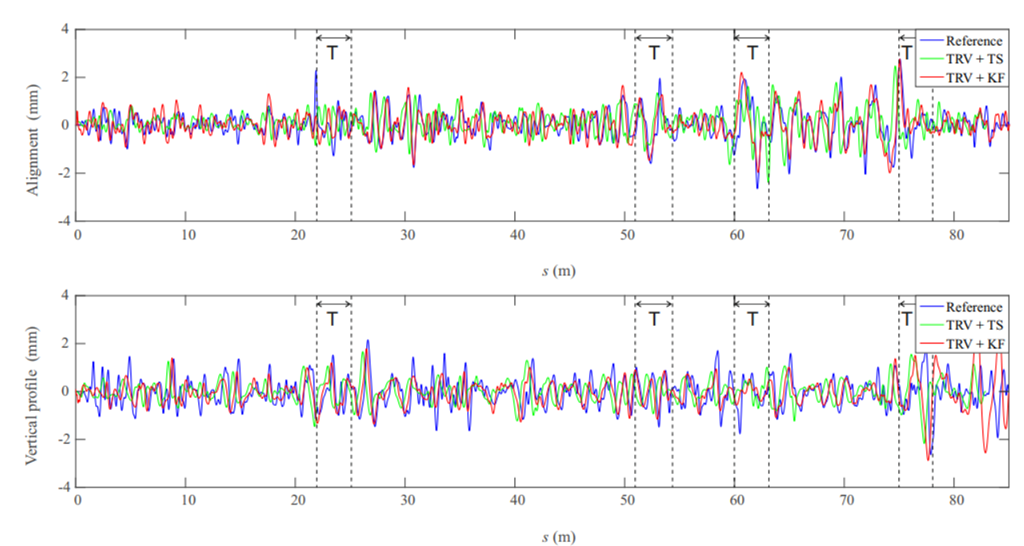
Better RMSE than 0.66 mm from Urda's research!
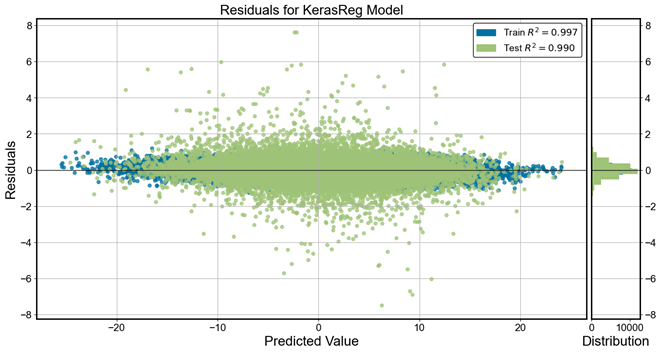
Results - best model

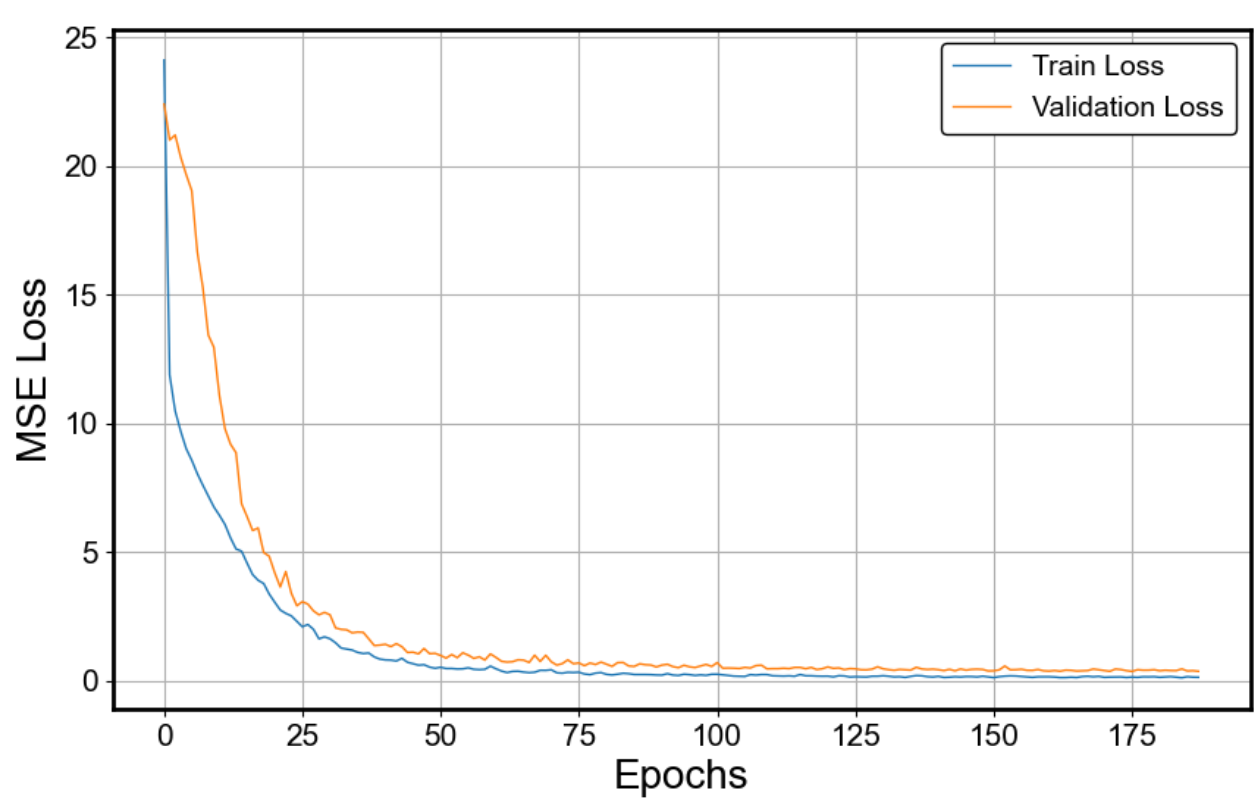
Results - best model
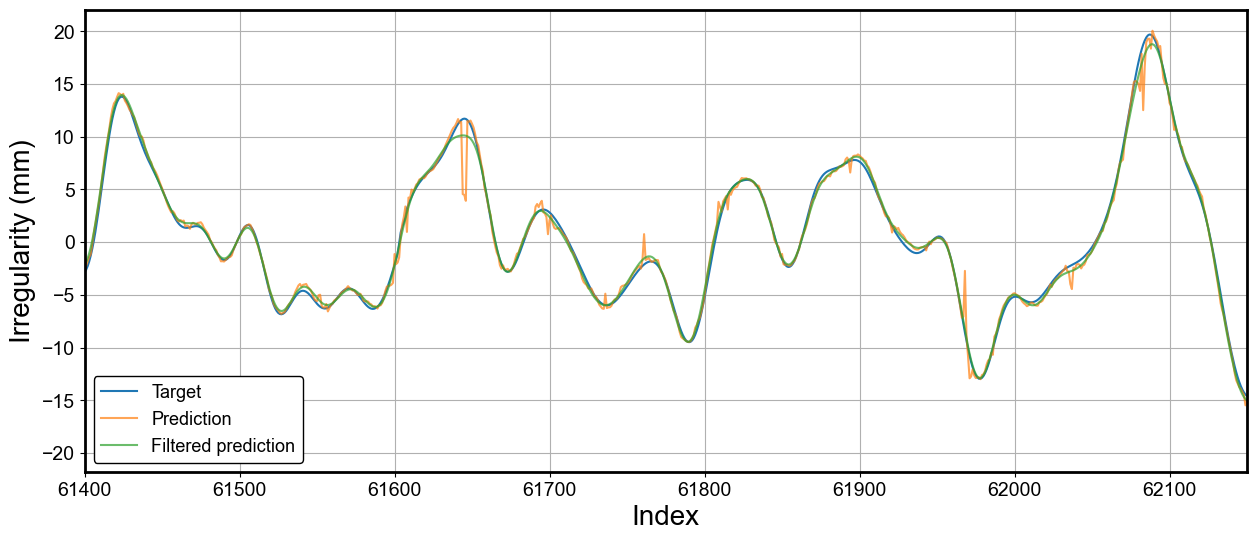
Results - postprocessing
RMSE metric improved from 0.523 mm to 0.421 mm!
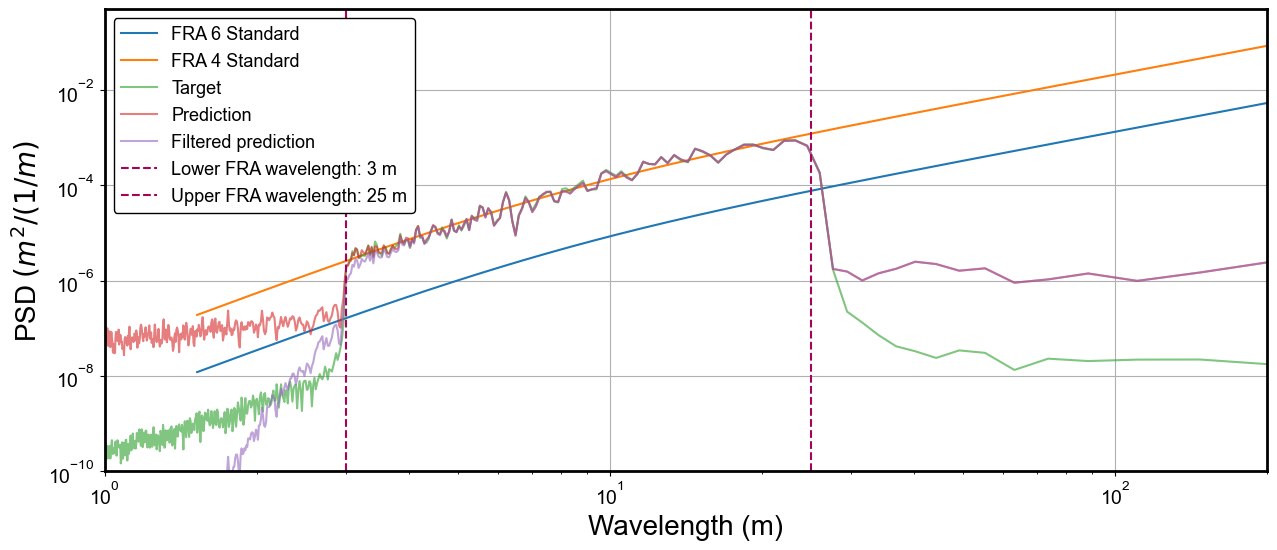
High frequency noise has been removed
Results - postprocessing
Conclusions
- The current instrumentation of the IRV is capable of obtaining vertical track irregularities. Not likely for lateral track irregularities;
- Sensor placement in the trailing bogie will likely not help in measuring vertical track irregularities;
- The optimal model resulted in a RMSE metric of 0.523 mm, which is better than similar research publications;
- Post processing with a low pass filter at the desired wavelength increased the RMSE from 0.523 mm to 0.421 mm;
Today's presentation
- Introduction
- Objectives
- Methodology
- Results
- Future studies
Future studies
- Study model robustness with velocity and GPS error
- Apply the methodology proposed here to obtain lateral irregularities using the virtual sensors
- Degradation forecasting using track geometry data and ML model outputs to estimate optimal date for maintenance
- Apply methodology on real measured data

deck
By Arthur Pires

