NodeJS Memory management
Introduction
Garbage collected environments are magical trees you never have to cut yourself.
But this is not magic, and you are there to get insights on what is truly happening!
Plan
Plan
PART I - An application lifecycle
PART II - Understanding and analyzing
PART I
An application lifecycle
PART I - an application lifecycle
1 - Warming up
2 - Performing
3 - Leaking & underperforming
4 - Crashing
Warming up
Warming up
- Loading modules
- Creating long living instances
- Reaching pools minimum resources
- Filling caches
Performing
Performing
- Per task instances and pools resources are created by NodeJS, some framework, or your own code
- Once tasks done and pools back to their minimum, only code space size should have varied
Leaking & underperforming
Leaking
- Instances created for performing each task may still be referenced by the global context at some distance
- Pools resources may not have been released
Leaking or not leaking ?
- Some per task instances may get retained the same way a ring buffer retains only the N last data, so that it eventually gets released
- In the context of a garbage collected environment, this is not a true leak = it's somehow under control = this is the warm up
- But if these instances retain things that don't belong to them, we have a leak
- Some per task instances may just never die
- In the context of a garbage collected environment, this is a true leak = it's not under control
Underperforming
- References are stacking
- The GC is requested to pass more and more frequently
- The non-blocking scavenger leaves space for marking, sweeping and eventually compacting GC algorithms
- Tasks take longer to be performed
Crashing
Crashing
- Tasks start queueing and things get even worse
- The garbage collector does not have time to make space
- "Allocation failed – JavaScript heap out of memory"
PART II
Understanding and experimenting
PART II - understanding and experimenting
1 - Heap mechanics
2 - Retaining tree
3 - Garbage collector
4 - Analyzing
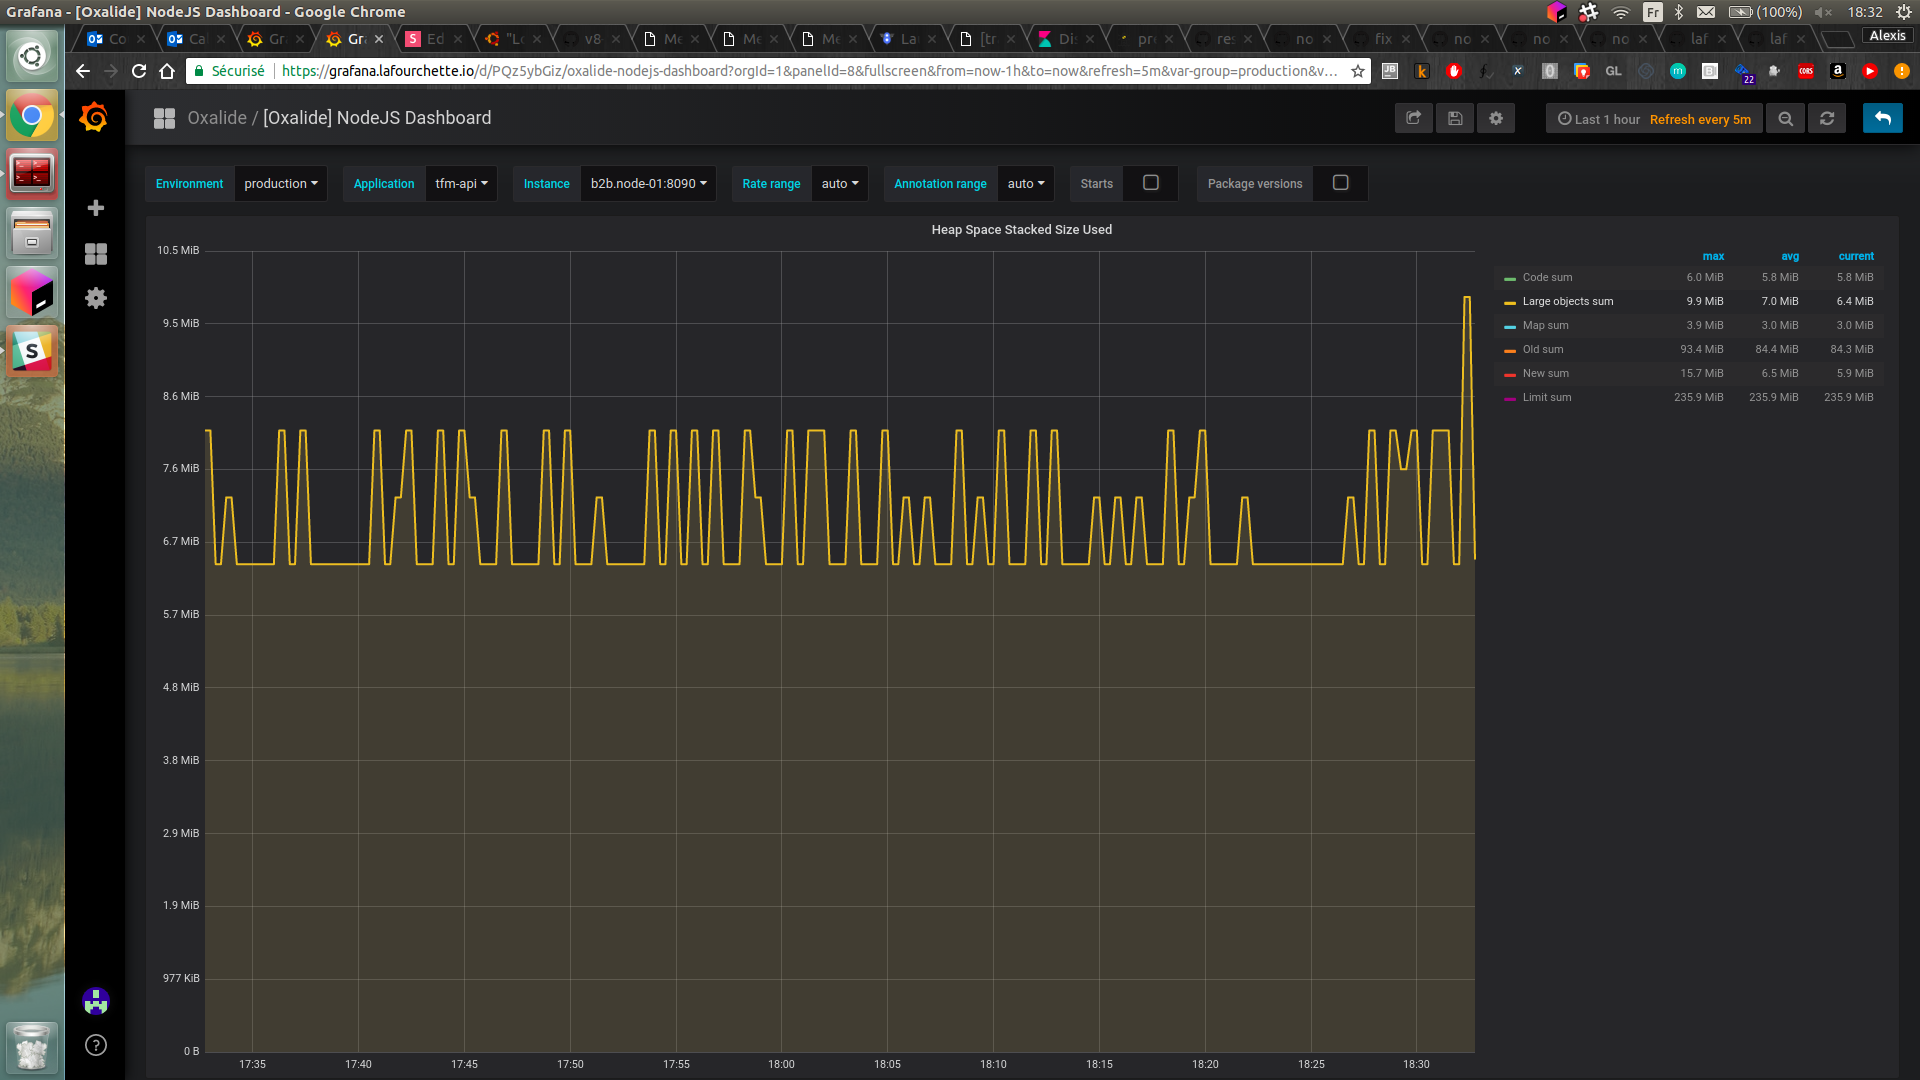
Heap mechanics
Memory Heap spaces
Code
Read-only
Map
Large objects
Old
New
Filling Code space
- Few megabytes
- Filled progressively
- Code is alternatively (de)optimized, making size vary
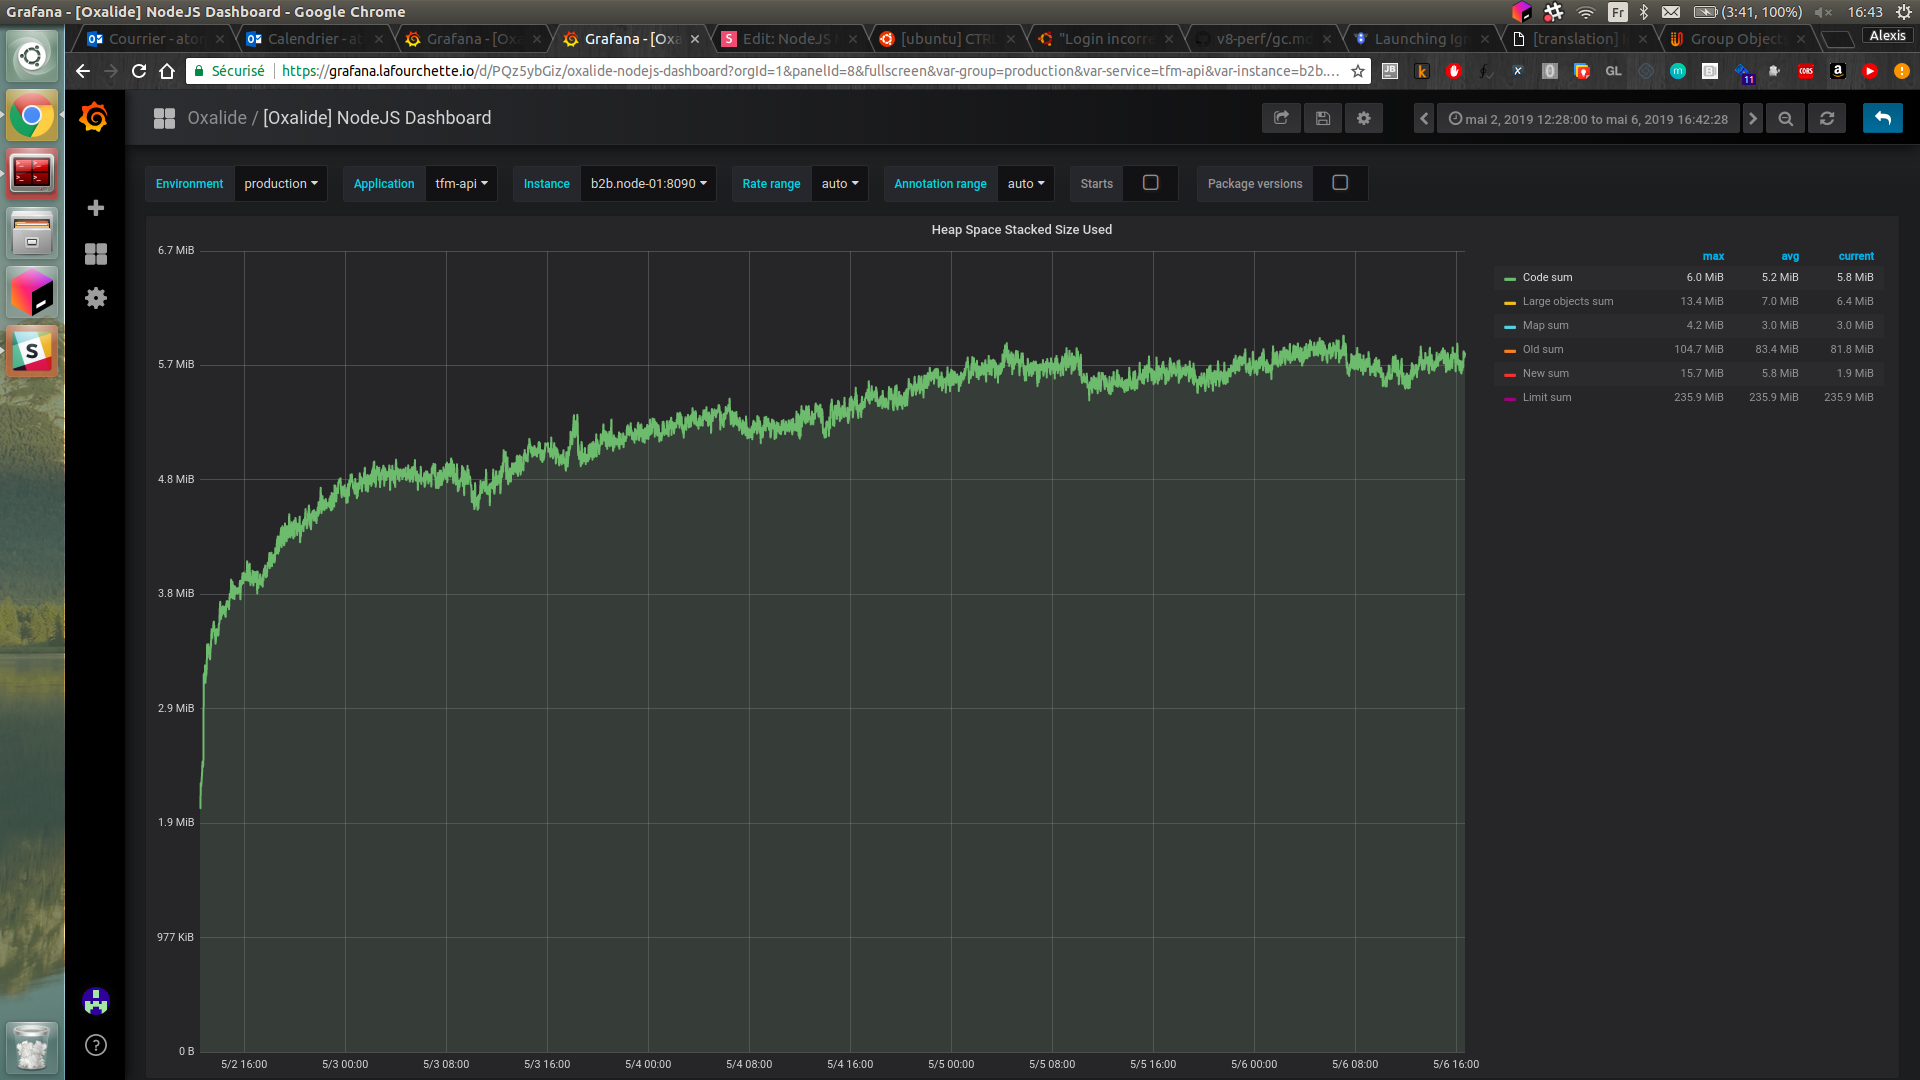
Filling New space
- Few megabytes
- Garbaged in parallel
- Constrained by --max-semi-space-size
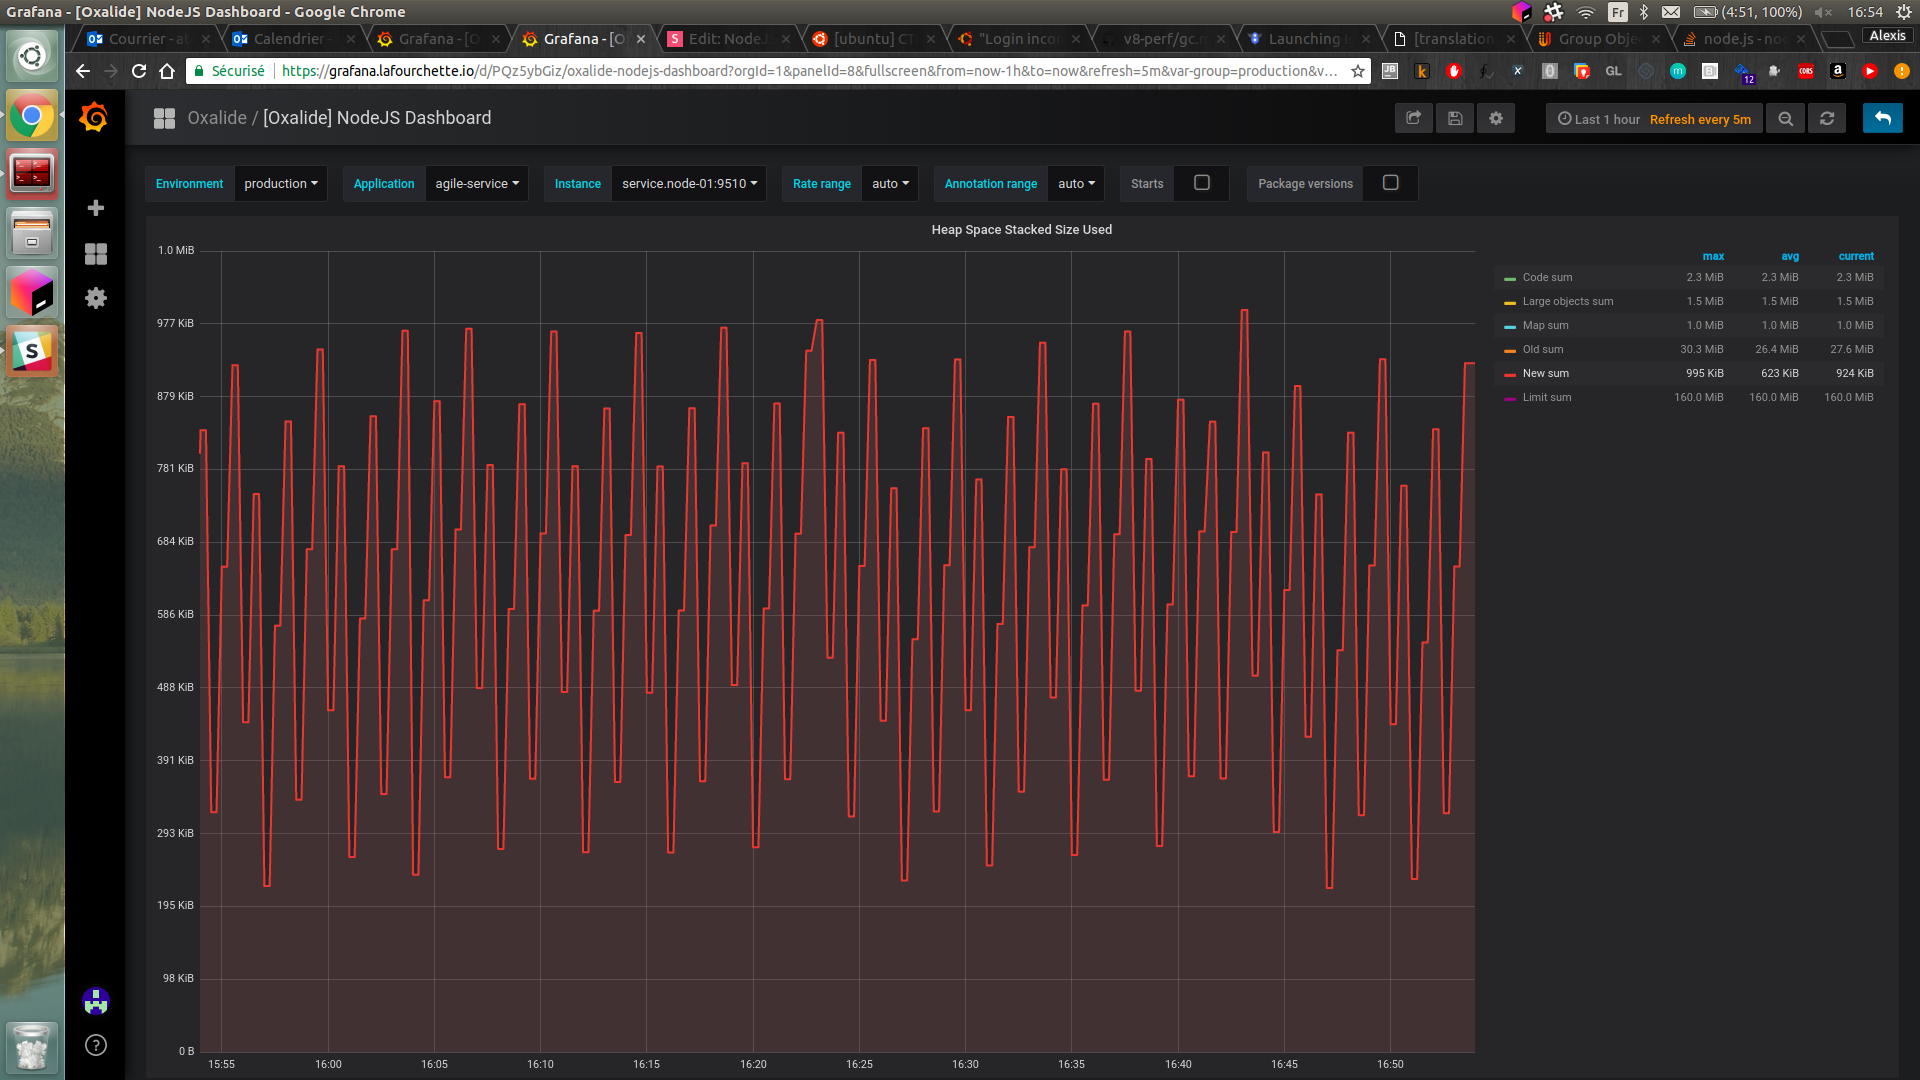
Filling Old space
- Main part of the heap
- "Stop-the-world" garbage collection
- Constrained by --max-old-space-size
Filling Large object space
- Only for large objects bigger than other spaces limits
- Never moved by the garbage collector (only freed)
Filling Code space
V8 Ignition
V8 TurboFan
JavaScript
Bytecode
Machine code


Code
Retaining tree
Handles
Heap
Handles
Program state
Reference
Internal pointer
Since objects move between heap spaces, they are wrapped in handles
Retaining causes & Marking
- The root is retained
- A node is retained if referenced by a retained node
(weak refs do not count) - Marking is all about finding dead objects which then get swept
root
ref 4 (weak)
ref 1
ref 2
ref 3
ref 5 (weak)
dead
dead
Weak references
Experiment with Node 12
// node --expose-internals --expose-gc

const { internalBinding } = require('internal/test/binding');
const { WeakReference } = internalBinding('util');


let a = { foo: 'bar' };

const weakRef = new WeakReference(a);

weakRef.get() // a

a = null;
gc();

weakRef.get() // undefined
Retaining tree example
function main() {
    const a = {};

    const b = { a };

    const c = [b];

    const d = new Set();
    d.add(c);

    const e = new Map();
    e.set(d, c);

    const f = new WeakSet();
    f.add(e);

    const g = new WeakMap();
    g.set(f, e);

    return g;
}

const result = main();
f
e
d
c
[d]
b
g
[f]
[0]
a
["a"]
result
0
1
2
3
4
Retain depth from g:
References rules
- A collection (Object, Array, [Weak]Set, [Weak]Map) references its values and keys
- An Object references a C++ class for each combination of keys and value types
- A function closure scope references the variables used in this function
- Two functions in the same scope share the same closure scope
- References might be circular, don't worry, V8 is not IE6
- WeakMaps references to a key and the associated value don't count if nothing else has a non weak reference to the key
- WeakSets references to a value don't count if nothing else has a non weak reference to it
- From the program's point of view, references are handles, not addresses
Garbage collector
Generational Garbage Collector
Allocations
Flip
to-space
from-space
to-space (previously from-space)
from-space (previously to-space)
Garbage scavenge collections
Main thread
GC threads (incl. main)
Any survivor is flagged and copied here
or copied to old space if flagged a second time
Next allocations
Old
Marking
Not yet discovered by GC
Some neighbors have not been processed
All neighbors have not been processed
GC will search objects from root
Reached => black, neighbors => grey
All reachable objects were processed
Sweeping
GC sweeps dead (white) objects
Compacting
Page 1
Page 2
Page 3
Mark sweep & mark compact
- Marking and sweeping objects is an expensive and blocking operation
- Marking occurs incrementally to reduce blocking time
- Sweeping frees dead objects
- The closest to the heap size limit, the more sweeping occurs
- Compacting moves objects to free pages
- The closest to the heap size limit, the more compacting occurs
Garbage collector
- Just born objects belong to the young generation
- The scavenger passes after a given size of allocation depending on remaining space
- Surviving the scavenger twice make them grow and belong to the old generation
- Most of the scavenger activity occurs off the main thread
- The garbage collector incrementally marks objects of the old generation
- It sweeps the objects marked as dead
- It may skip incremental marking
- It may also compact memory pages depending on remaining space
- Marking, sweeping, and compacting are "stop-the-world" phases
Analyzing
Memory leak symptoms
- Heap size min over time is increasing
- GC is consuming a lot of power
- GC concentrates more and more on mark sweeping or compacting
- Tasks are performing slower (when visiting leaking collections, even before GC is stressed)
The true performance measurement
- Considering the task with the biggest footprint over a given period of time, how many concurrent clients can you support infinitely?
- With a memory leak, the answer is 0!
Metrics
- Total and used heap size per space
- Heap snapshots and profiles
- GC stats (runs, reclaimed bytes) per algorithm
Tools
- NodeJS Inspector and the Chrome DevTools
- NodeJS V8 modules
- NodeJS V8 options to trace and alter the GC behavior
- NodeJS profiler to see GC activity %
- Decidated C++ extension to expose GC stats
GC stats

MarkSweep = ~60% GC
MarkSweep = ~80% GC
Scavenger
MarkSweep
GC stats
High marking / sweeping / compacting activity may mean
- objects more often reach old generation, avoiding the scavenger
Its increase over time (even with activity decrease !) means
- old generation objects are accumulating and never released
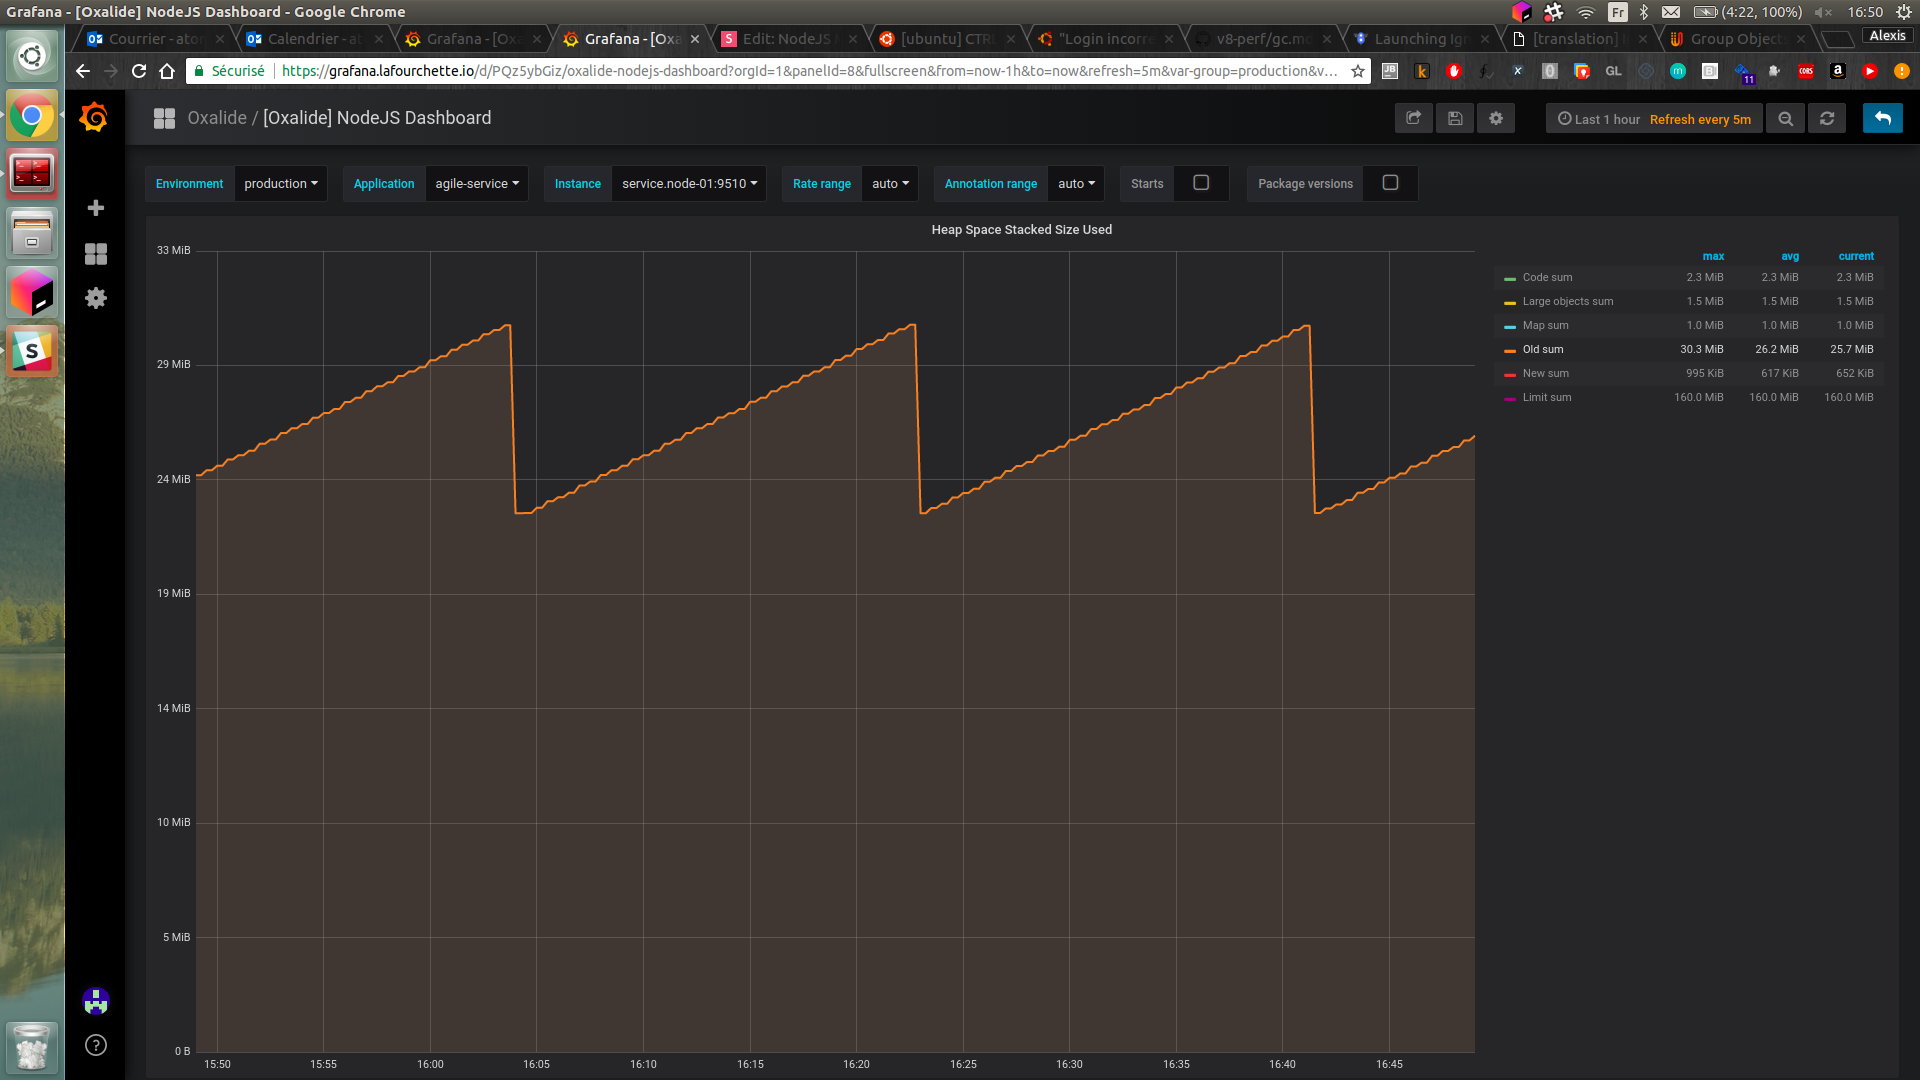
Old space heap size
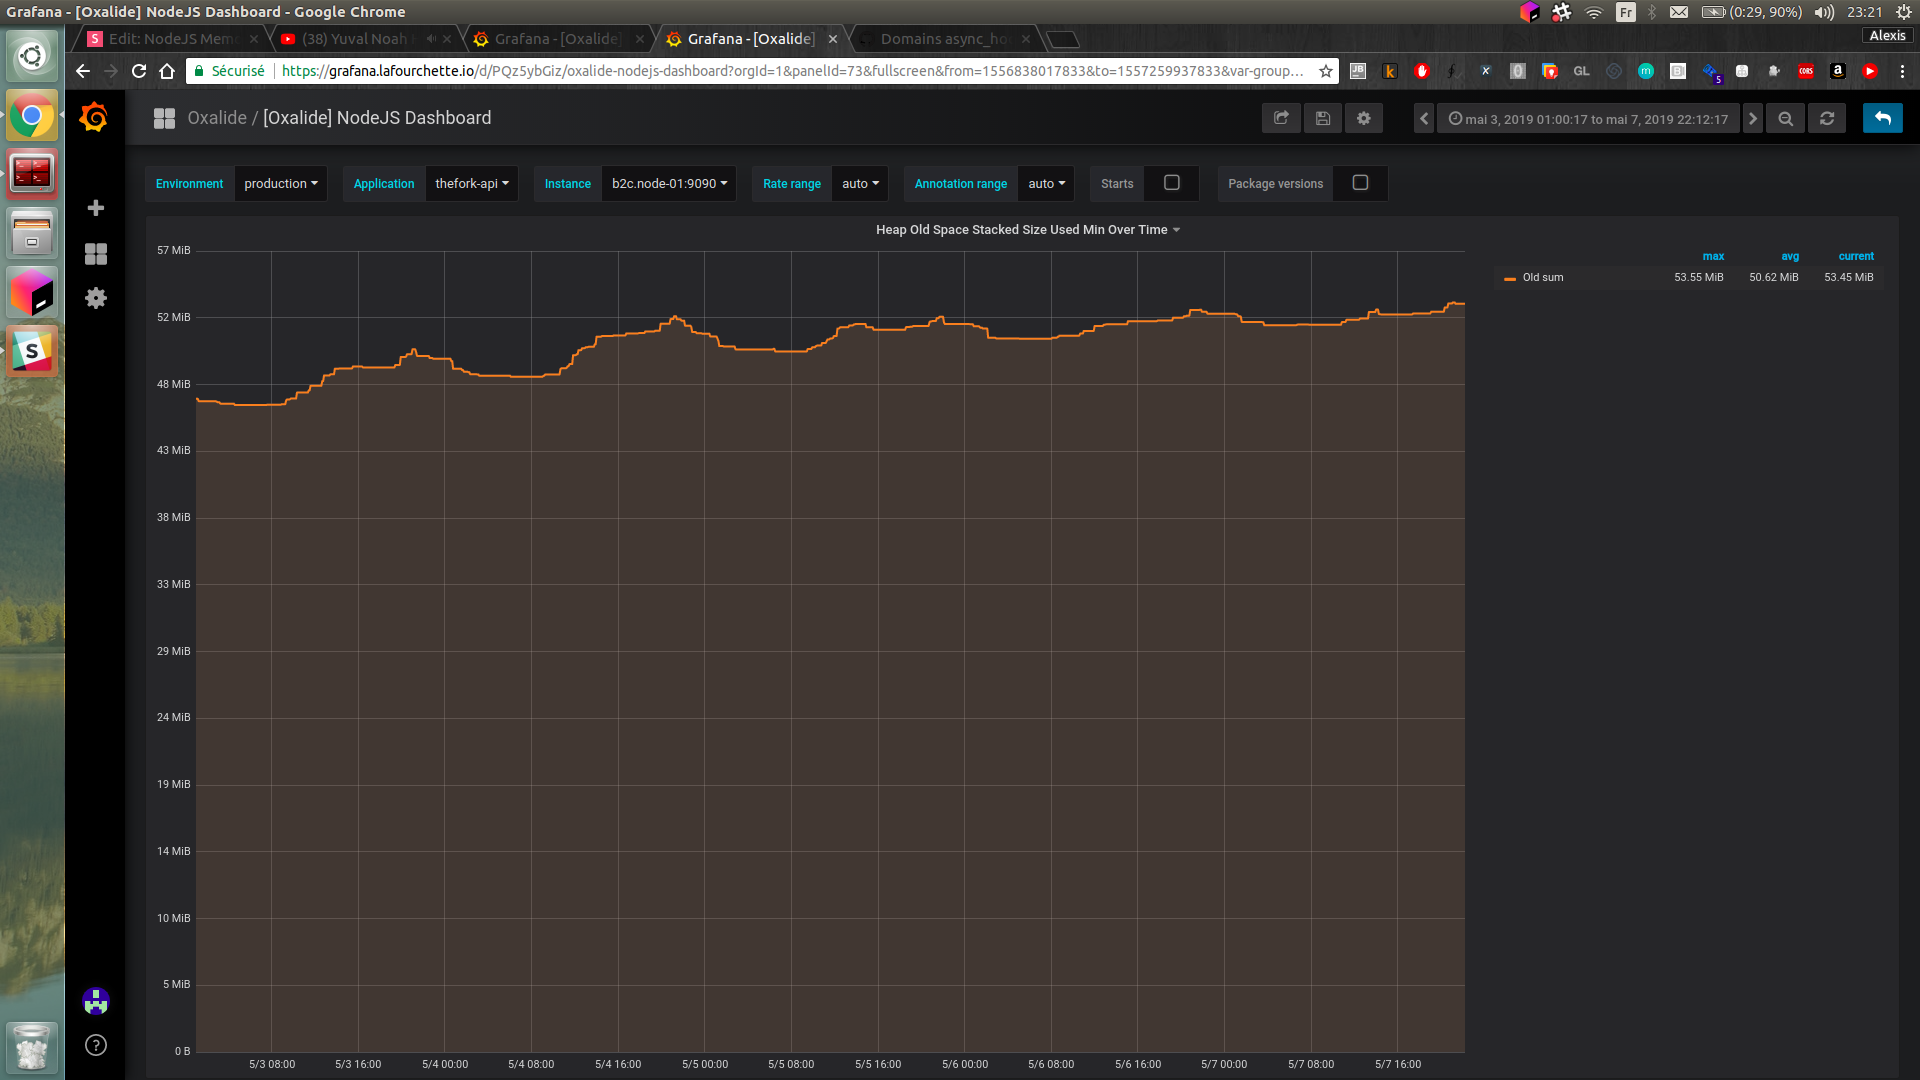
Obviously increasing old space size over time
OLD SPACE HEAP SIZE
High old space size may mean
- objects more often reach old generation, avoiding the scavenger
Its increase over time (even with activity decrease !) means
- old generation objects are accumulating and never released
Techniques
- 1 heap snapshot
- "3 snapshot" technique
- Memory profile
- Allocation timeline
1 snapshot
C
B
D
A
Looking at 1 snapshot, we spot dominant objects
Their counts may be interpreted
GC + Snapshot
*
*
Cannot be collected
Can be collected
Warm up + perform N tasks
Study the snapshot !
3 snapshot technique
A
B
A
B
A
B
A
C
A
C
Looking at snapshot 3 for objects allocated between snapshot 1 and 2, we spot objects that survived GC even after having assigned any resource in pools to other tasks: A, B, C
Snapshot 1
GC + Snapshot 2
GC + Snapshot 3
Warm up + perform N tasks
Perform N tasks
Perform N tasks again
Study snapshots !
A
A
A
B
C
V8 options
| OPTION | MEANING |
|---|---|
| --trace-gc | show 1 line per GC pass |
| --trace-gc-ignore-scavenger | skip scavenger passes |
| --optimize-for-size | make GC less lazy |
| --max-old-space-size=X | sets old space size to X MB |
Few of them
Annexes
Docs
- Memory management (Glossary)
- V8 breaking speed limit (2012)
- A tour of V8: Garbage Collection (2014)
- V8 Ignition interpreter (2017)
- V8 Garbage collector (2018)
NodeJS Memory management
By Alexis Tondelier
NodeJS Memory management
Understand V8 memory heap, its garbage collector, memory leaks and how to detect and fix them