A brief history of data visualization
Attila Bátorfy, ELTE MMI, Budapest
Why we visualize data?
- Representation
analysis, seeing, understanding
- Argumentation
highlight, enlight, demonstration, proof
Why we visualize data?
- Data visualization is a visual rhetoric form which uses mostly abstract visual signs for highlight, demonstration, enhance, convince or debunk.
- monosemic
Why we visualize data?
Not how to see, but how to read the meaning of the visual signs - semiology/diagrammatology
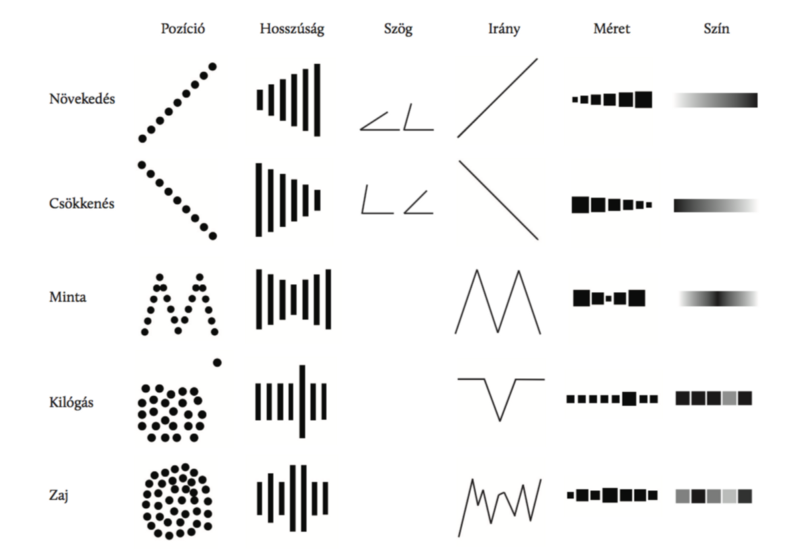
Visual signs

point line shape form
Attributes
position length direction angle

shape size colour shade
Reading
Position Length Angle Direction Size Colour
Growth
Decreasement
Pattern
Outlie
Noize
Meaning
- title
- legend
- annotation
- axis
- source
- explanation
Process
Sign
Attributes
Meaning
Representative
Narrative
Argumentation
Style
Semiotics
Diagrammatology
In the family of images
?
In the family of images
- art history
Gombrich, Elkins (epistemic image)
- visual cultural studies
Mitchell, Boehm (pictorial turn, iconic turn)
- Bildwissenschaft
Bredekamp (technical image)
In the family of images
diagrams (schematic image)
plans
pictograms
genealogies
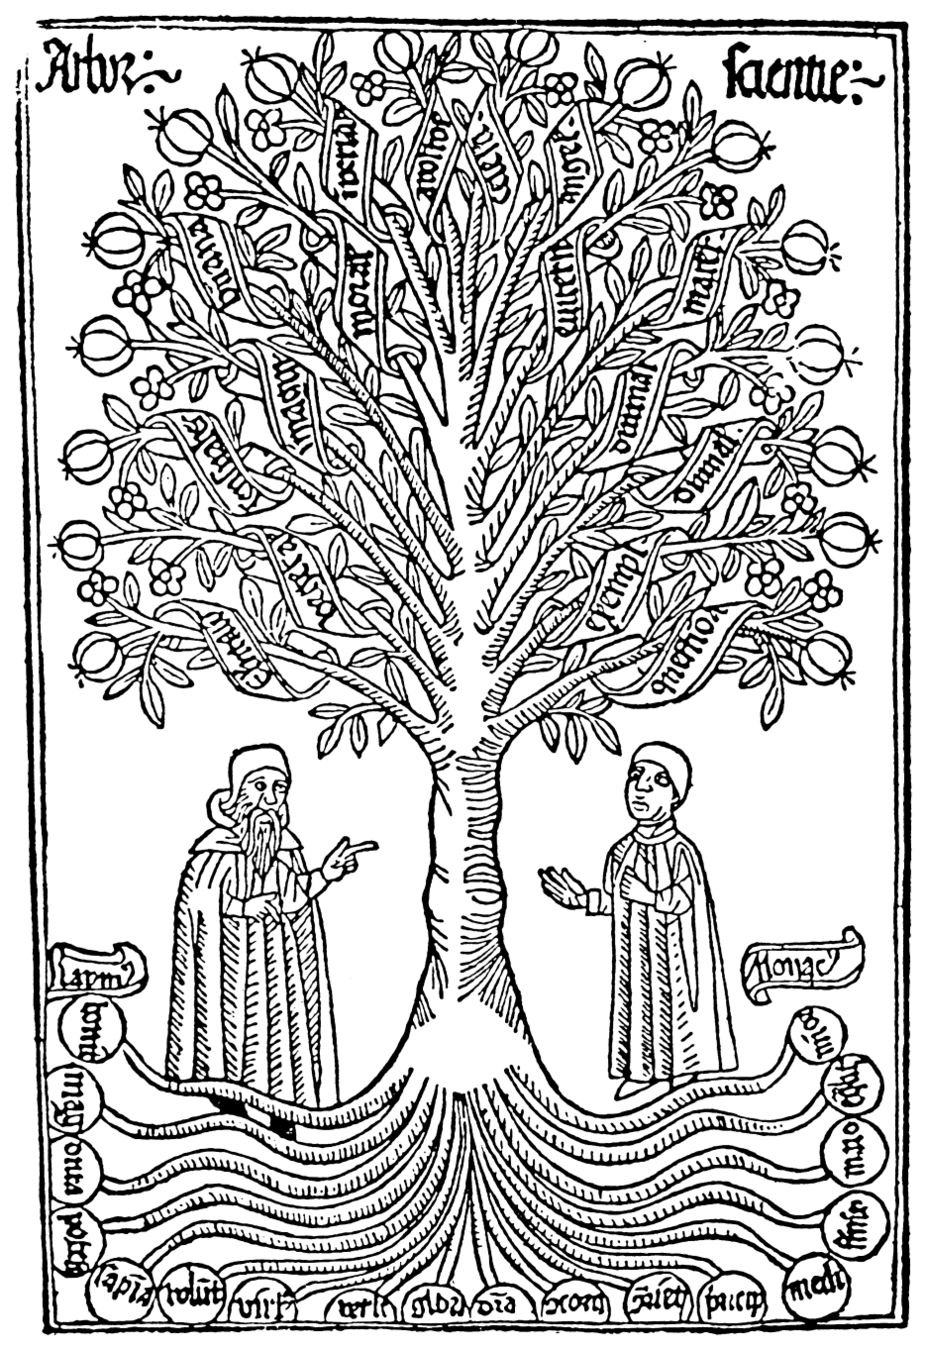
knowledge trees
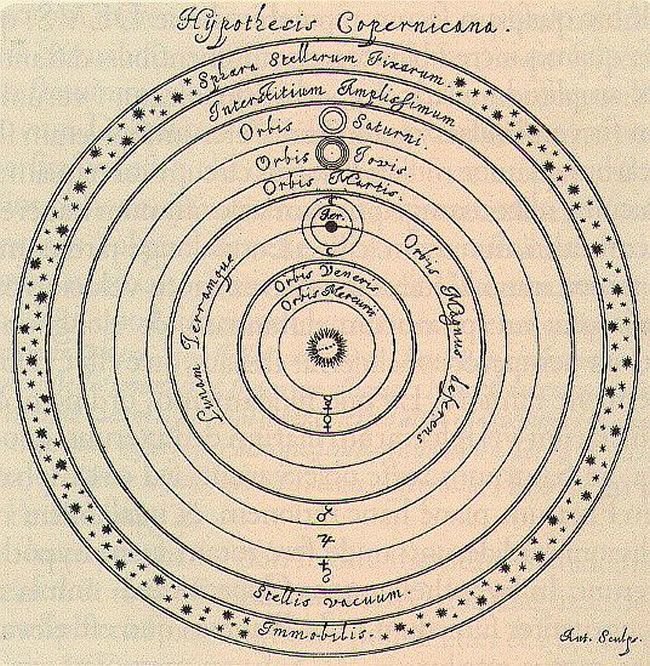
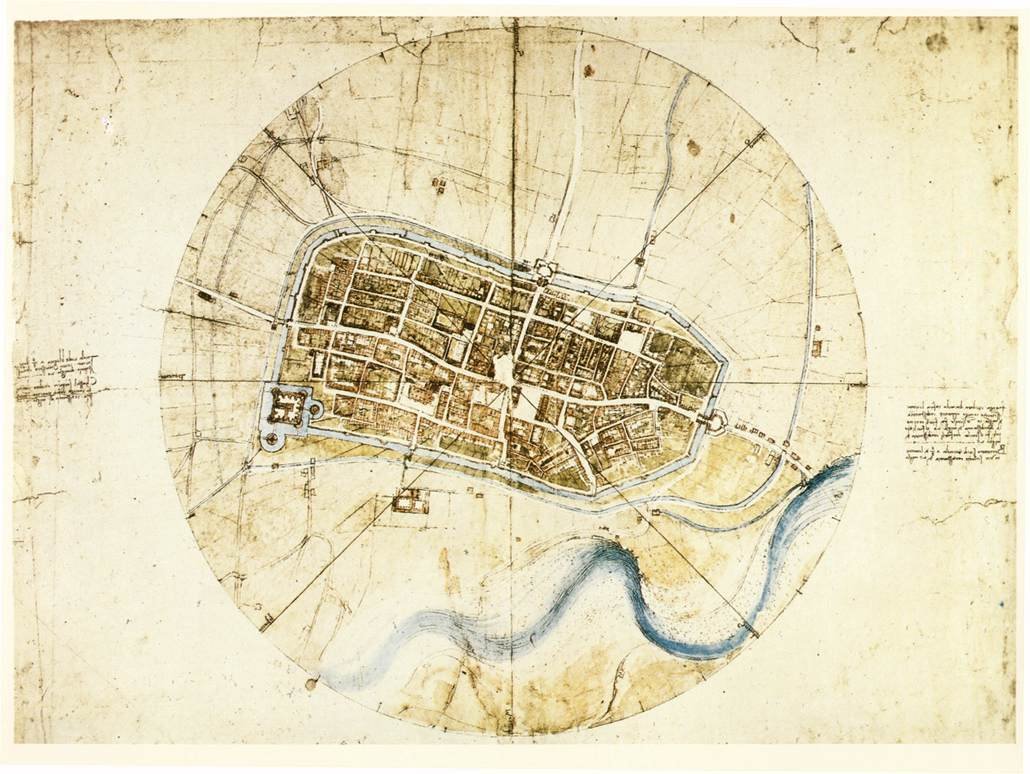
maps
scientific images (microscope)
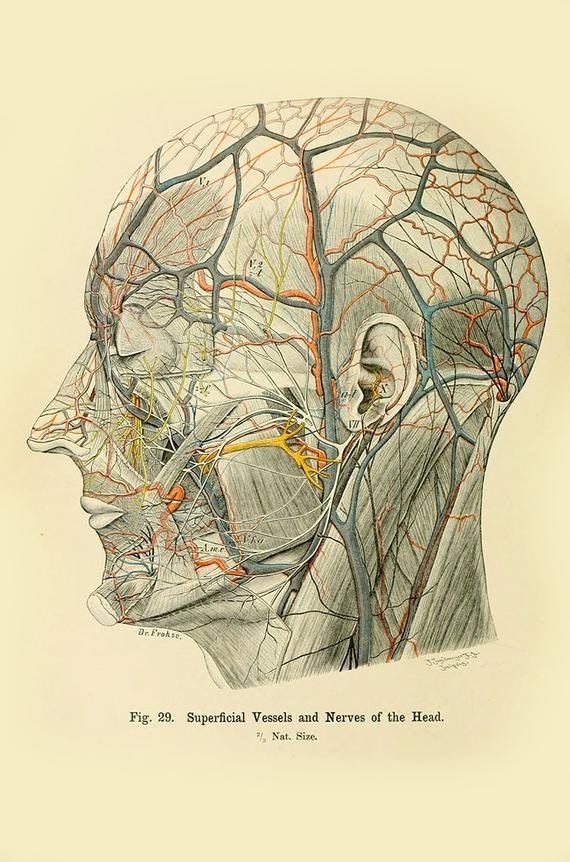
scientific illustrations (anatomical drawings)
?DATA VISUALIZATION?


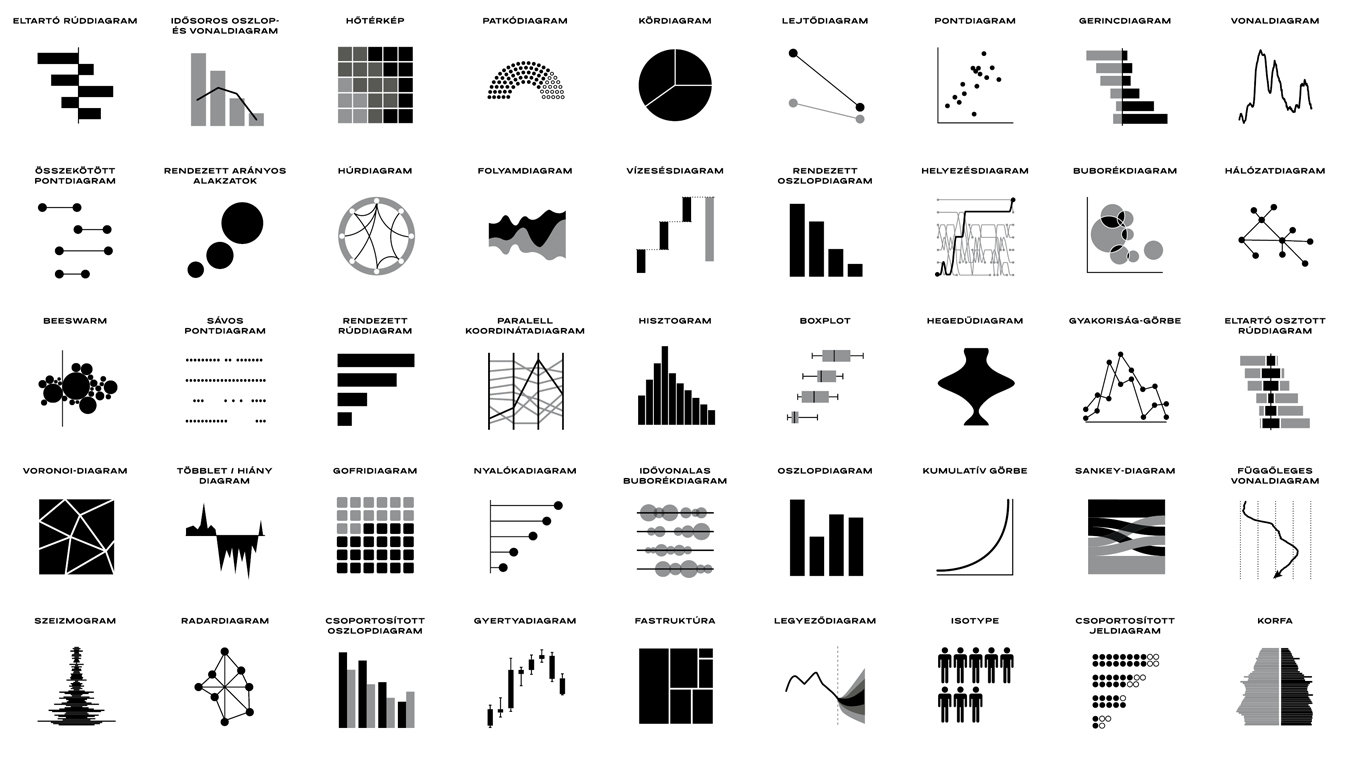
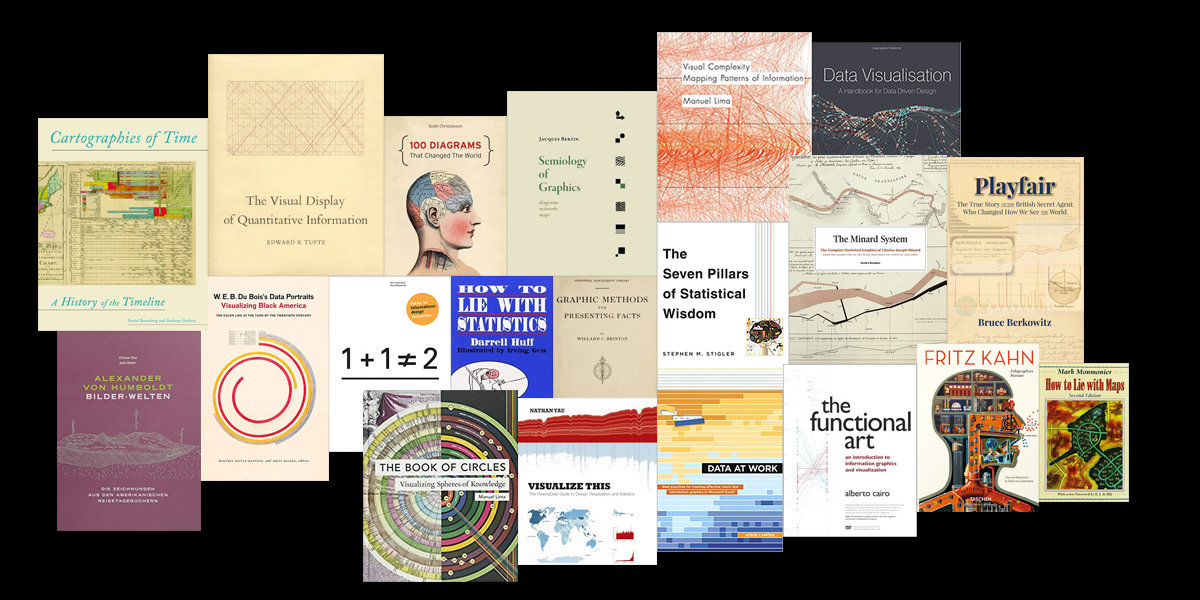
- linear, chronological history
Funkhouser, Friendly, Rendgen - history of forms
Manuel Lima, Rosenberg and Grafton - history of ideas
Bender and Marrinan, Schmidt-Burkhardt - Monographs
Wainer, Berkowitz, Rendgen, Rusert
30 000 BC

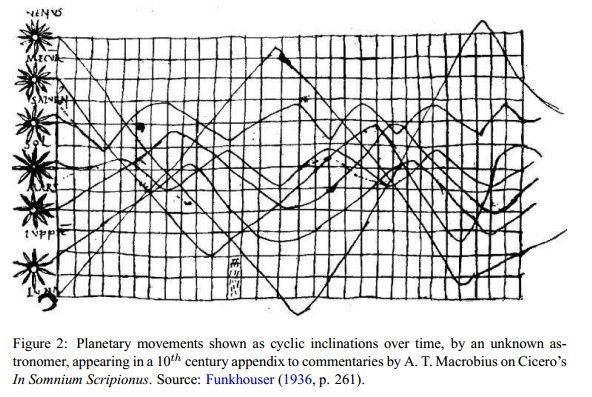
950 circa
mid 14. century
mid. 17. century
1769 - Joseph Priestley

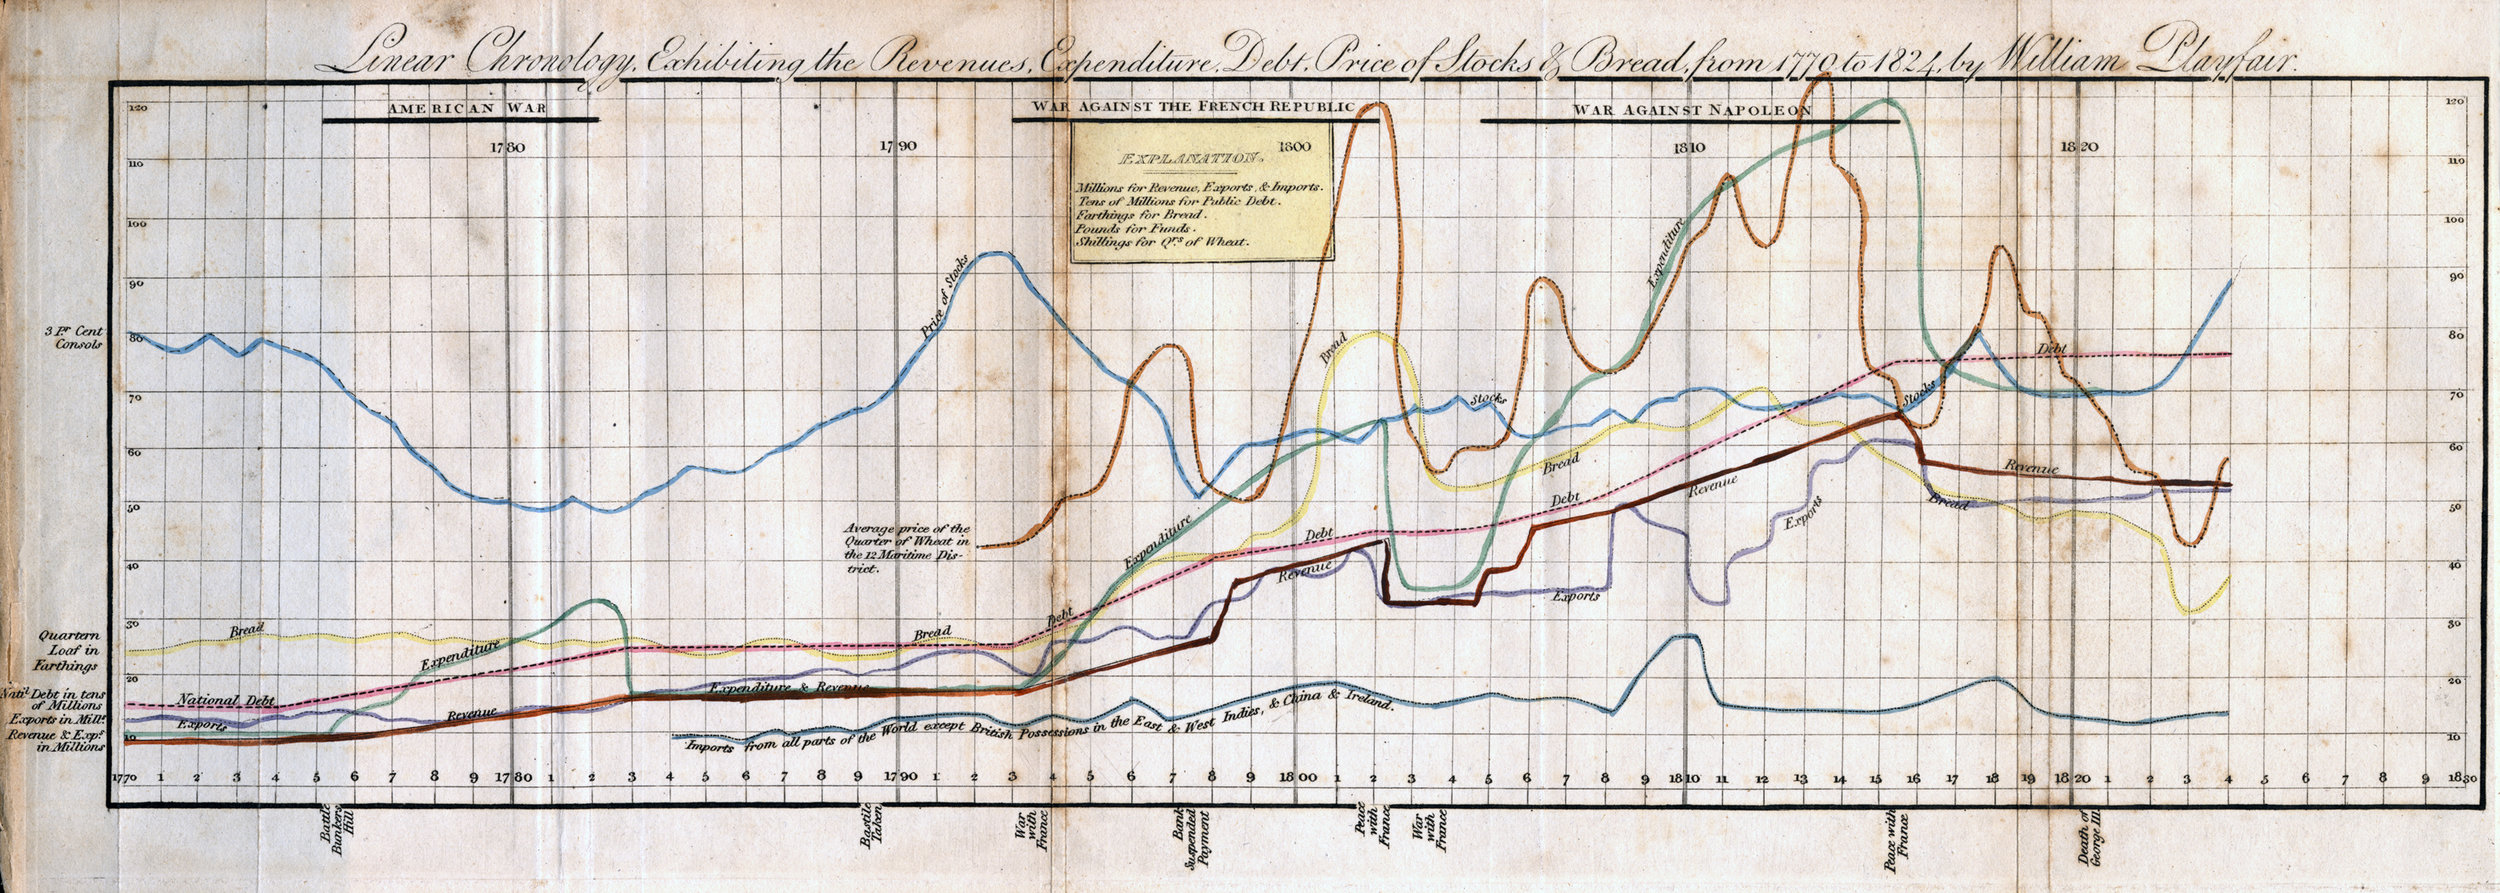
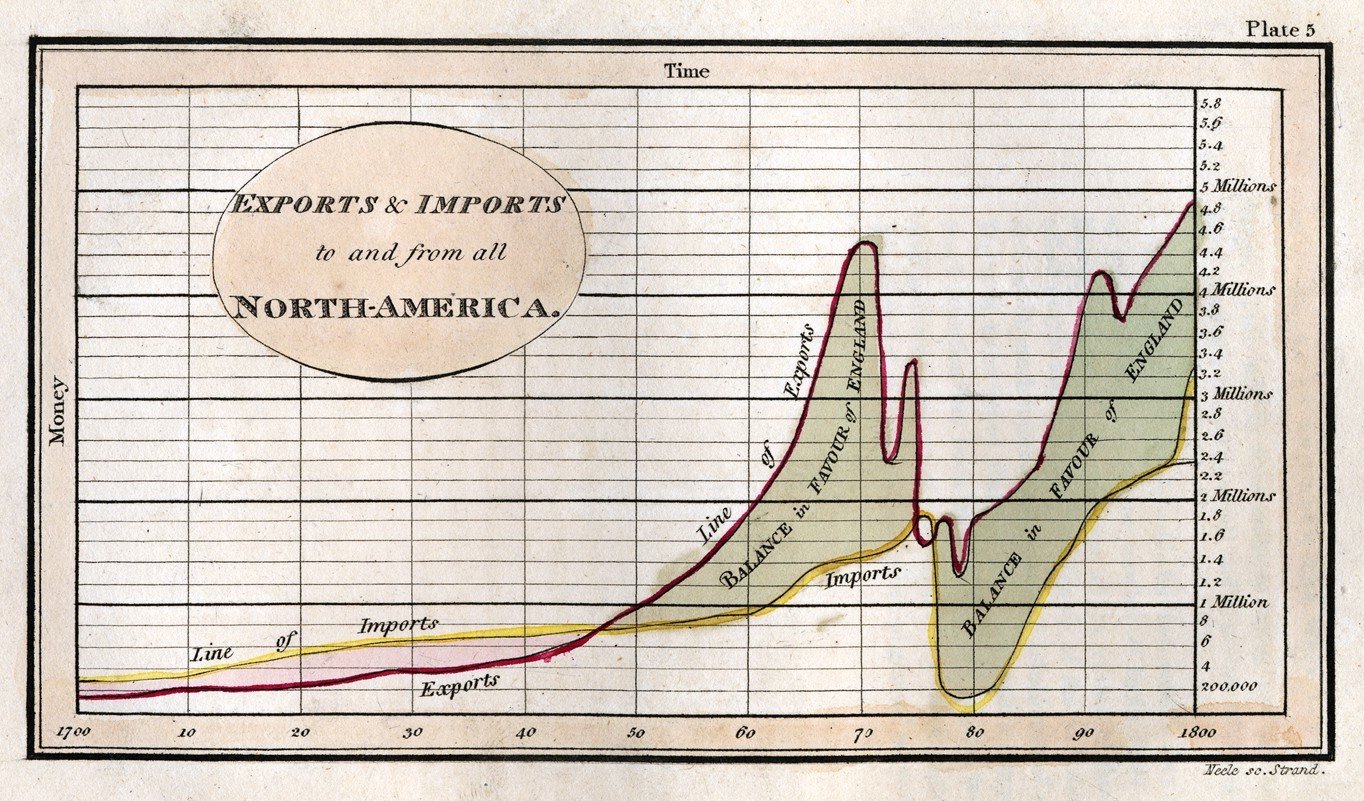
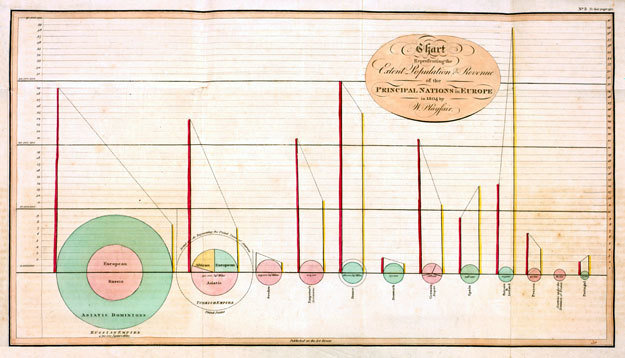
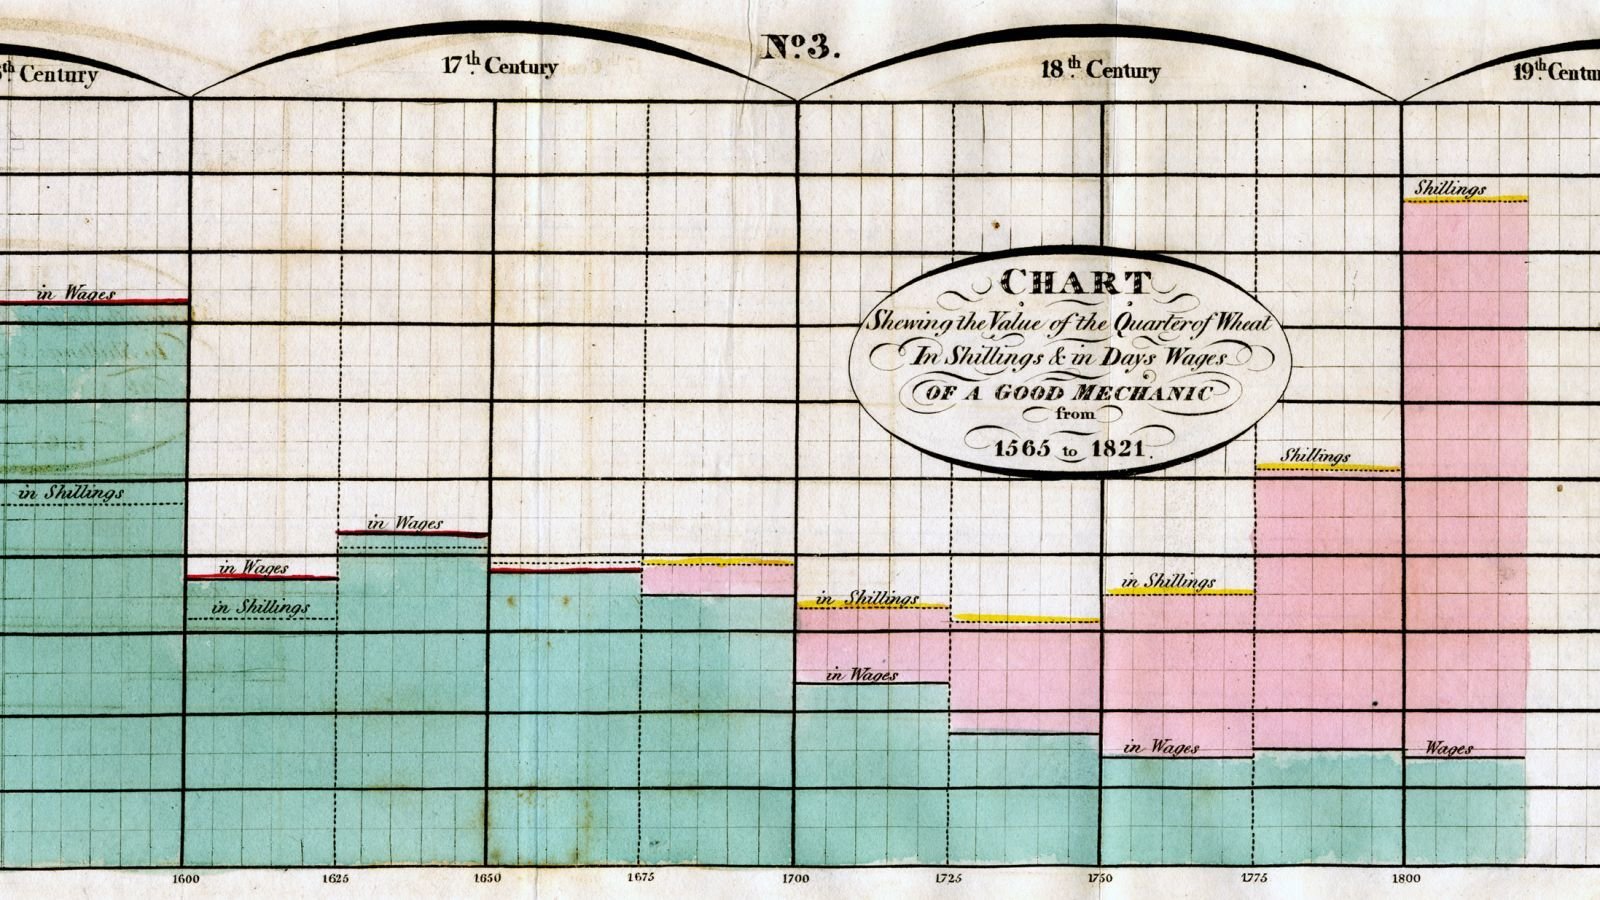
1786, 1801 - William Playfair
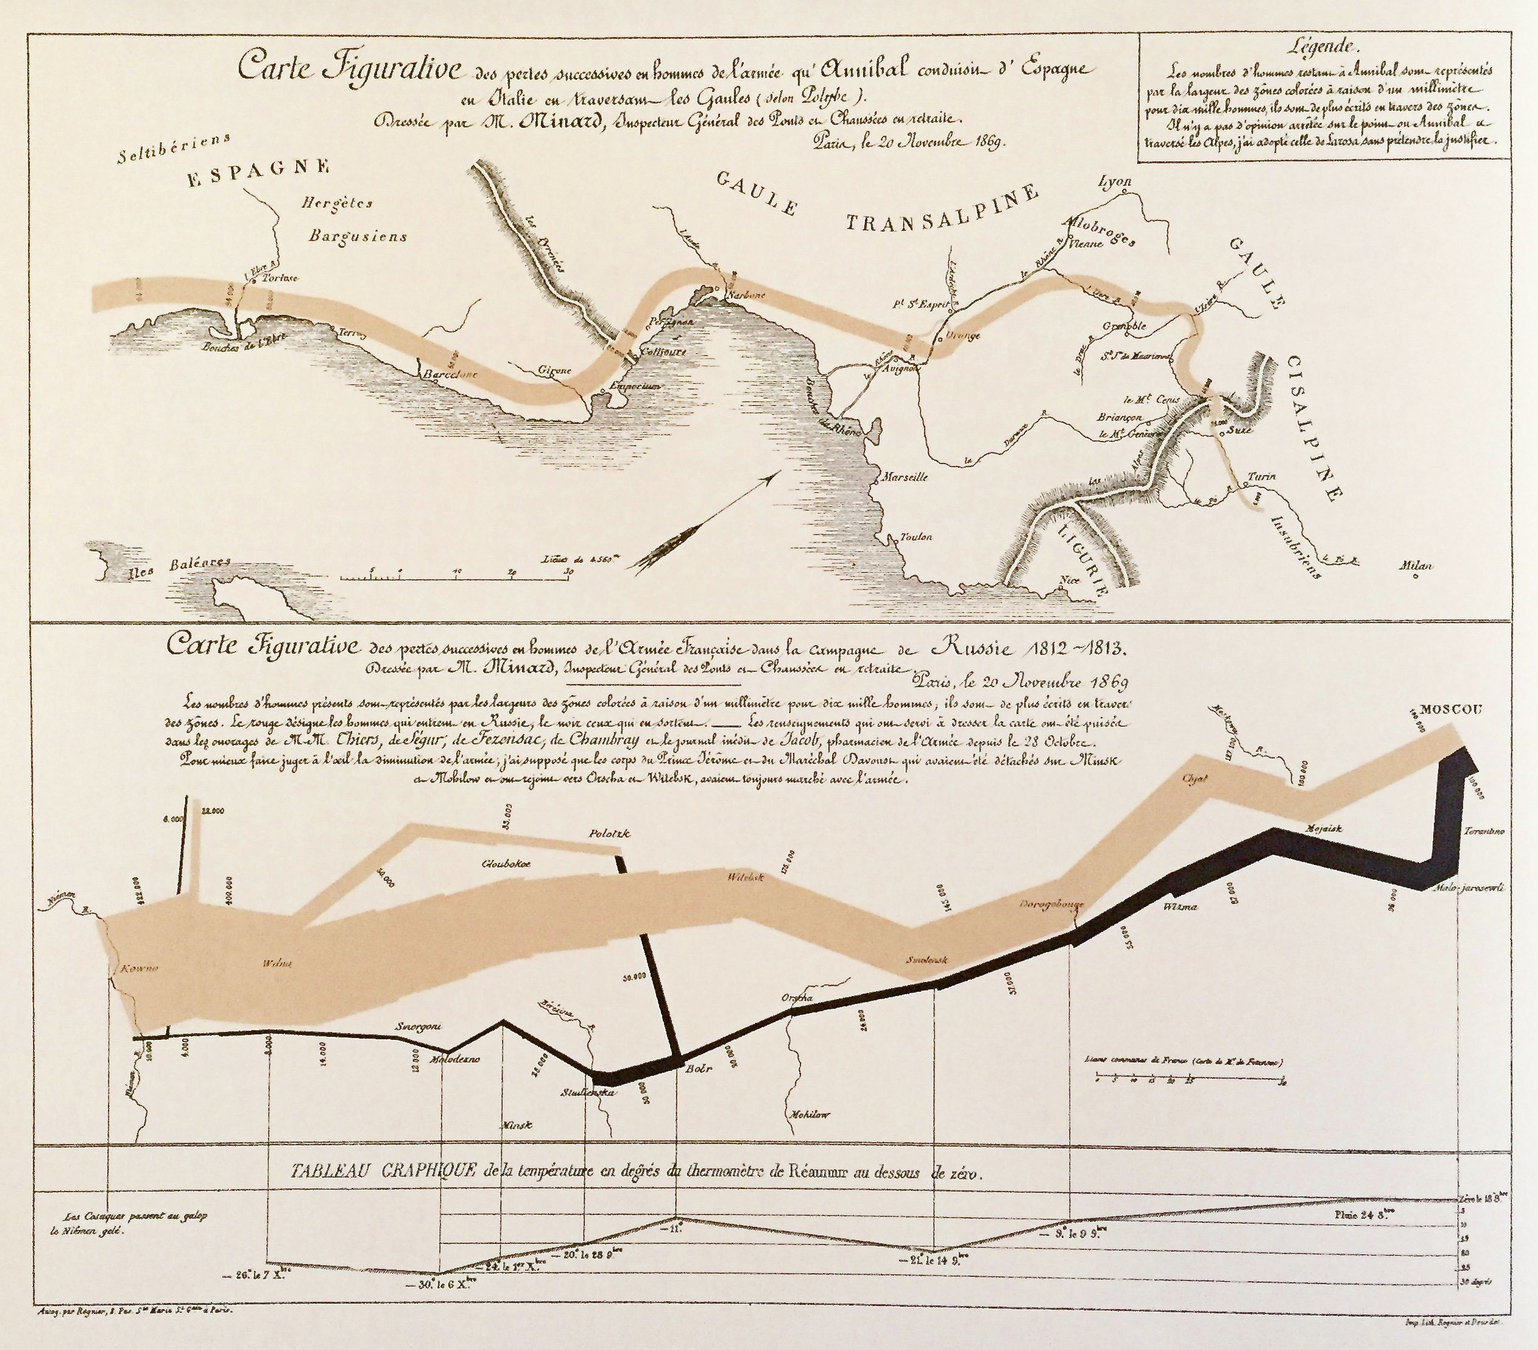
Minard
1844/1870
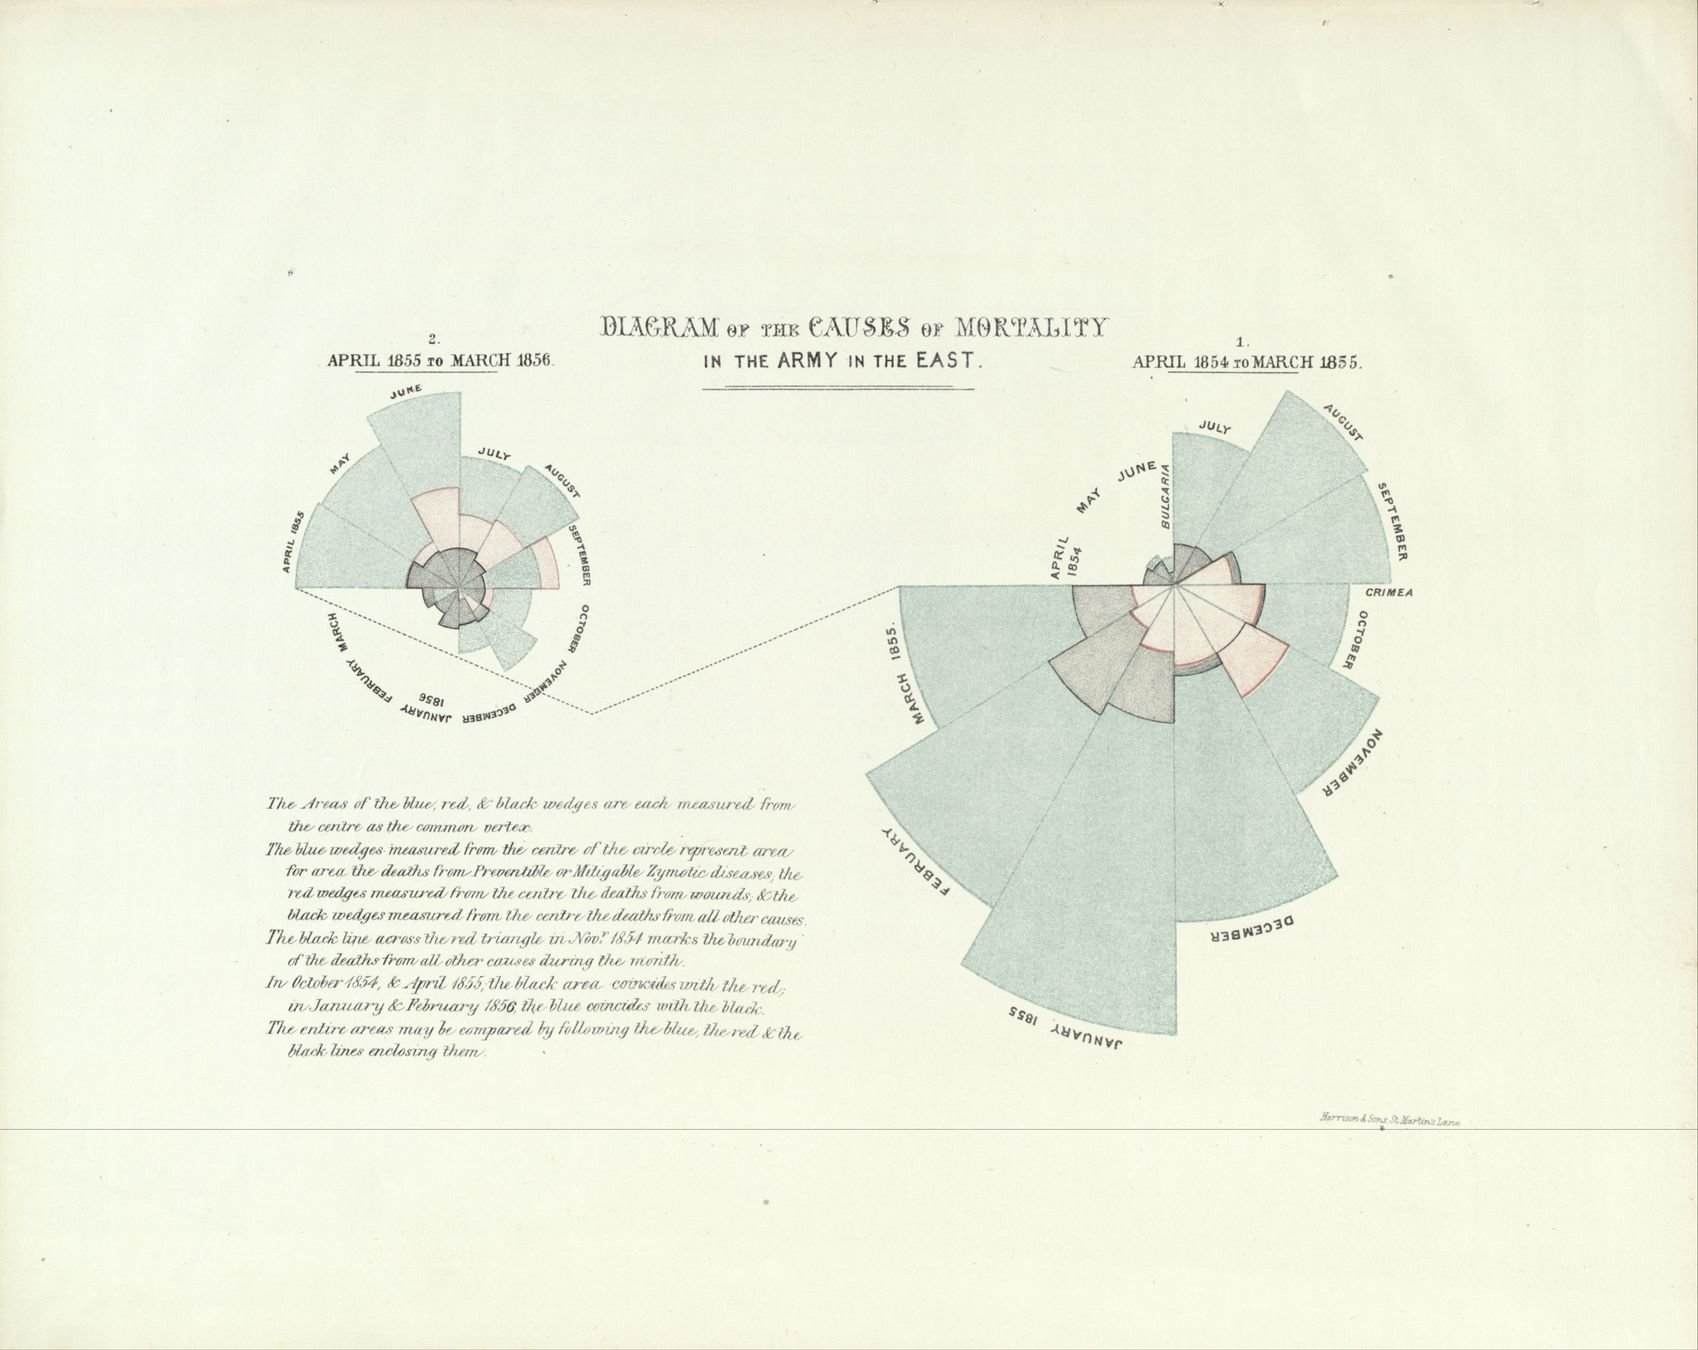
Nightingale
1856
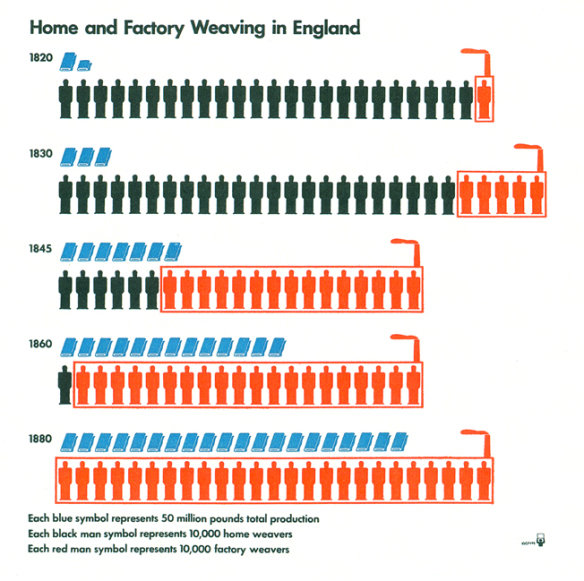
Neuraths
1925
Data visualization and visual culture
By Attila Bátorfy


