The History of Information Graphics
Lesson 7
- dots, lines and bars
Preludes
Early concepts of coordinates
Eratosthenes of Cyrene (276BC–196BC) - latitude-longitude

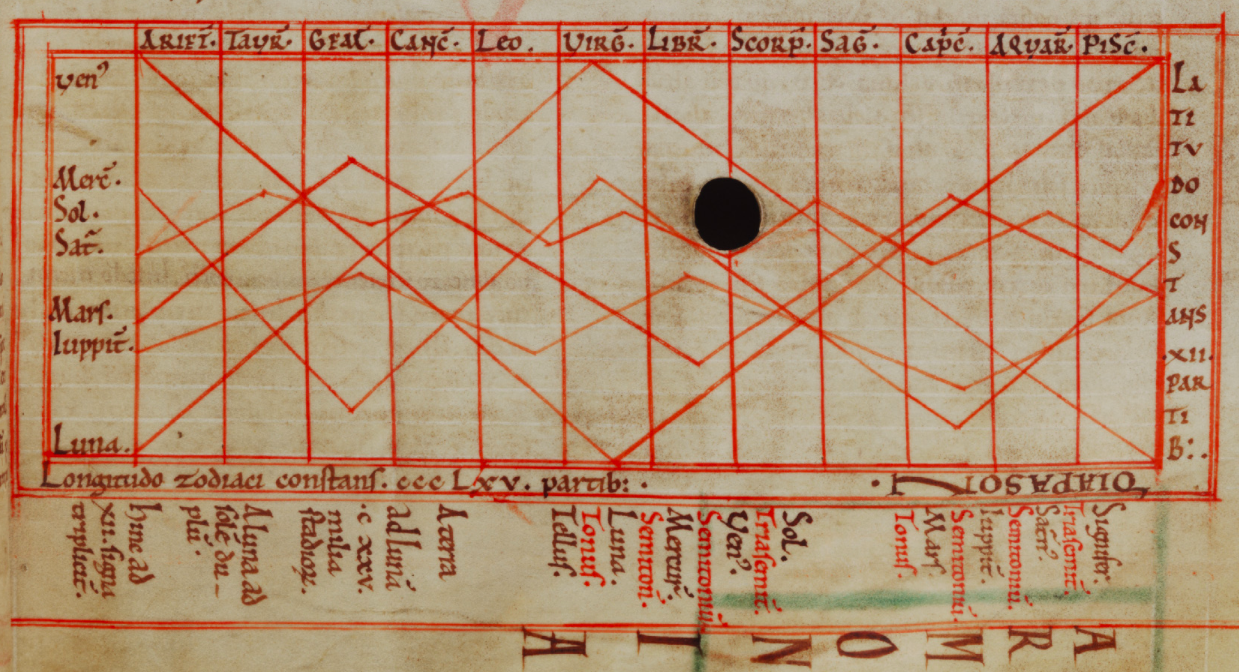
Anonymous - De cursu per zodiacum, appendix to Macrobius' commentary to Cicero's Sloemnis Scipionis, ca. 950


Nicole Oresme (1325–1382) - Latitude of forms (proto bar charts), ca. 1350

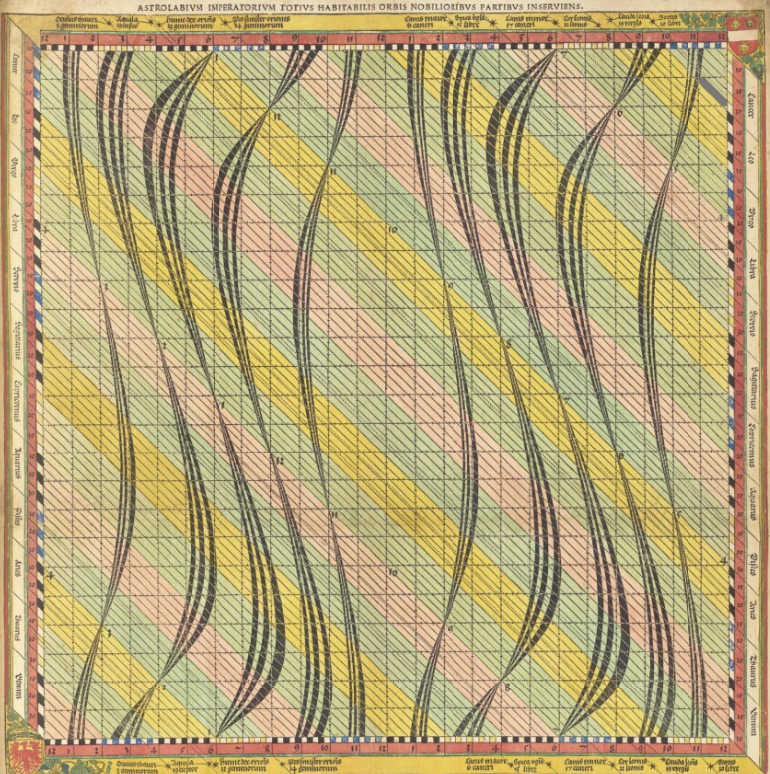
Johannes Stabius (1450–1522) - Astrolabium Imperatorum, 1515, Vienna, Albertina
Graphs
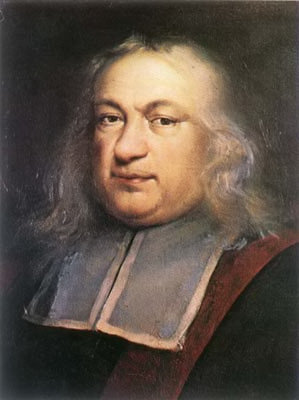
Pierre de Fermat

René Descartes
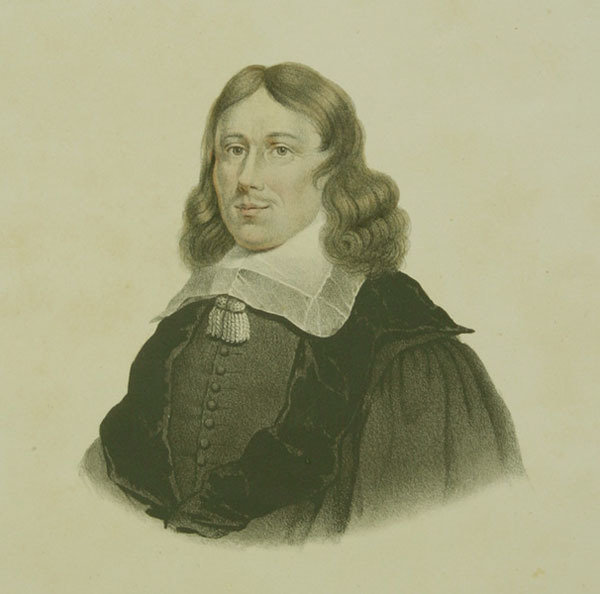
Frans van Schooten
La Géometrie
1637
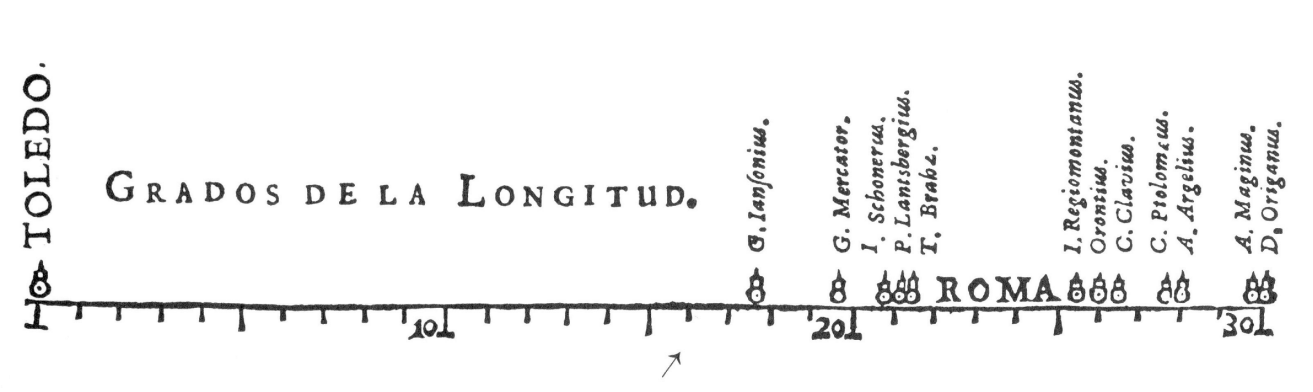
Michael van Langren - the first abstract statistical graph, 1644

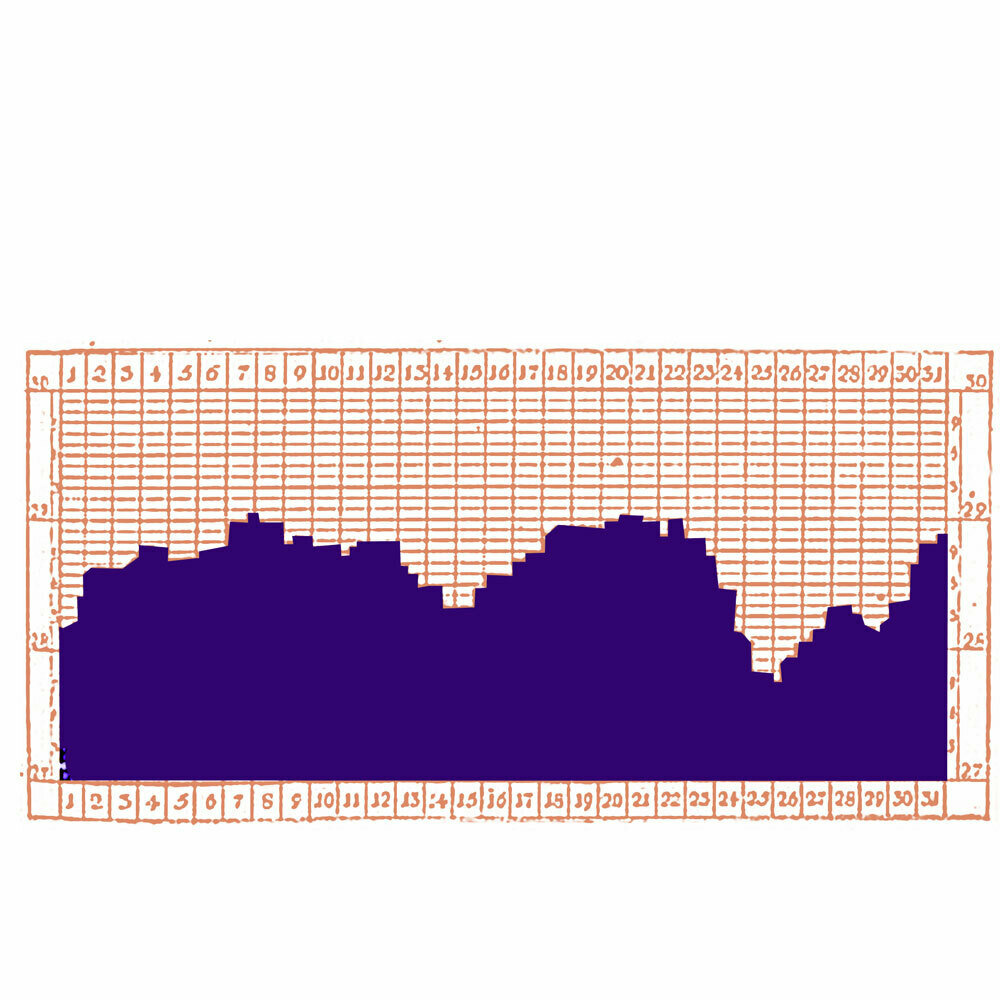
Robert Plot - History of the Weather - Barometric pressure in Oxford for the year 1684. Philosophical Transactions 1685 No. 169
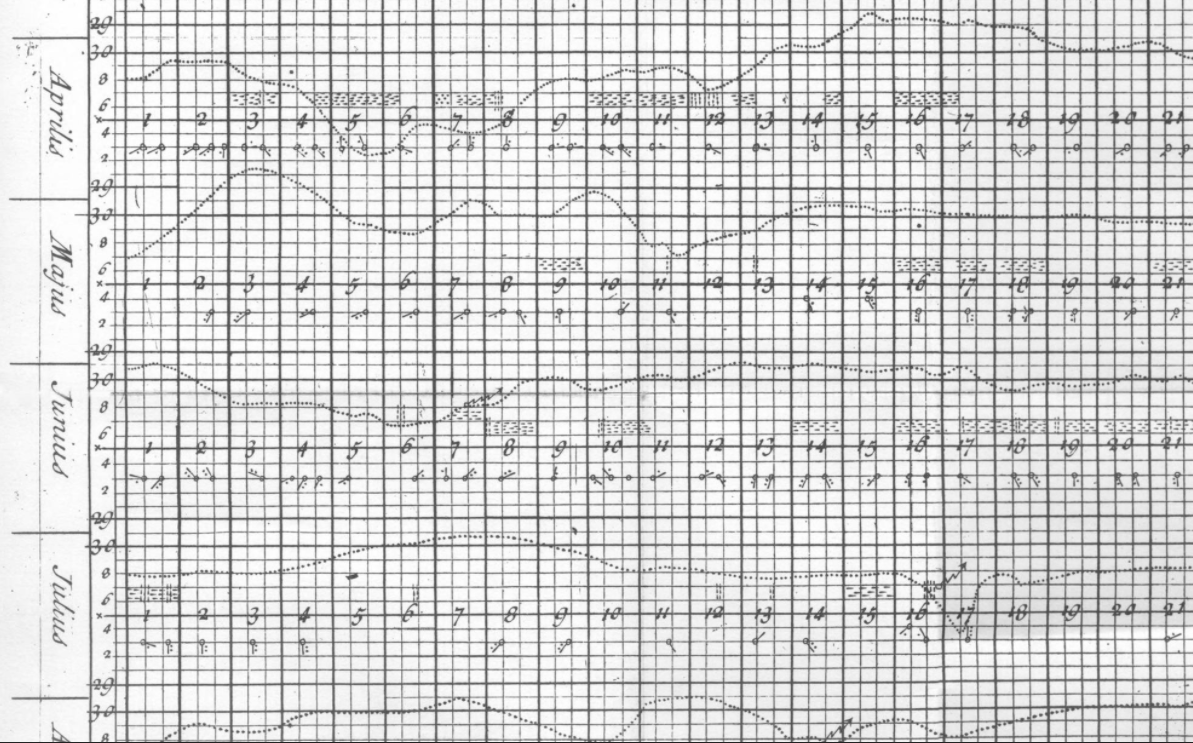
Nicolaus Cruquius - Observationes Accuratae Captae, 1724
Athanasius Kircher?
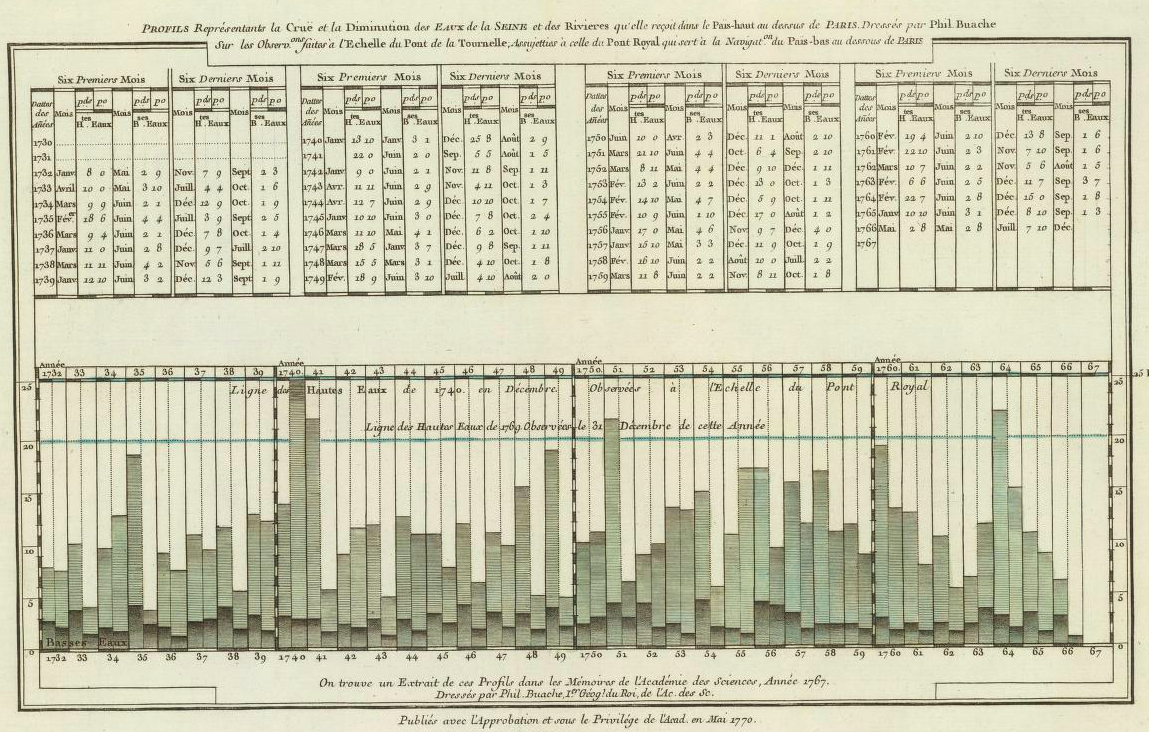
Philippe Buache - The Water Levels of the Seine, 1770
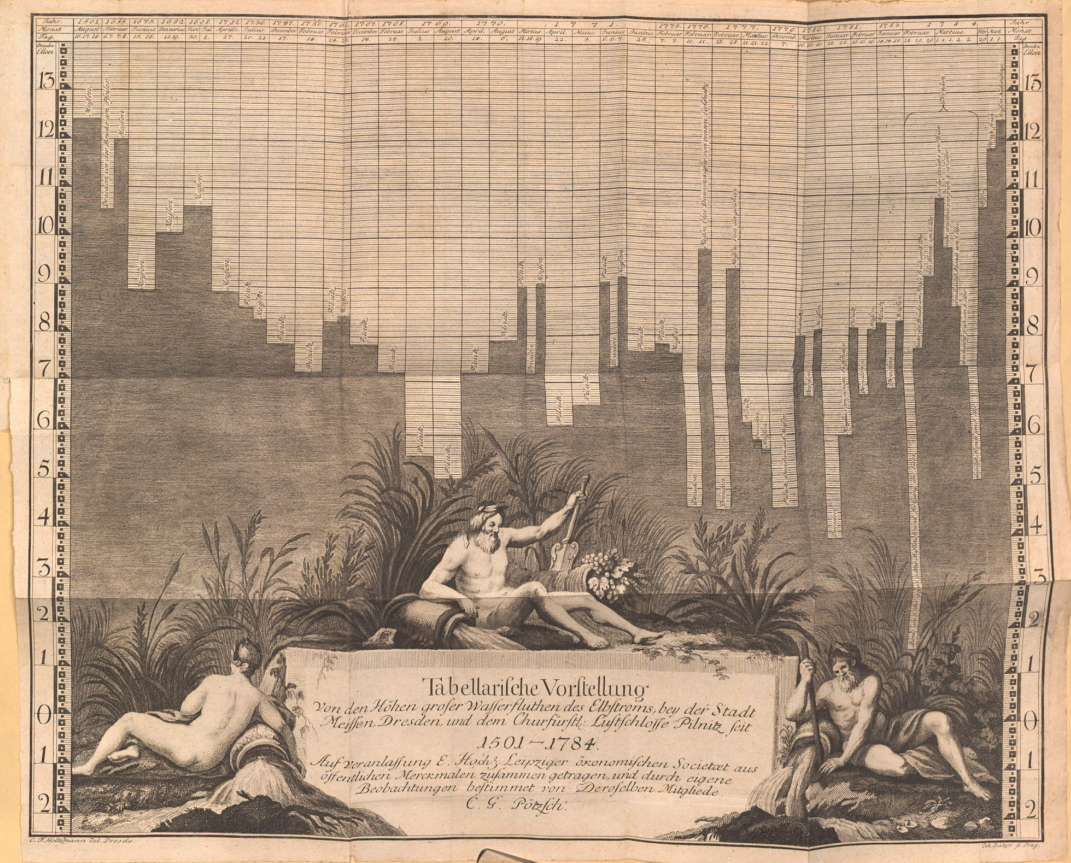
Christian Gottlieb Poetzsch - Thousand years of floods, 1784
Charles de Fourcroy, 1782

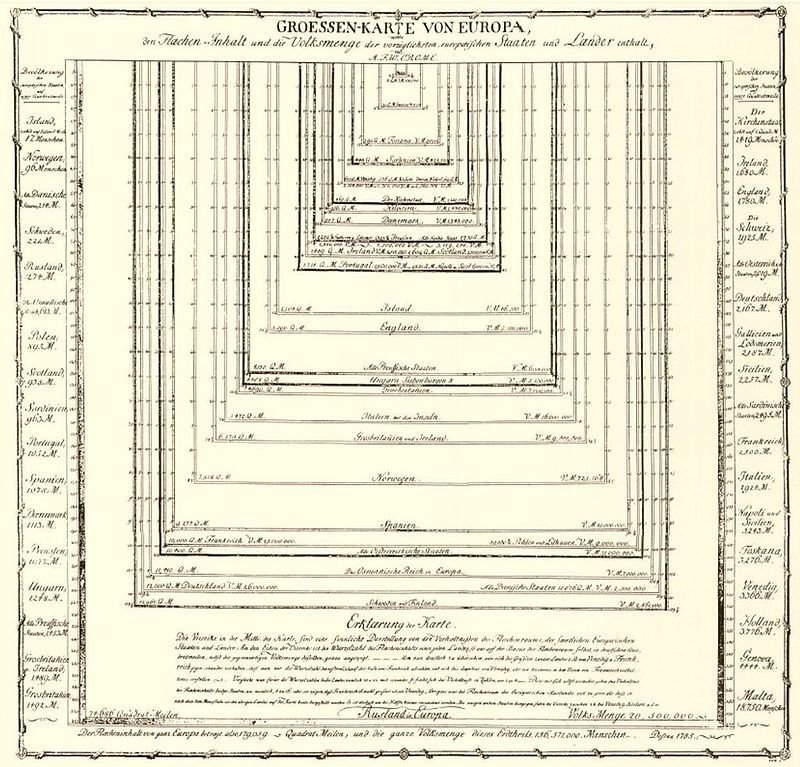
August Wilhelm Crome, 1785
William Playfair, 1786, 1789, 1801


William Playfair, 1786, 1789, 1801


19. century
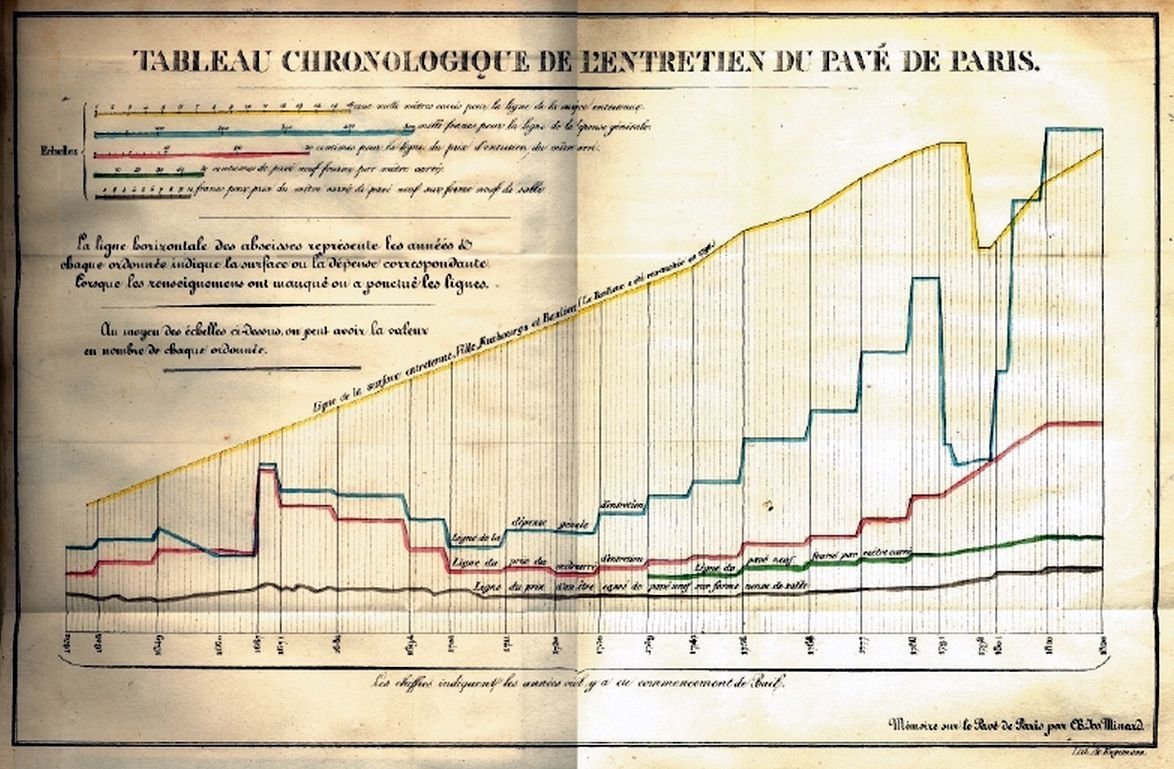
Charles-Joseph Minard, stacked "area" chart, 1825
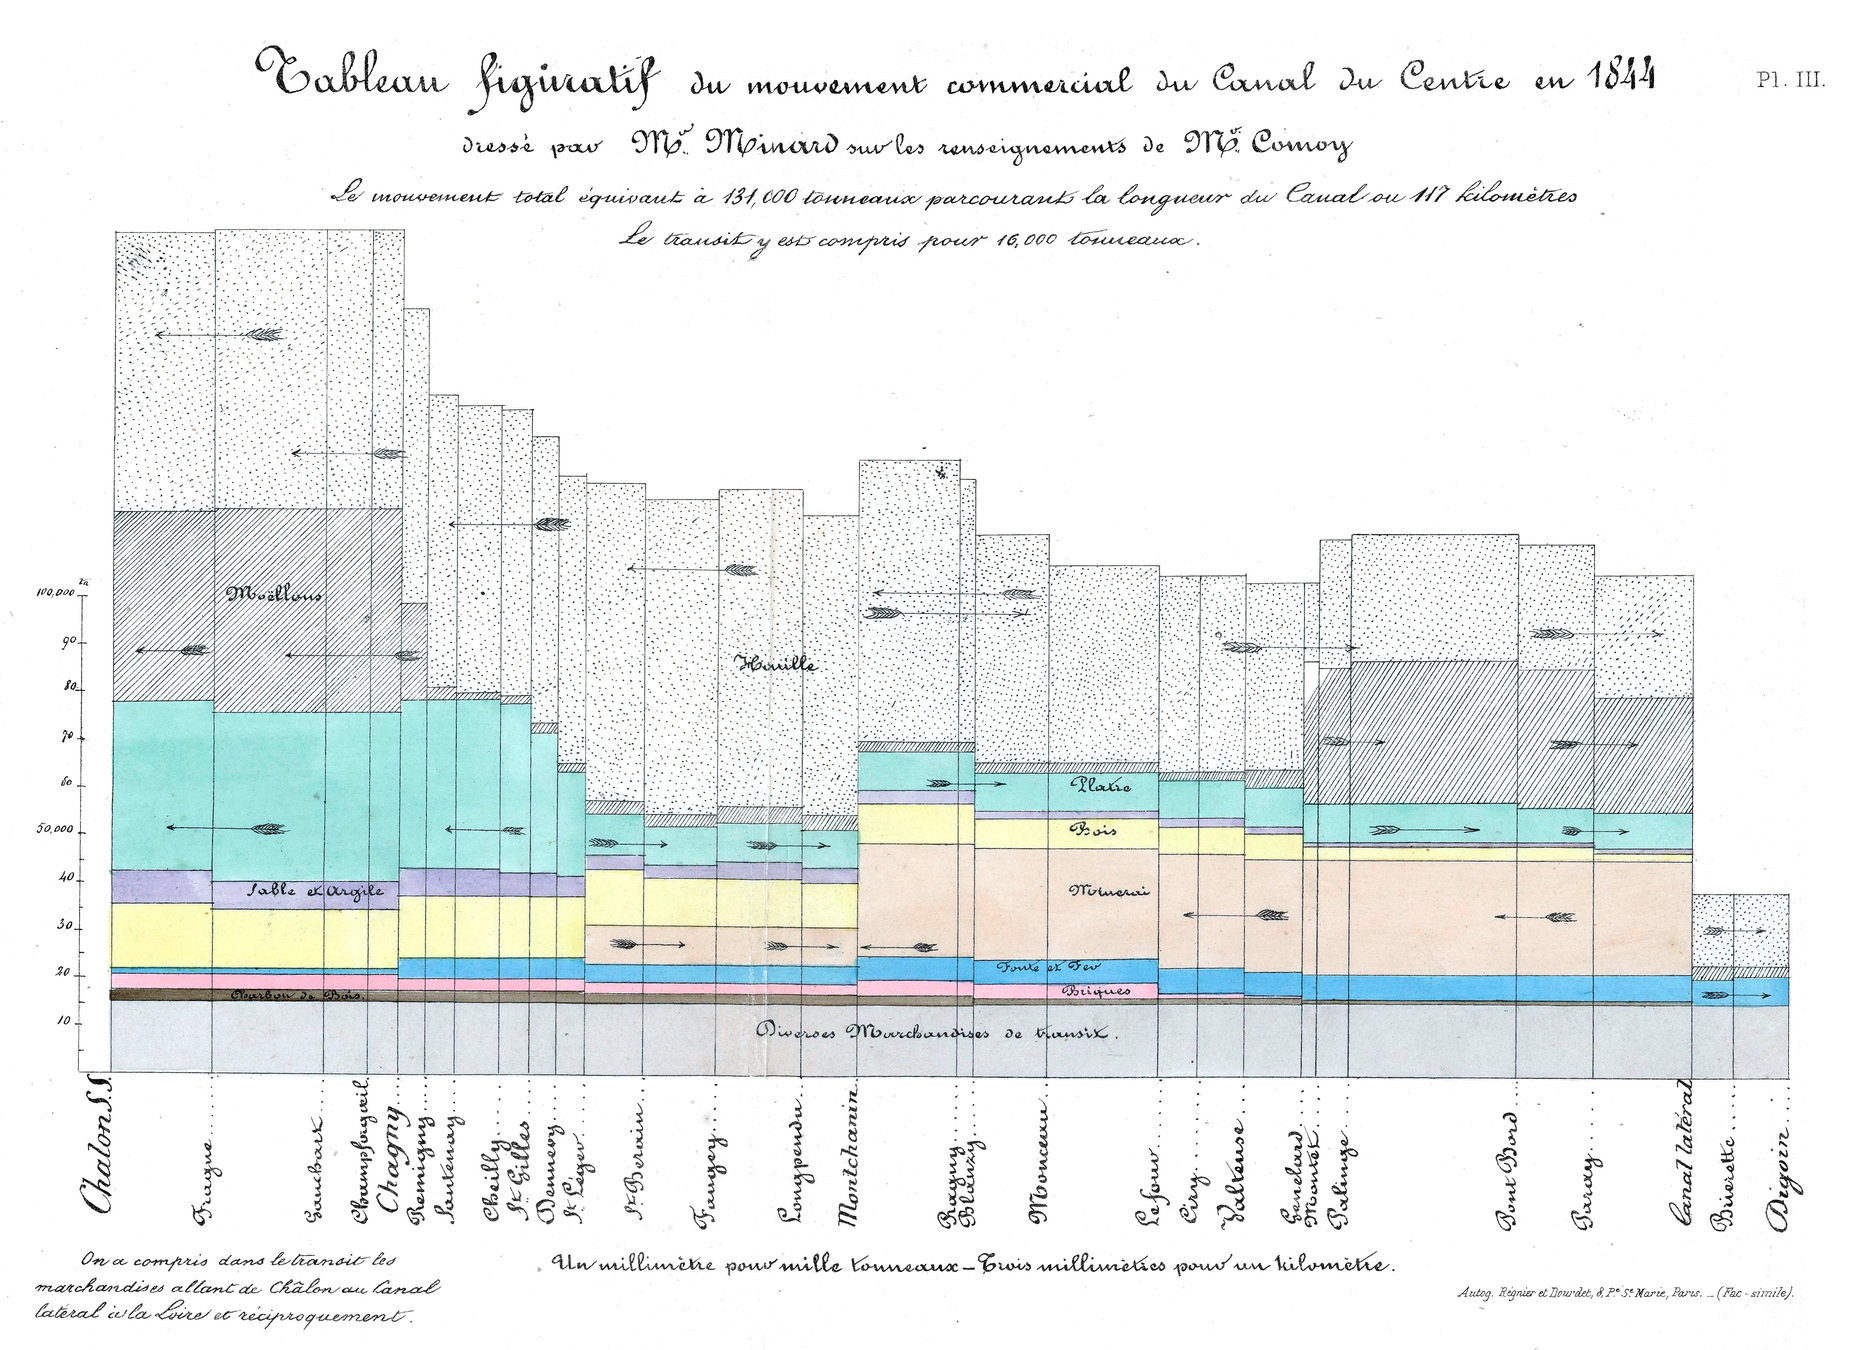
Charles-Joseph Minard, stacked bar chart, 1844
Stepped line graph
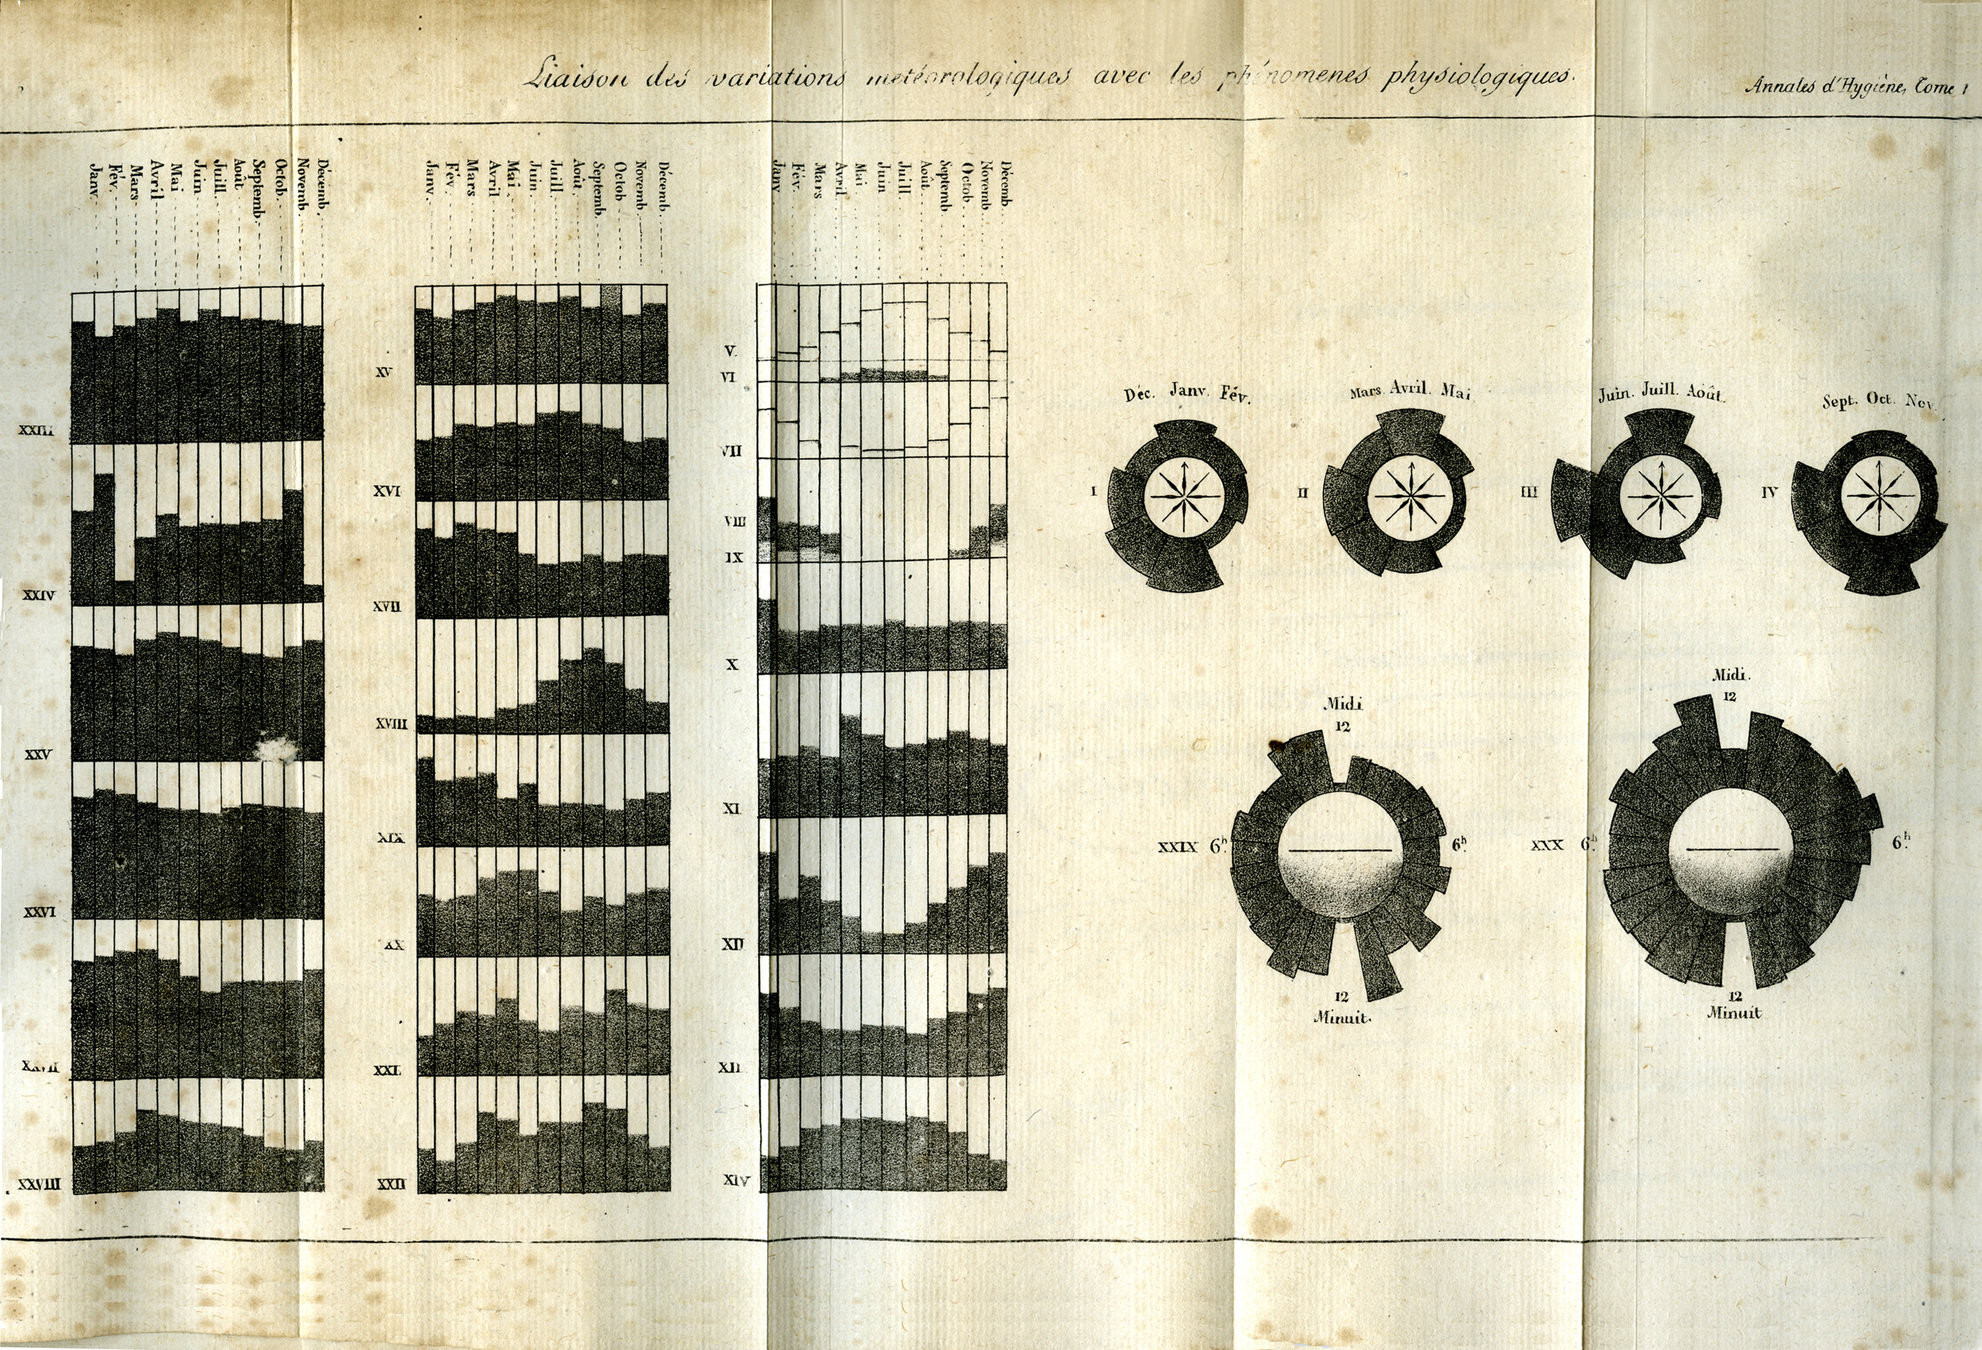
André-Michel Guerry, histogram and polar chart, 1829
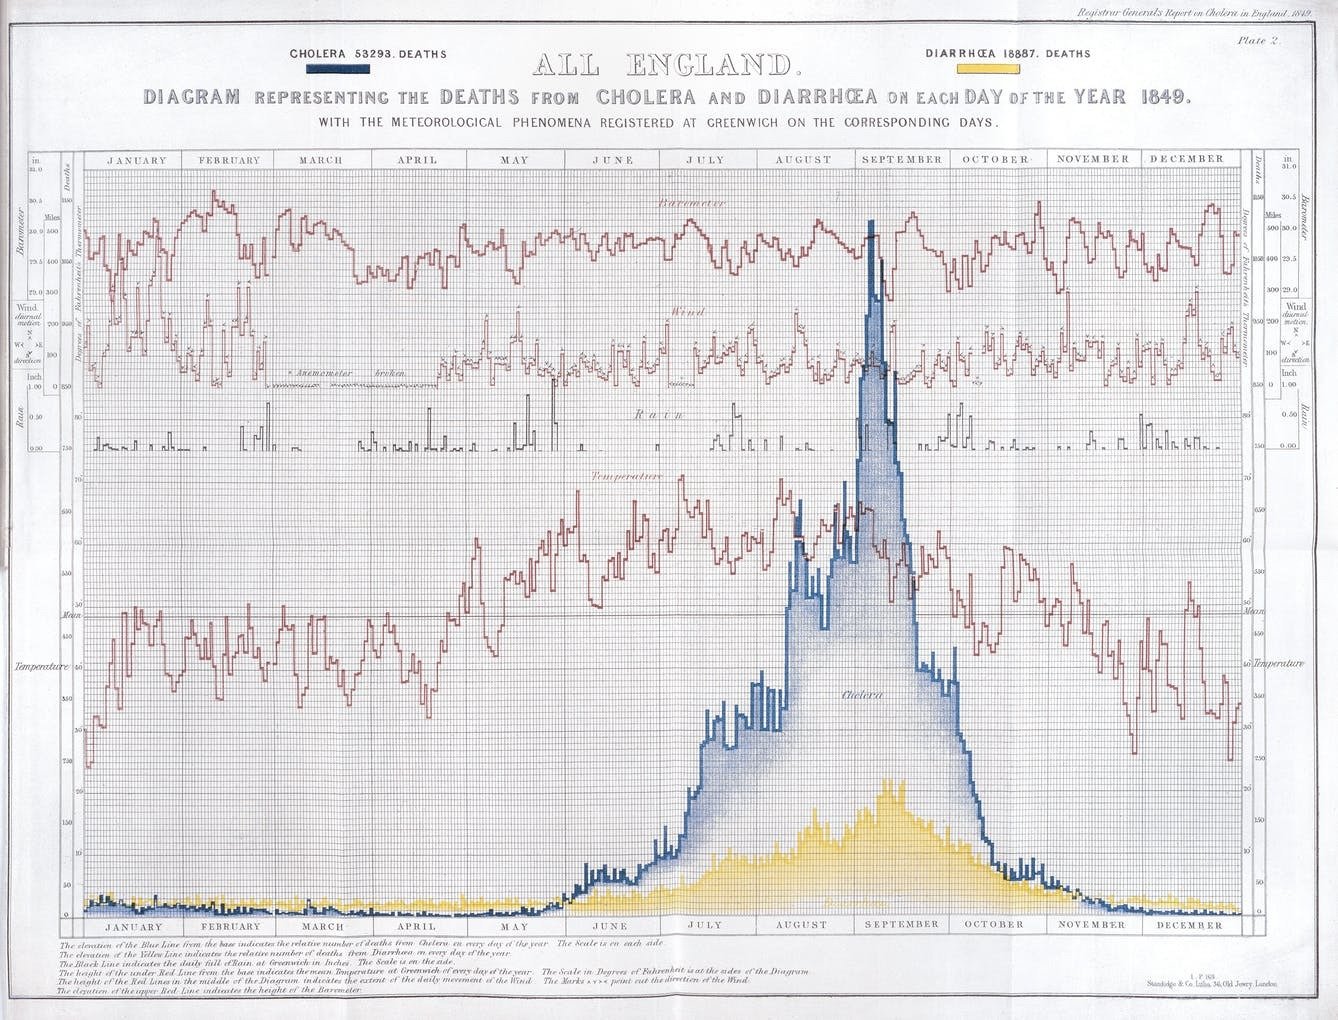
William Farr, rose diagram, 1852
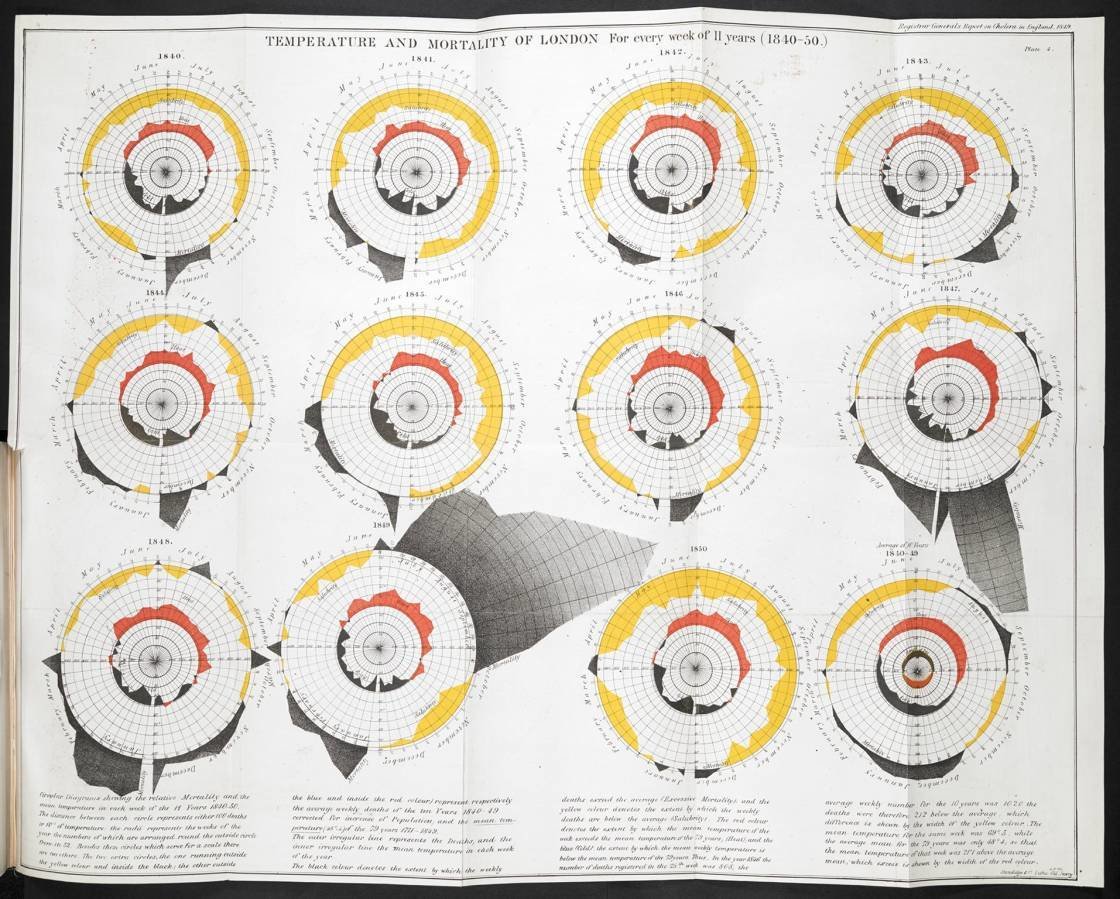
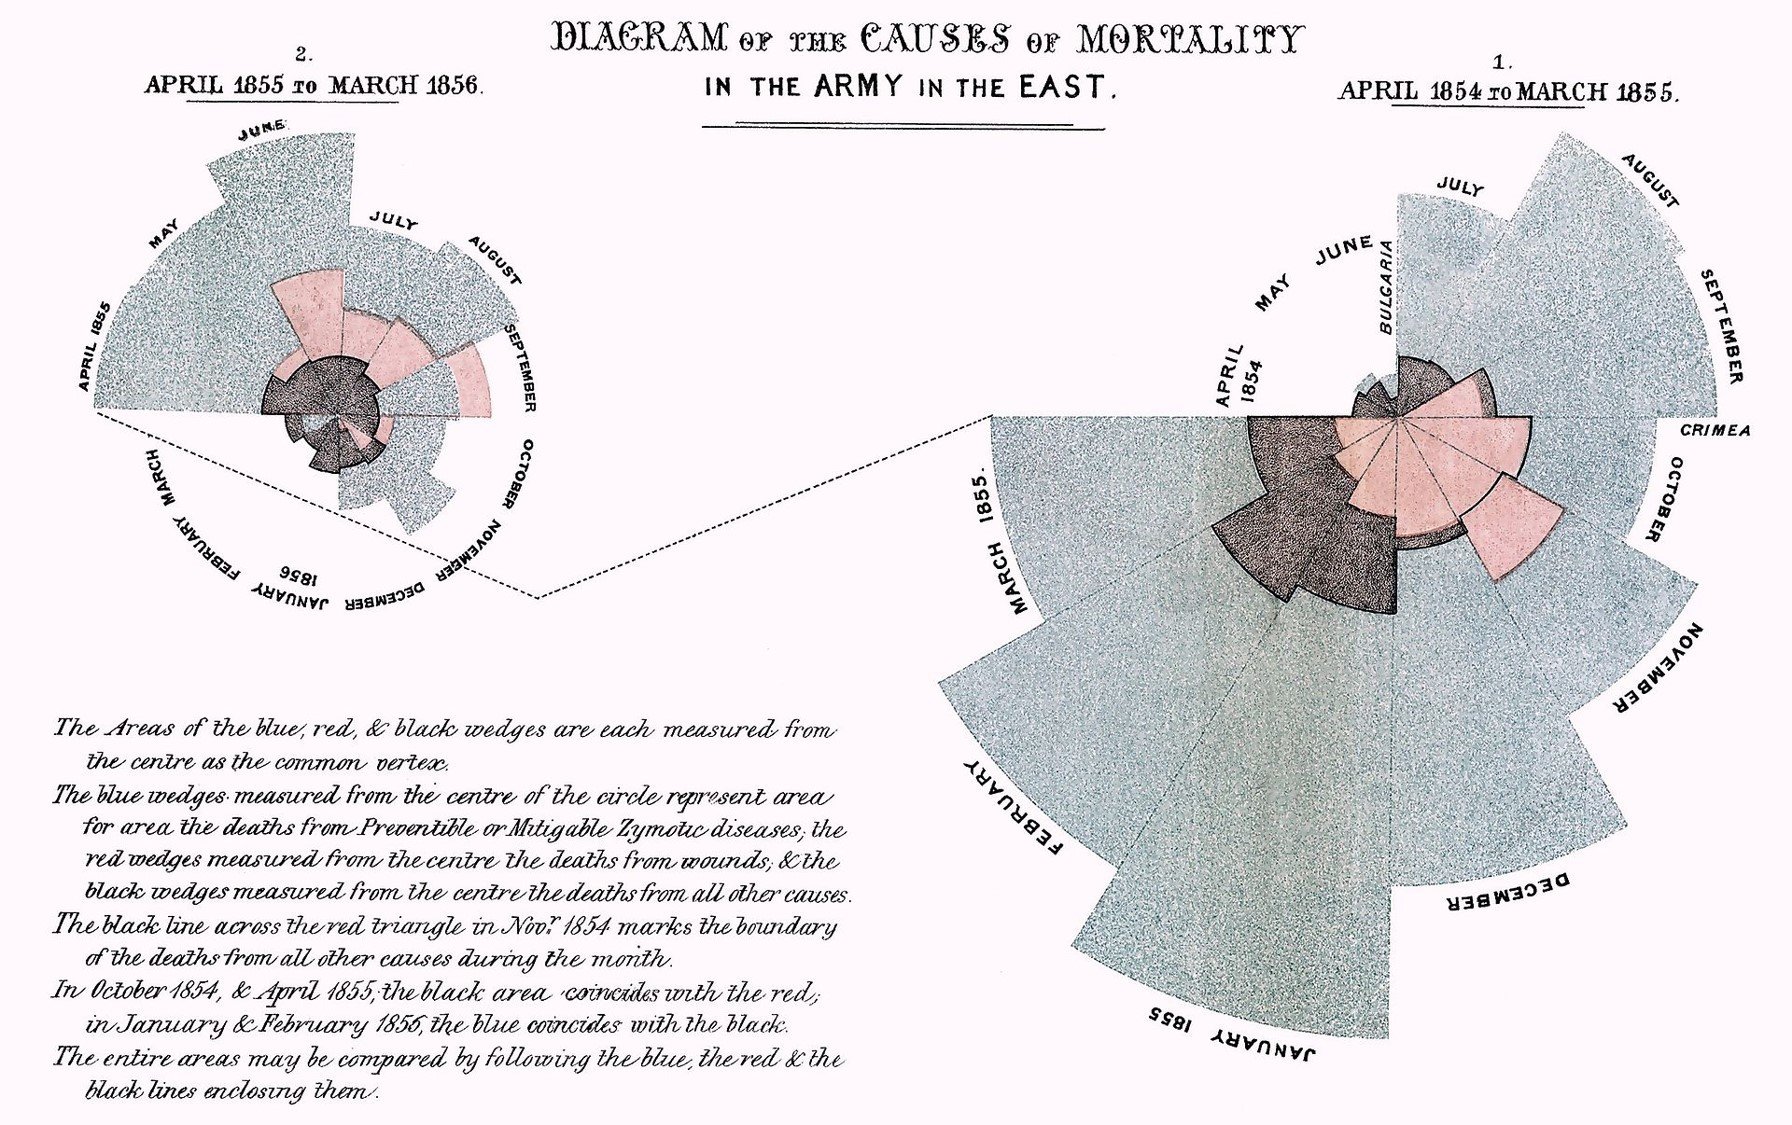
Florence Nightingale's rose/polar chart, 1858
History of Information Graphics 7 - statistical graphs
By Attila Bátorfy


