LoLStats
A League of Legends Statistics Generator

Recap of the Problem
- No personal map based visualisations
- Existing map visualisations are for groups or professional players
- Riot provide an expansive API for per-match statistics for any player ranked games
Existing Visualisations
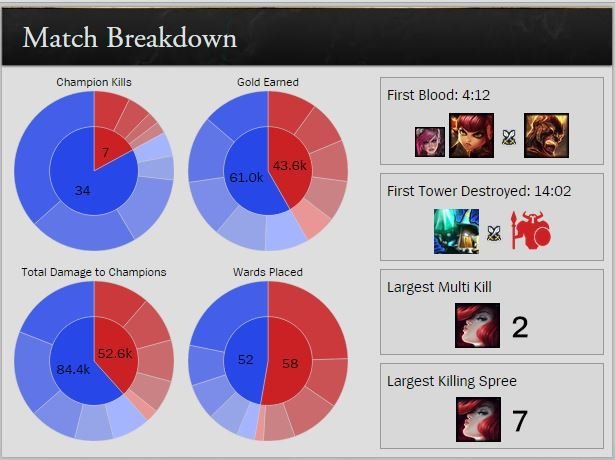
An example of the player summary statistics on LoLKing.net
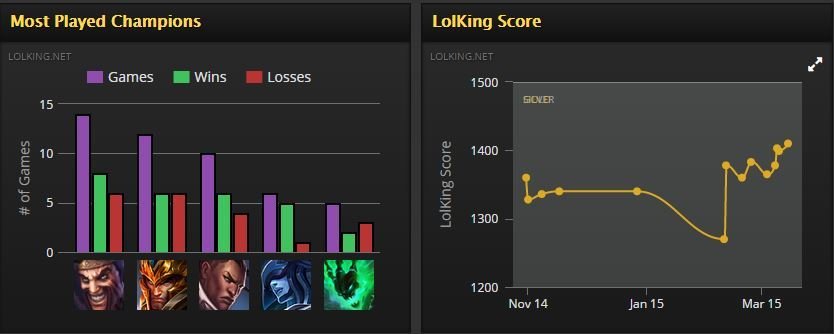

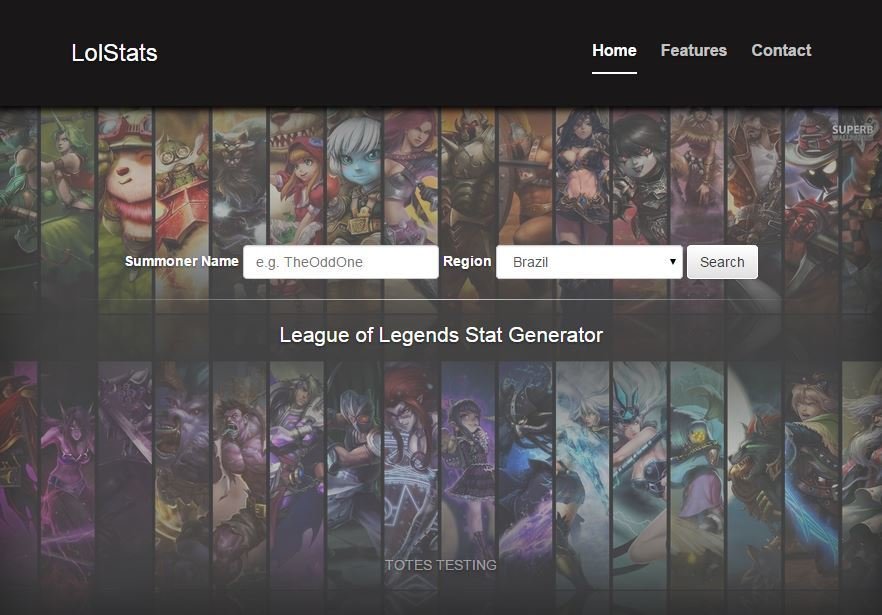
The player overview page after entering the name that the player uses in League of Legends
Riot provide their own official match history statistics. This is similar to what we had planned, but on a larger and more interactive scale

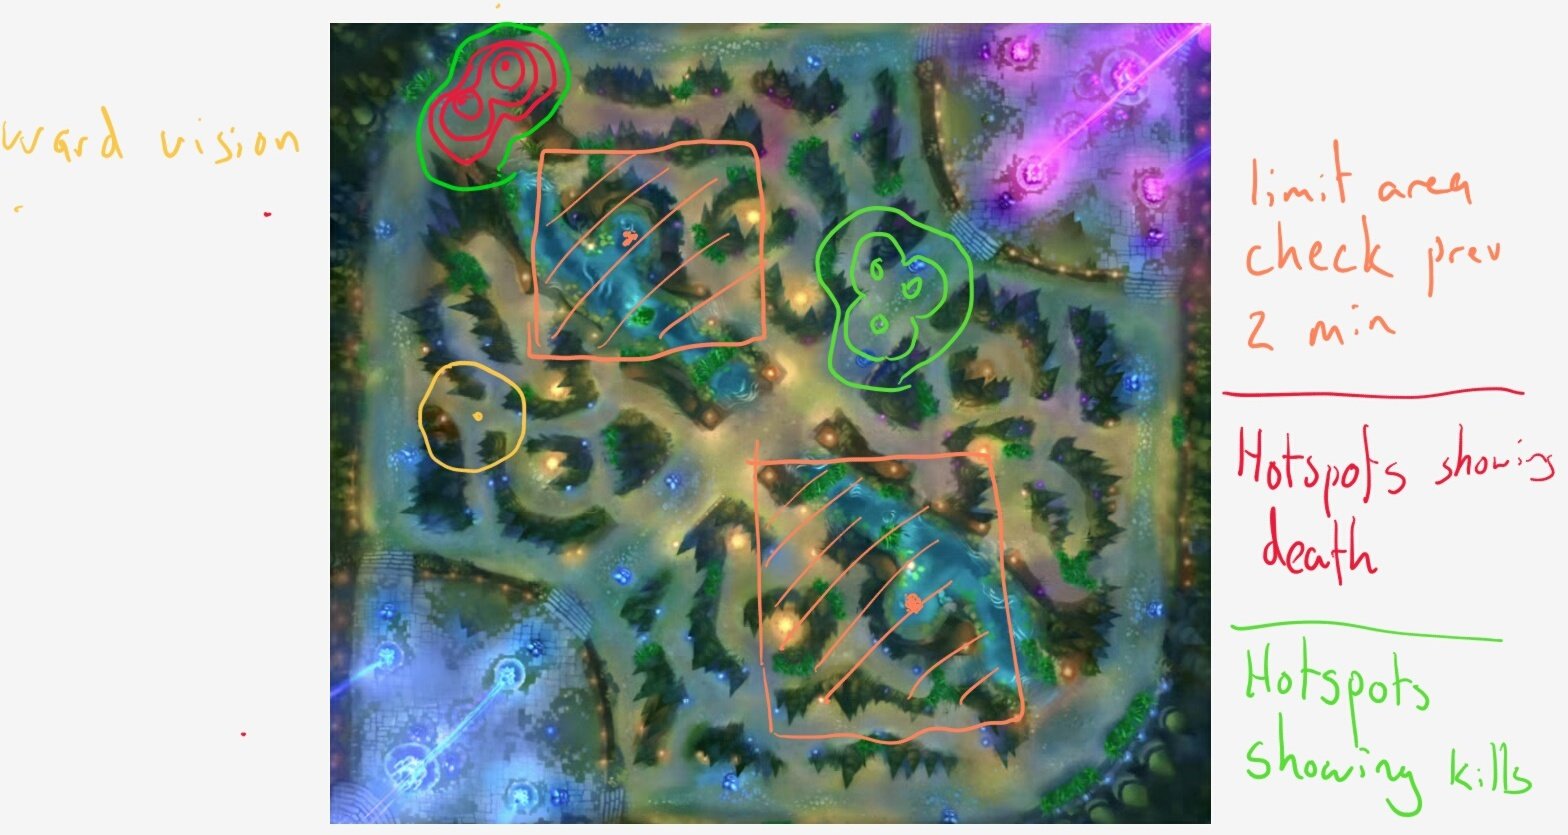
We originally wanted to use a heat-map design much like the following
We realised that while it might be a good idea for displaying broad locational data, we needed more specific data
Design Phases
Initial Design

Simple mock-up to determine which visual queries we wanted the main interface to answer
Extended view of the map to highlight crucial events and support additional queries
Second Design
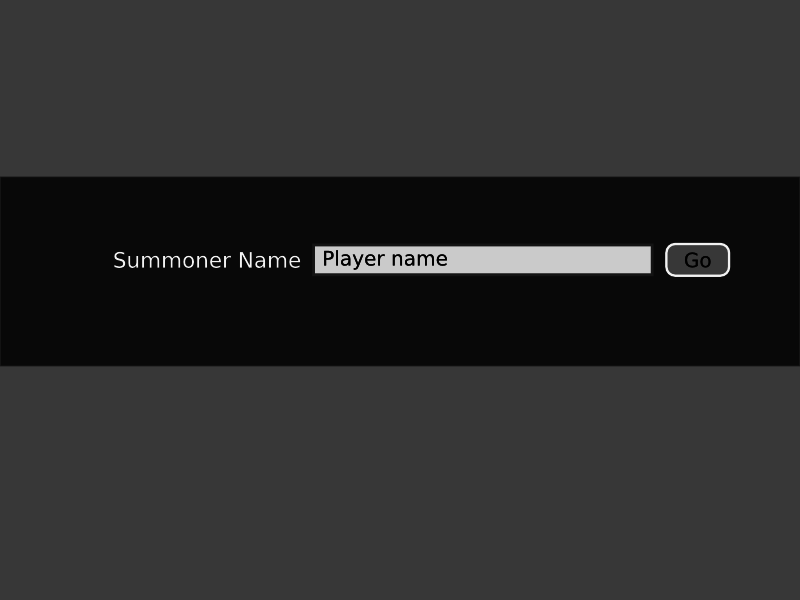
The interface needed to be usable. A search bar was added to request the player ID, since real data is used
Search Screen
Second Design
We considered various visual techniques to display important information to the user
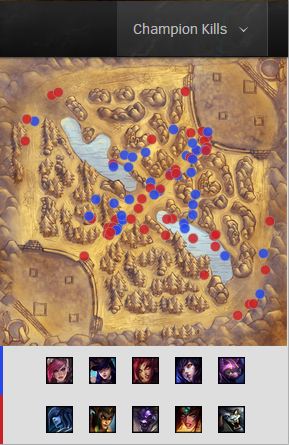
Main Interface
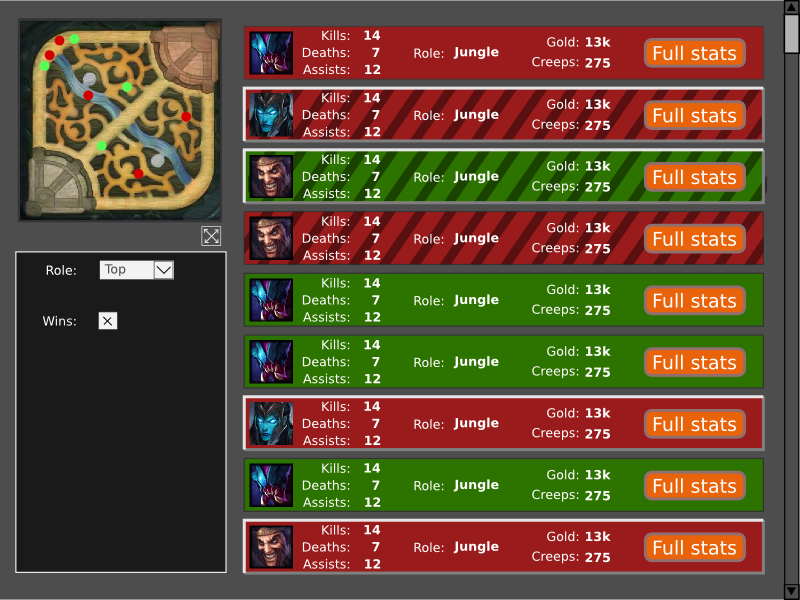
Use of texture and highlighting to show selection and colours to show wins/losses
Icons are placed on the map based on the matches selected. Red for deaths, green for kills
Second Design
- Most important view of the visualisation
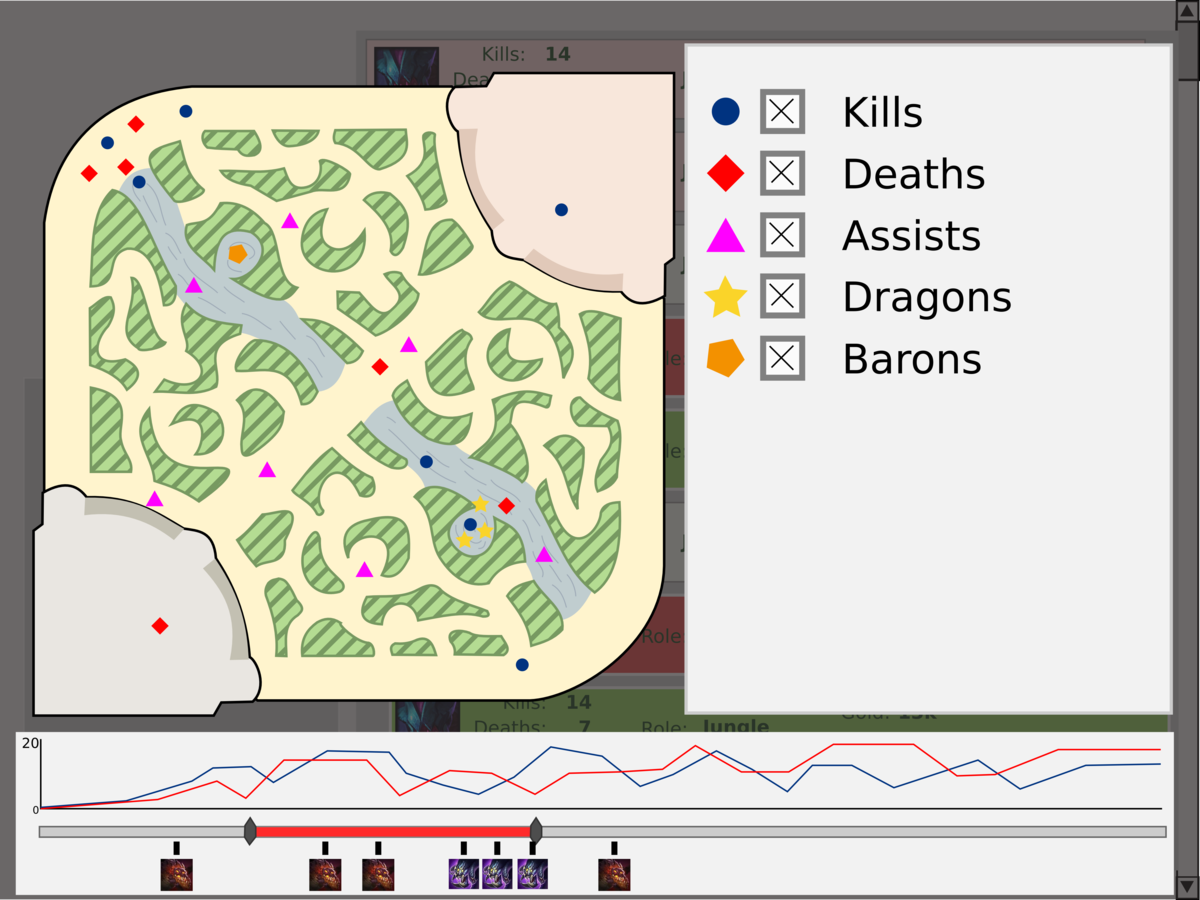
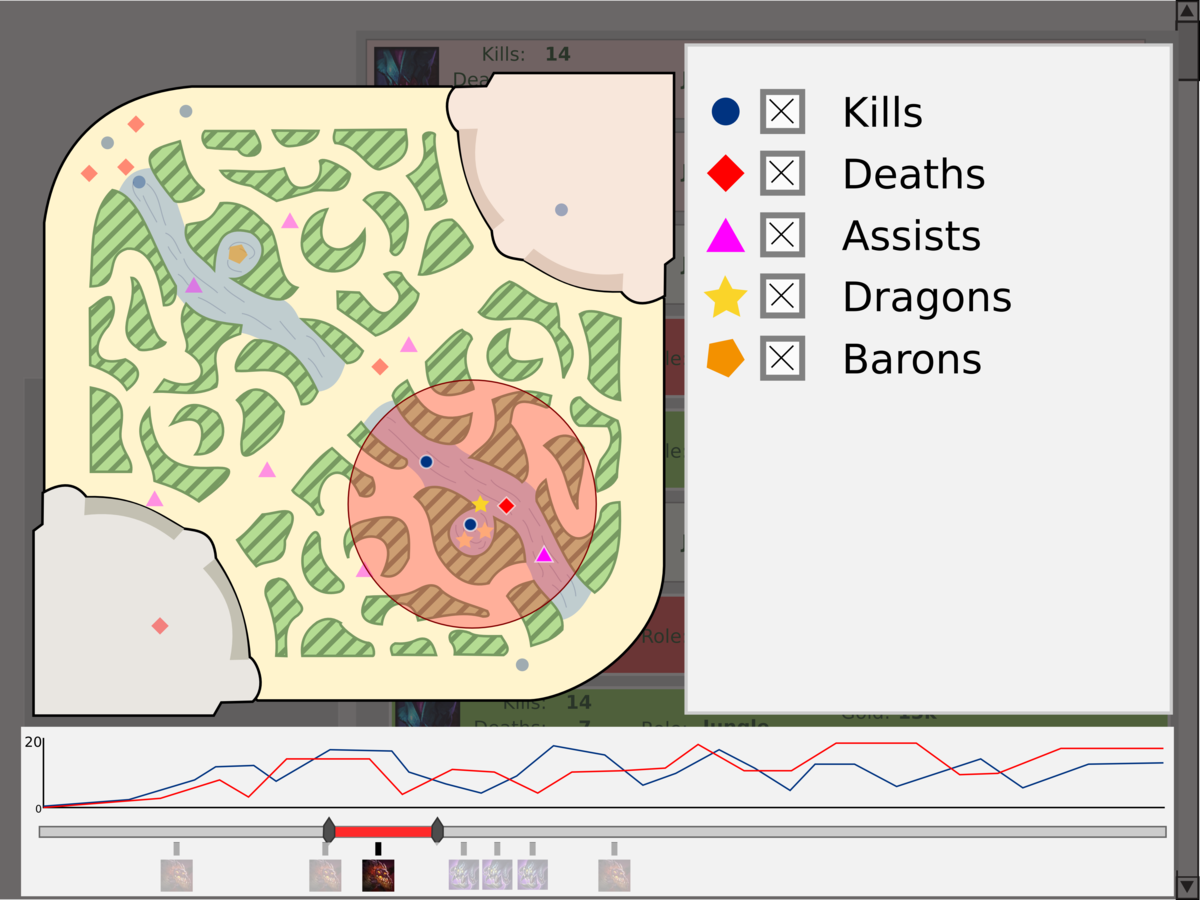
Map Interface

- Heat-map to show specific events
- Filters to easily toggle data on/off
This design has clear issues that we did not consider at the time
Critique and Response
- Compare against other visualisations
Presentation
- Clearly defined visual queries
- Better colours on the map
Visualisation
- More information on the map through layering
- Better representation of matches selected for use in map
- Presentation style overhaul
- Different form of visualisation (heat-map criticism)
- Better use of textures and shape
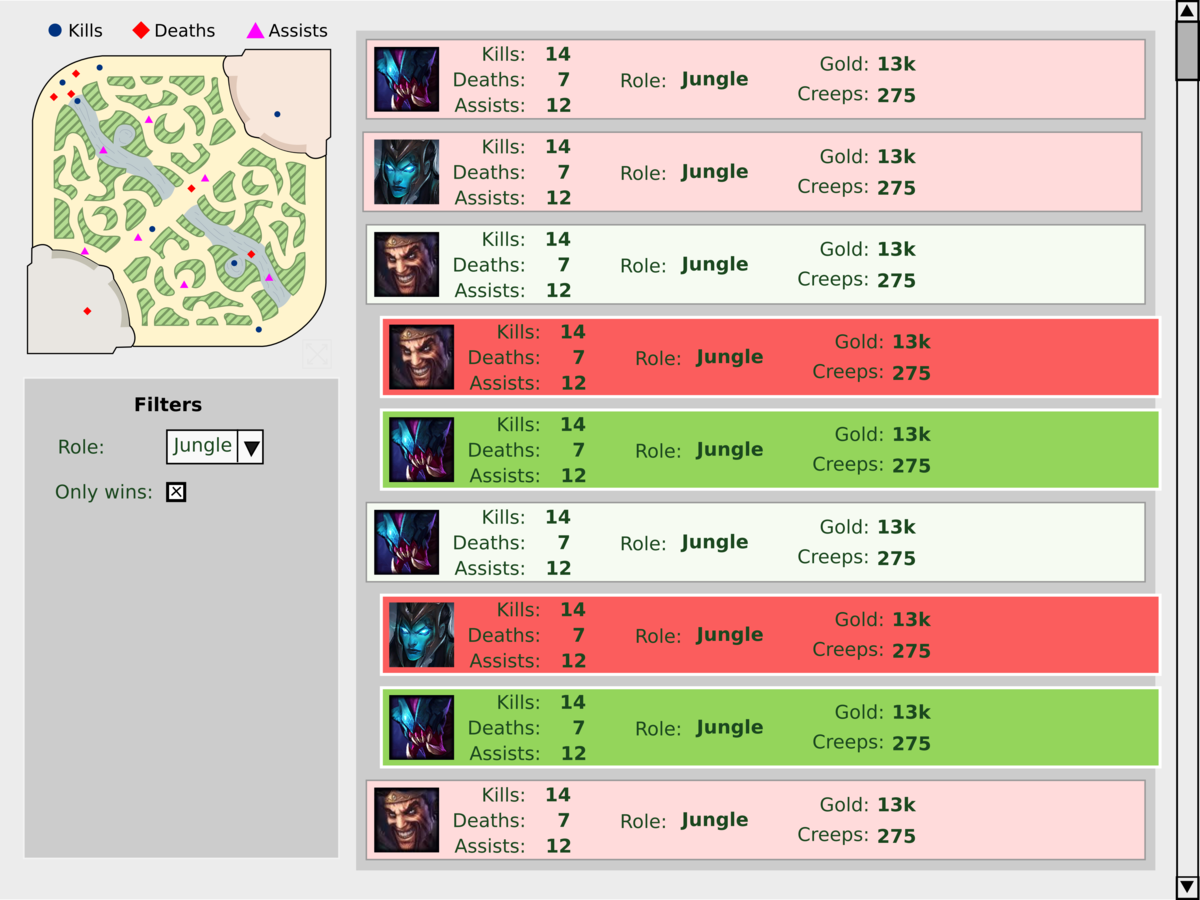
Final Design
With Critique In Consideration
Visual Queries
- How many kills, deaths and assists did I get in any particular game?
- Where did the events occur on the map during a particular game and at what time?
- Where is it that I die the most on the map over an individual game and multiple games?
- How much income do I make per game?
- What objectives am I completing at what times?
- How much time do I spend in specific areas of the map?
What We Wanted To Do
We did not want to end up with a feature-rich application, but a poor visualisation. Issues include:
- Map comparisons between different selected players
- Filtered comparison between player matches and a player playing the same role in a selected tier
- Placements and destruction of wards
- Choosing effective symbols to represent events
- Displaying large amounts of data on the map
- Can only use competitive ranked match data
Strengths
- Easy to satisfy visual queries (Where did I die, kill or assist and where am I spending most of my time?)
- Can see the impact that objective fights are having on your play
- Colours are easily differentiable and along with the texture/shape for points aids ease of query.
- Map is not overly cluttered even for large amounts of data due to time slider
- Easy to compare performance between roles
Weaknesses
- Can not compare players with one another.
- No plotting information about warding (very important, API restriction)
- Difficult to display information we want to on the timeline, would have been nice to insert items and other cool features on the timeline using some overlays or filters.
Future Plans
- Approaching LoLKing (or someone of the sort) to host the visualisation and link with their data (additional rich data like LoLKing score) for more effective and meaningful data.
- Adding item information to the time slider (purchases, use, etc.)
- Adding a functionality for cross player comparisons or live cross role comparisons.
LoLStats
By Eugene de Beste