Intro to Machine Learning

Agenda
- What is Machine Learning
- Machine Learning types of problems
- Intro to some basic ML algorithms
- Case study: apply ML techniques
What is ML
is the study of computer algorithms that improve automatically through experience and by the use of data
(source: https://en.wikipedia.org/wiki/Machine_learning)
Types of ML

Supervised learning
It is defined by its use of labeled datasets to train algorithms that to classify data or predict outcomes accurately
- Classification uses an algorithm to accurately assign test data into specific categories.
- Regression is used to understand the relationship between dependent and independent variables.
Unsupervised learning
Unsupervised learning is very much the opposite of supervised learning. It features no labels. Instead, our algorithm would be fed a lot of data and given the tools to understand the properties of the data
Clustering - Clustering is a data mining technique which groups unlabeled data based on their similarities or differences.
Dimensionality reduction - While more data generally yields more accurate results, it can also impact the performance of machine learning algorithms (e.g. overfitting) and it can also make it difficult to visualize datasets
Types of ML

Regression
Regression is used to understand the relationship between dependent and independent variables.
Examples: predict the outputs, forecasting the data, analyzing the time series, and finding the causal effect dependencies between the variables
Price house
Problem statement: We have a dataset with the price of some sold houses. For each house we also have some characteristics: number of rooms, size (m^2).
What can we do with this data?
Build a linear regression model to predict the price.
Price house
Problem statement: We have a dataset with the price of some sold houses. For each house we also have some characteristics: number of rooms, size (m^2).
What can we do with this data?
Build a linear regression model to predict the price.
If the price is a linear function of the number of rooms and size then we can build a model to predict price house. The model is simply a linear function:
Price(house) = a * number of rooms + b * size
Linear regression
Linear regression is a linear approach to modelling the relationship between a scalar response and one or more explanatory variables (also known as dependent and independent variables).
In linear regression, the relationships are modeled using linear predictor functions whose unknown model parameters are estimated from the data.

Price house
What if the response variable is not a linear combination of the predictor variables (features) ?
Let's assume that the price is quadratic increasing with the number of rooms.
Price(house) = a * (number of rooms) ^ 2 + b * size
Can we still use linear regression?
Price house
What if the response variable is not a linear combination of the predictor variables (features) ?
Let's assume that the price is quadratic increasing with the number of rooms.
Price(house) = a * (number of rooms) ^ 2 + b * size
Can we still use linear regression?
Yes, instead of using the features (predictors): number of rooms and size we can use new features (predictors): (number of rooms) ^ 2 and size for the linear regression algorithm.
Working with ML
Hint 1: Feature engineering is an important part of ML

Working with ML
Hint 1: Feature engineering is an important part of ML
Success of a ML algorithm very often depends on what features you choose.
We can gather useful information to build the features from a "domain expert".
Features != raw data
Linear regression alg
Linear regression can be implemented using the Least-squares estimation algorithm.
Linear regression alg
Imagine you have some points, and want to have a line that best fits them like this:

Linear regression alg
Text
We have 2 vectors: one is static and the other one is variable. We have to find the best variable vector that minimize the distance between the 2 vectors.
Linear regression alg
Text
We have 2 vectors: one is static and the other one is variable. We have to find the best variable vector that minimize the distance between the vector.
The best fit in the least-squares sense minimizes the sum of squared residuals (a residual being: the difference between an observed value, and the fitted value provided by a model).
https://en.wikipedia.org/wiki/Least_squares
Linear regression alg
https://www.mathsisfun.com/data/least-squares-calculator.html
https://setosa.io/ev/ordinary-least-squares-regression/
Text
https://en.wikipedia.org/wiki/Euclidean_distance
https://www.mathsisfun.com/data/least-squares-regression.html
Linear regression alg
Text
Short Demo: https://www.codingame.com/playgrounds/3771/machine-learning-with-java---part-1-linear-regression
Working with ML
Text
Hint 2: In ML we usually try to minimize a loss function.
https://algs4.cs.princeton.edu/code/edu/princeton/cs/algs4/LinearRegression.java.html
Clustering
Text
Clustering is the task of grouping a set of objects in such a way that objects in the same group (called a cluster) are more similar (in some sense) to each other than to those in other groups (clusters)
The notion of a "cluster" cannot be precisely defined, which is one of the reasons why there are so many clustering algorithms

Clustering
Text
Homework :)
https://en.wikipedia.org/wiki/Cluster_analysis
https://en.wikipedia.org/wiki/K-means_clustering
https://en.wikipedia.org/wiki/DBSCAN
Other terminology in ML
Text
f(x) = a+b*x1 + c*x2
Features: x1, x2; need to be linear independent between each other; y needs to be linear dependent on them
Weights: a, b, c
Overfitting: learning too well a specific data set and failing to generalize
Train set = data set on which we train the model
Cross validation set = data set on which we test different algs/params
Test set = the final data set on which we evaluate the choosen alg
Working in ML
Text
Hint 3: ML is not about using a specific algorithm. It is more about modeling the problem as a the right type of ML problem e.g. for the exact same problem we can use different ML techniques and for each ML technique we can use different algorithms.
Anomaly detection
Text
Anomaly detection (aka outlier analysis) is a use case of ML.
Is the problem of finding the data points that deviate from a dataset's normal behavior.
It can be modelled using several ML techniques:
- Regression: you build a prediction model and you compare the predicted value with the real one.
- Clustering: you cluster the data points based on density and data points remaining outside the clusters (outliers) are anomalies.
- Classification: you need 2 balanced (same size) data-sets (one with normal data points and another with anomalies data points) and you train a classification model to distinguish between them.
- Statistically: you infer the probability distribution of the data set and any point with a low probability is an anomaly (example: use a normal distribution)
Case study
Text
Problem statement "Short term excessive risk":
- detect excessive betting risk/activity that Kambi takes in a short period of time
Case study
Text
Problem statement "Short term excessive risk":
- detect excessive betting risk/activity that Kambi takes in a short period of time.
Solution: apply an aggregation sliding time window. Check if the aggregated result is greater than a pre-defined threshold.

Case study
Text
Let's slightly change the problem statement :
- detect suspicious betting risk/activity that Kambi takes in a short period of time.
Case study
Text

Current solution problems:
We may have false positive "suspicious" detection
Case study - sol 1 (simple data transformation)
Text
Why feature engineering is important:
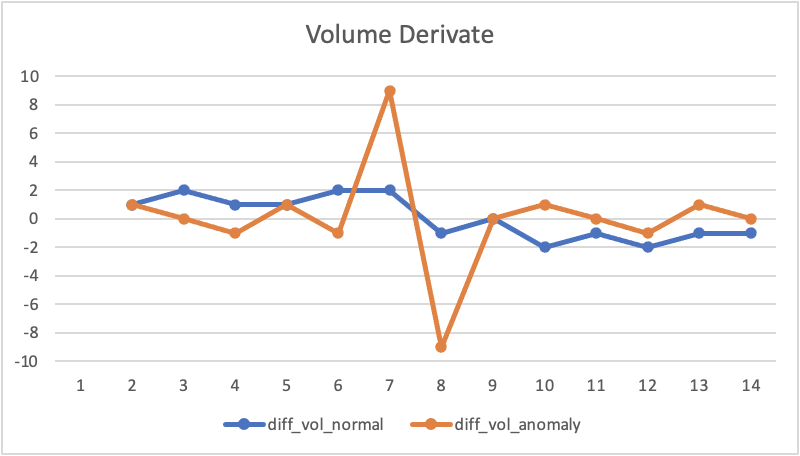
Volume derivate = Volume(t) - Volume(t-1)
Define a threshold for the derivative above which we have an anomaly.
Case study - sol 2 (linear regression on raw data points)
Text
- Divide the last hour into 6 equal time intervals: 0 - 10, 10-20...
- Aggregate the risk taken into each interval.
- Build a linear regression alg to predict the "aggregated risk" in the next time interval (next 10 minutes).
- Compare the predicted value with the real aggregated risk of the next 10 minutes.
- If the difference is too big then we have an anomaly.
So...we have an anomaly detection problem solved with linear regression!
Case study - sol 3 (linear regression on derivatives points)
Text
- Divide the last hour into 6 equal time intervals: 0 - 10, 10-20...
- Aggregate the risk taken into each interval.
- Calculate the derivative for each point (relatively to prev point).
- Build a linear regression alg to predict the "derivative risk" in the next time interval (next 10 minutes).
- Compare the predicted value with the real derivative risk of the next 10 minutes.
- If the difference is too big then we have an anomaly.
As opposed to the last version we will not have problems when the trend is changing (e.g. from ascending to descending)
Case study - sol 3 (linear regression on derivatives points)
Text


Case study - sol 4 (classification)
Text
Pre-requisites: for this solution we need historical data for both anomalies and normal cases, equally sized.
Offline (build model):
- Calculate the historical betting activity for a fixed time interval
- Label each data point as anomaly or normal
- Train a binary classification algorithm
Online (apply model):
- Take the current betting activity in that fixed time interval
- Predict its class using the trained model
Case study - sol 5 (statistically)
Text
Pre-requisites: for this solution we need historical data for normal cases.
Advantage vs sol 4: we don't need many historical anomaly cases.
Offline (build model):
- Infer from data the probability distribution (usually it is a Gaussian distribution) e.g calculate the mean and standard deviation.
Online (apply model):
- Take the current betting activity in that fixed time interval
- Apply the probability function to get the probability the current point to appear in the distribution
- If the probability is low => we have an anomaly
Summary
Text
- ML problem types: supervised, unsupervised, reinforcement
- A specific optimisation alg (minimize a function) can be used to different classes of ML problems (e.g: gradient descend is used for both linear regression and classification)
- Data transformation and feature engineering is very important
- We can model a problem with different ML techniques...The art is to do this right :) not just writing/choosing an algorithm
Intro to Machine Learning
By Bogdan Posa


