Future of the planet Earth:
Climate & Energy

Outline
- Present the Problem
- Disasters --> Climate Change --> Emissions
- Sustainable Development Goals & European Environmental Agency
- Modeling the Future
- Media - Scale - Imagery
- Suggested Solutions - what YOU (visitors) can do
- ideas for exhibits
Present the Problem
- Disasters --> Climate Change --> Emissions
Disasters
Climate Change
Emissions
Positive Feedback
Disaster Cycle


DATA PREPAREDNESS
AS
DISASTER PREPAREDNESS


Disaster and Land Use


Maps can help reduce complexity

Vanacker (2016) Impact of deforestation on slope stability
Geographic Information Systems (GIS)

Epistemology
Positionality
Reflexivity
and their influence
on how we process data and create visualizations
Remote Sensing
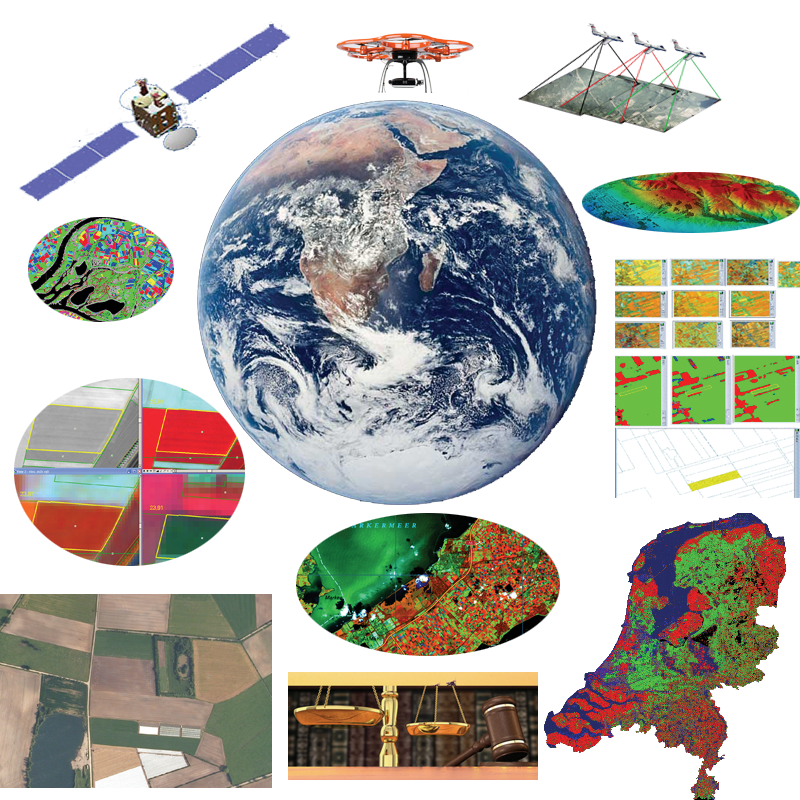
True Color

Animation
Animation
Slider
Sentinel-1 images track the major flooding in Kerala during the 2018 monsoon season
Slider
Land use change:
Malakal refugee camp in South Sudan
Digital Globe
Everything is spatial
Where it happened is critical to know to figure out why and how it happened
Dashboards = Power
Sustainable Development Goals &
European Environmental Agency
Current Government Initiatives
SDG linked to Paris Agreement
NL Ministry of Economic Affairs and Climate Policy
https://www.government.nl/ministries/ministry-of-economic-affairs-and-climate-policy/strategy
The Ministry of Economic Affairs and Climate Policy promotes:
- A competitive business climate. By abolishing unnecessary regulation and creating business-friendly fiscal policy.
- Specific policy for innovation and enterprise to support businesses in areas where it is really necessary. This makes the Ministry of Economic Affairs and Climate Policy the central access point for government information and services in the area of innovation, export and financing. Additional attention is paid to creating favourable conditions for key areas like chemicals, water and energy.
- A world-class agri-food sector, that can be further strengthened through investment in innovation and sustainability.
- Support for Dutch business abroad. Through economic diplomacy, for example, and assistance from embassies and consulates.
- Clean, reliable energy. Clean energy is not only essential, it is also a prime export product.
- Business practices that take nature and animal welfare into account. This creates a balance between economy and ecology.
International Efforts


Open Data
European Environmental Agency data and links
https://ourworldindata.org/grapher/total-oda-for-water-supply-and-sanitation-by-recipient
Barriers to working with open data
https://ourworldindata.org/grapher/proportion-using-safely-managed-drinking-water
Big Data and
CyberGIS
Cloud Computing


-
valuable for information dissemination
-
faster and more data processing that was not previously possible
-
data access
Google Earth Engine
-
Cloud-based platform for geospatial analysis
-
Access over 40 years of satellite imagery
-
Upload own data sets to integrate with publicly available data
-
Apply range of common algorithms to data
-
Export images, tables, charts, map outputs


Hansen et al (2013)
High-Resolution Global Maps of 21st-Century Forest Cover Change, Science
15 Nov. Vol. 342, Issue 6160, pp. 850-853 DOI: 10.1126/science.1244693.

McSweeney (2017) Cocaine trafficking is destroying Central Americ's forests
Title Text
// Load Sentinel-2 TOA reflectance data.
var dataset = ee.ImageCollection('COPERNICUS/S2')
                  .filterDate('2018-01-01', '2018-12-30')
                  // Pre-filter to get less cloudy granules.
                  .filter(ee.Filter.lt('CLOUDY_PIXEL_PERCENTAGE', 20))


//true color
var rgbVis = {
  min: 0.0,
  max: 2500,
  bands: ['B4', 'B3', 'B2'],
};
//urban visualization
var urbanVis = {
  min: 0.0,
  max: 2500,
  bands: ['B12', 'B11', 'B4'],
};

//Agriculture visualization
var agVis = {
  min: 0.0,
  max: 2500,
  bands: ['B11', 'B8', 'B2'],
};
//Healthy vegitation visualization
var VegVis = {
  min: 0.0,
  max: 2500,
  bands: ['B8', 'B11', 'B2'],
};

//Land Water visualization
var WaterVis = {
  min: 0.0,
  max: 2500,
  bands: ['B8', 'B11', 'B4'],
};

//Utrecht
Map.setCenter(5.104480, 52.092876, 11);

//different layers
Map.addLayer(dataset.median(), rgbVis, 'RGB');
Map.addLayer(dataset.median(), urbanVis, 'Urban');
Map.addLayer(dataset.median(), agVis, 'Agriculture');
Map.addLayer(dataset.median(), VegVis, 'Vegitation');
Map.addLayer(dataset.median(), WaterVis, 'Water');

//END
Modeling the Future
Spatial Media
Imagery
Scale (Maps to VR)
Exhibit ideas
http://antle.iat.sfu.ca/research/youtopia/
But then project images of what outcomes might look like on the wall?
Suggested Solutions - what YOU can do
at home
reduce, reuse, recycle
your parents can make purchasing choices
policies that support renewable energy
Tell your friends!
Thank you!

Energy_SDG
By Britta Ricker
Energy_SDG
pitch deck


