


Brad Langhorst
New England Biolabs
June 30, 2017
Brad Langhorst - New England Biolabs
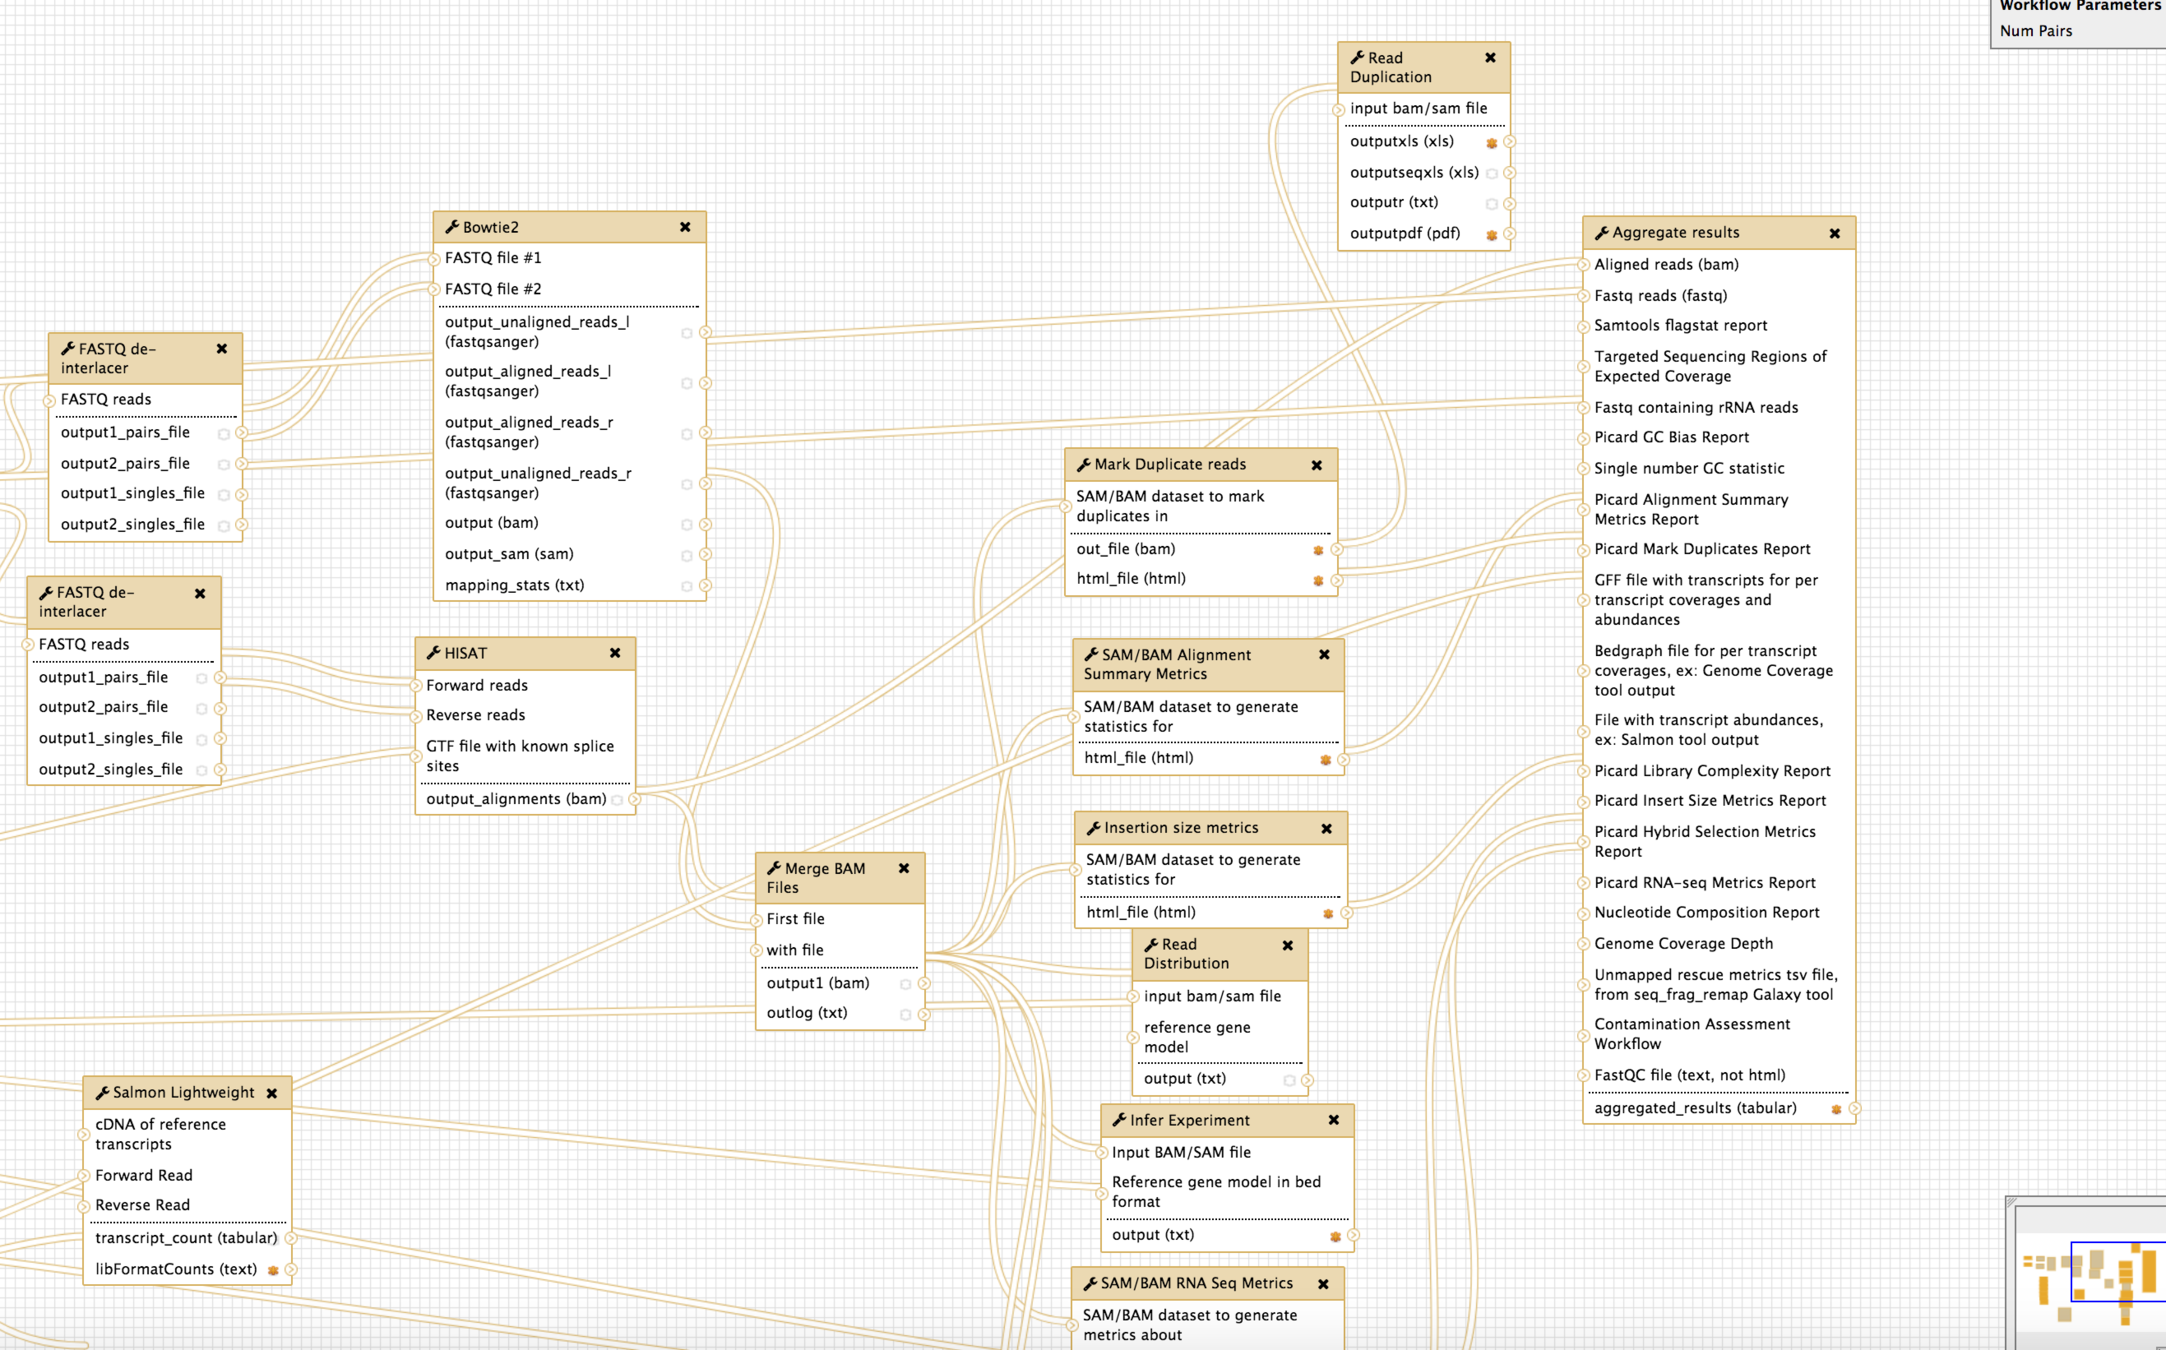
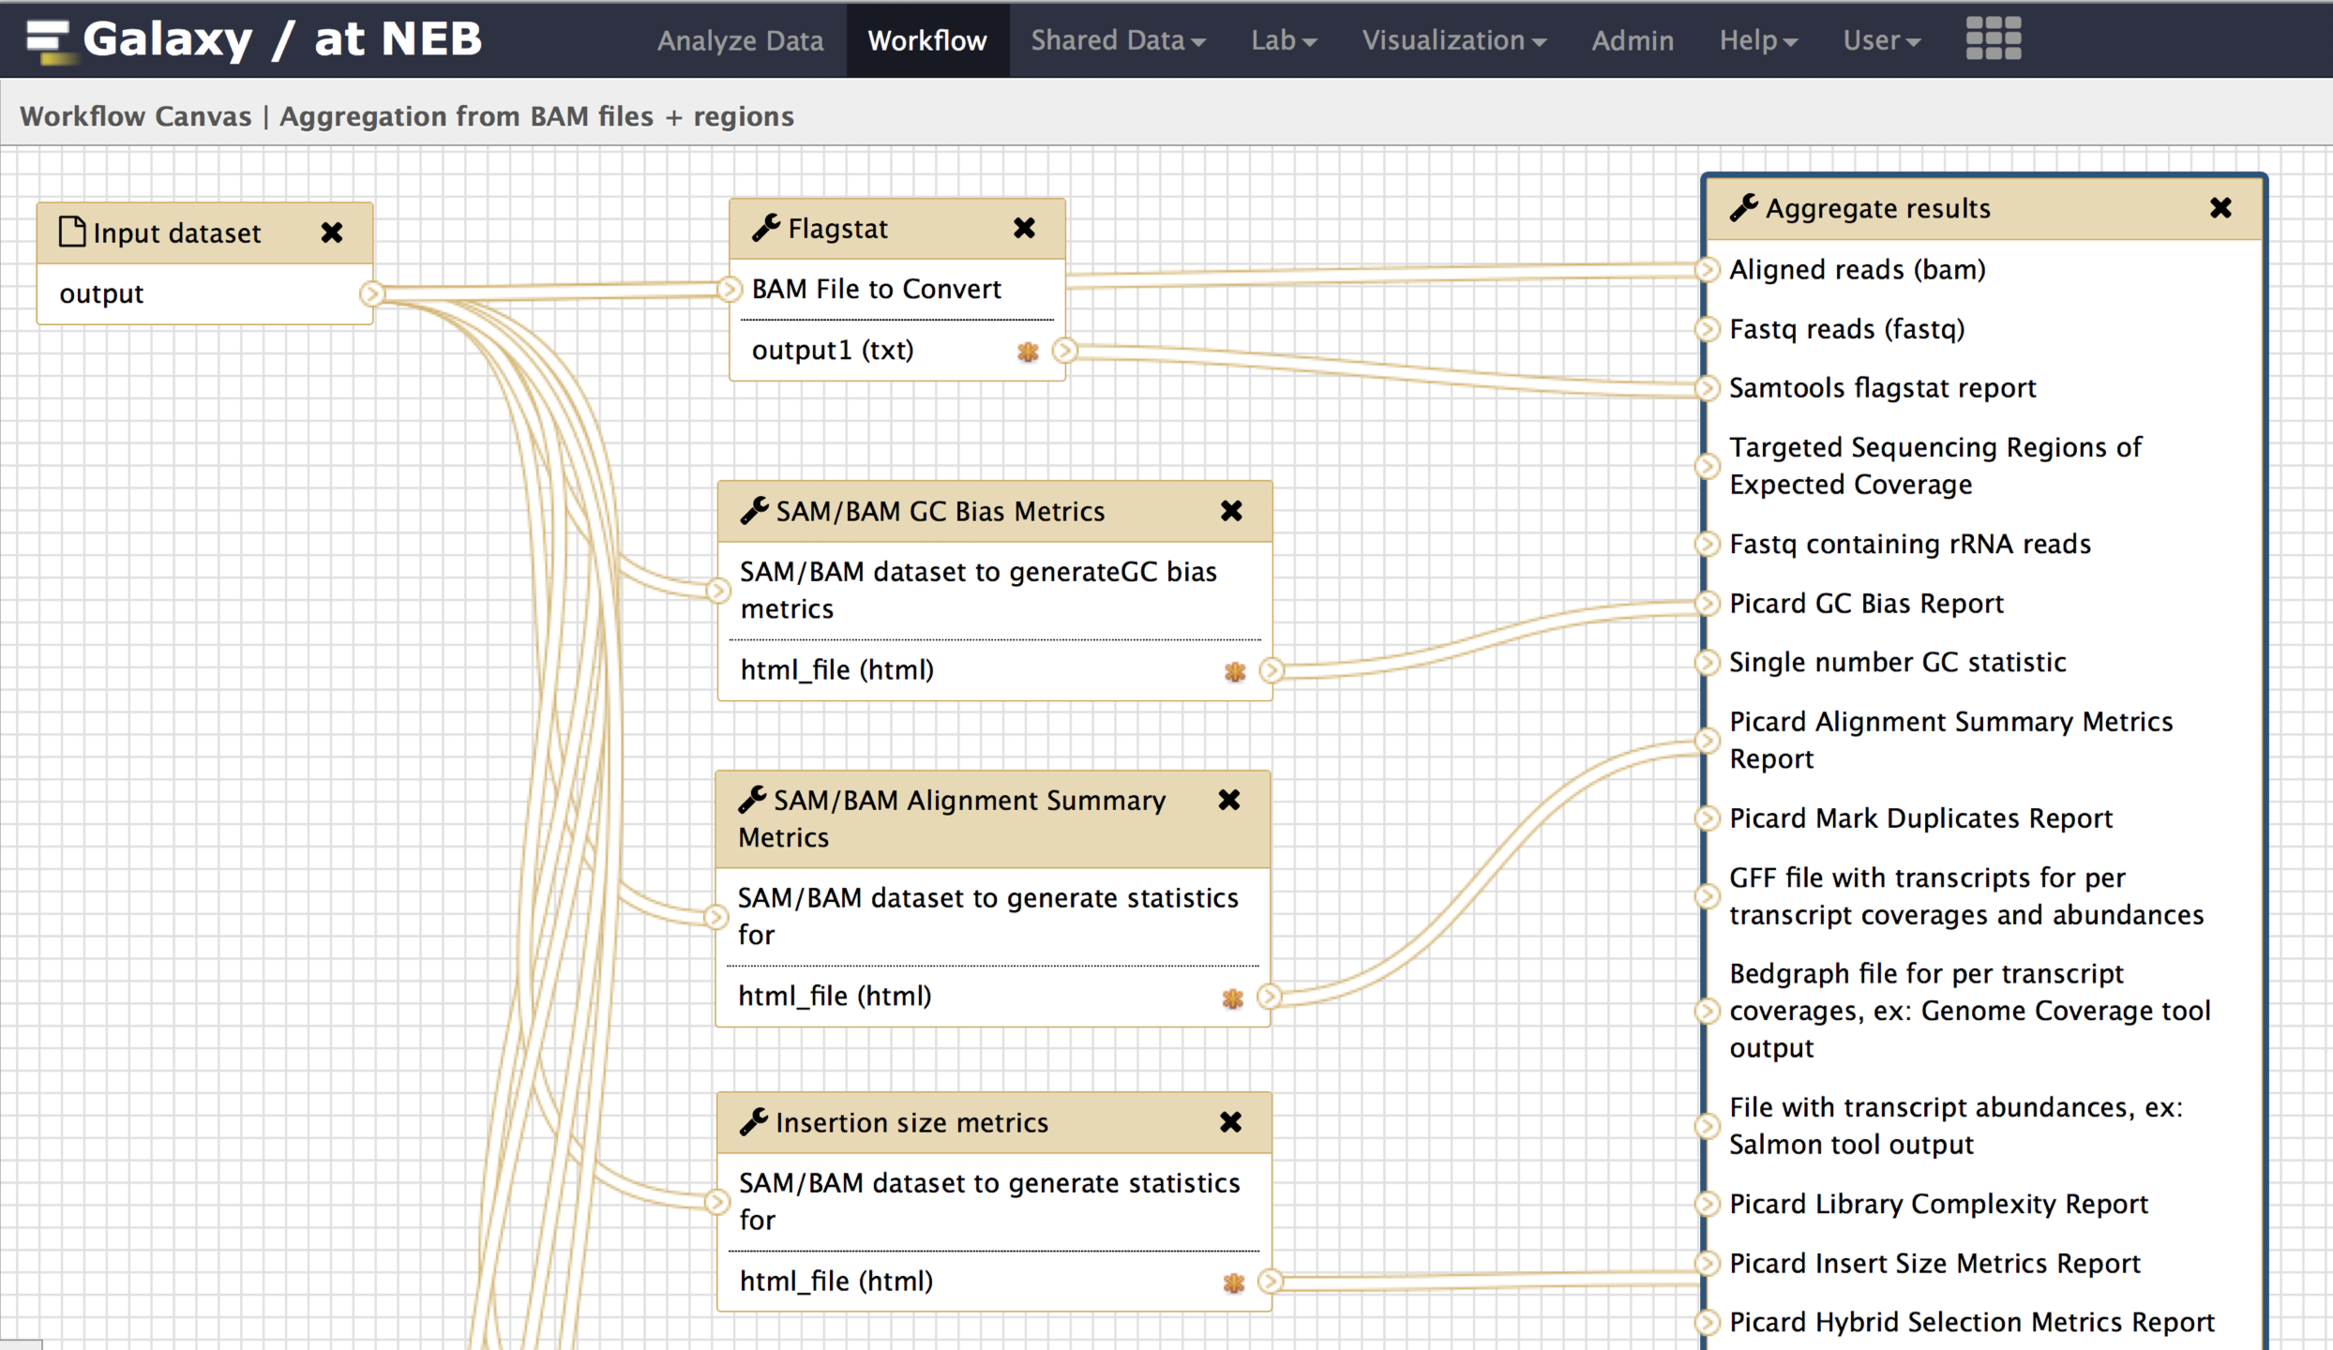
Analysis
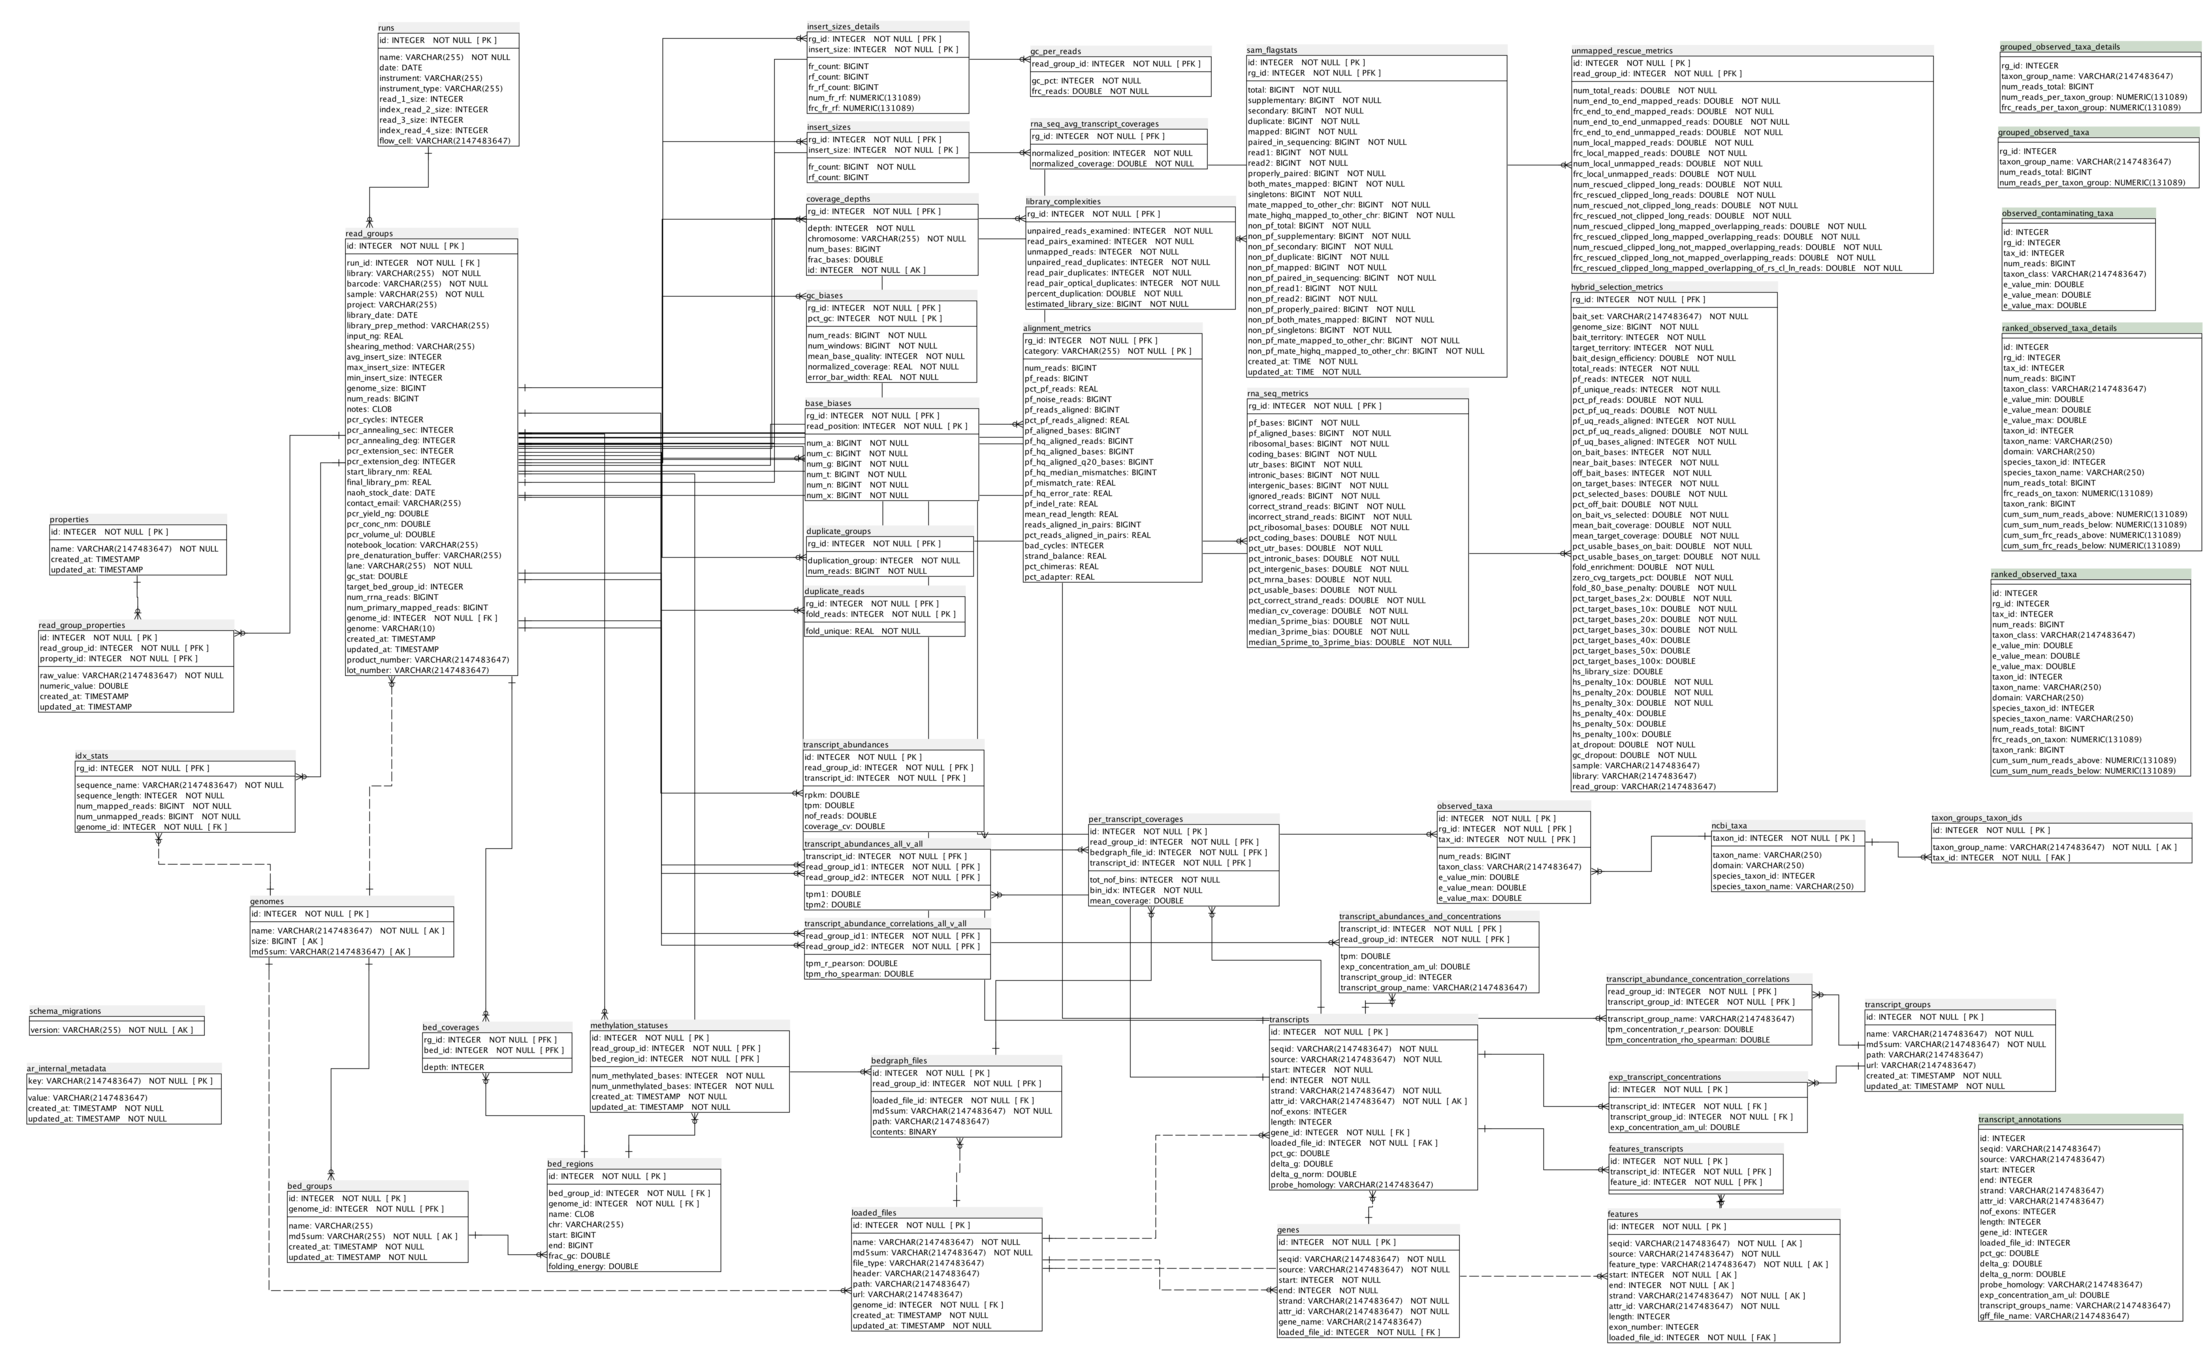
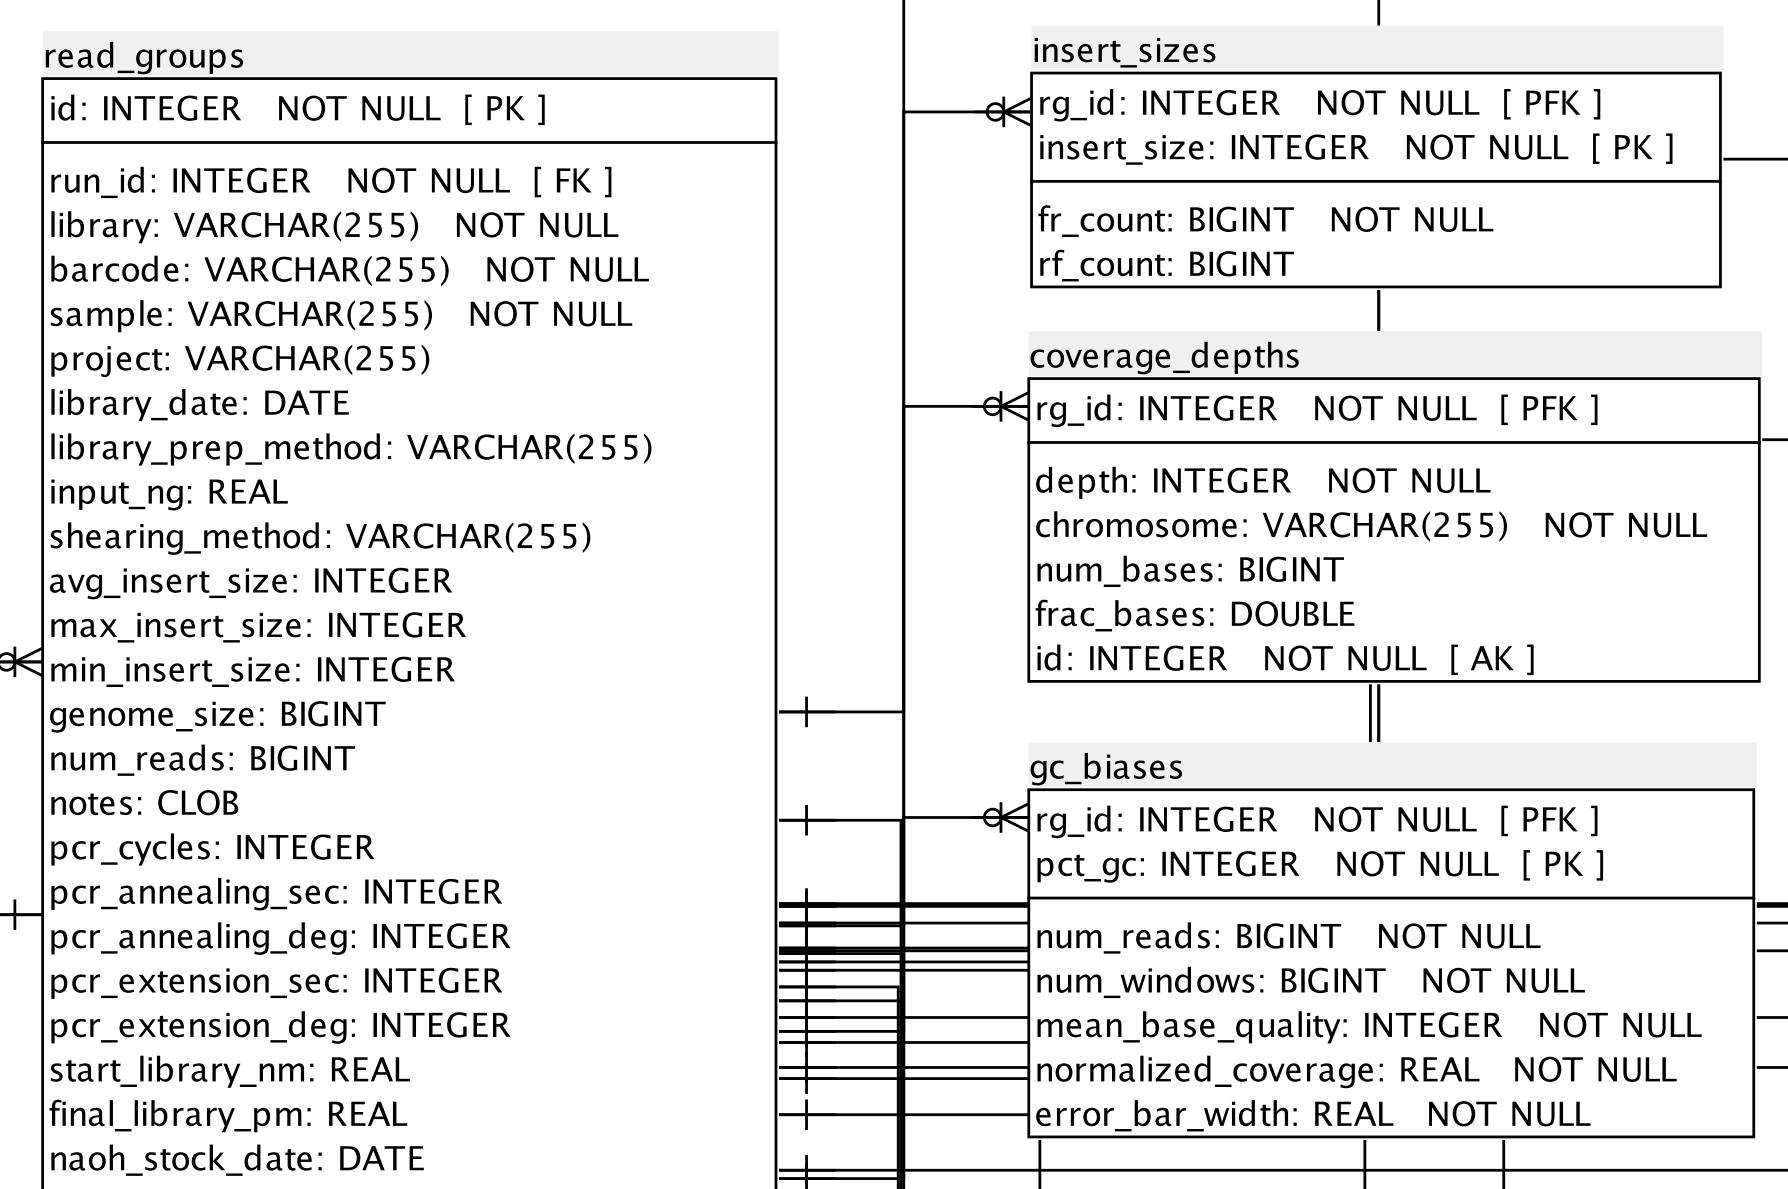
Database
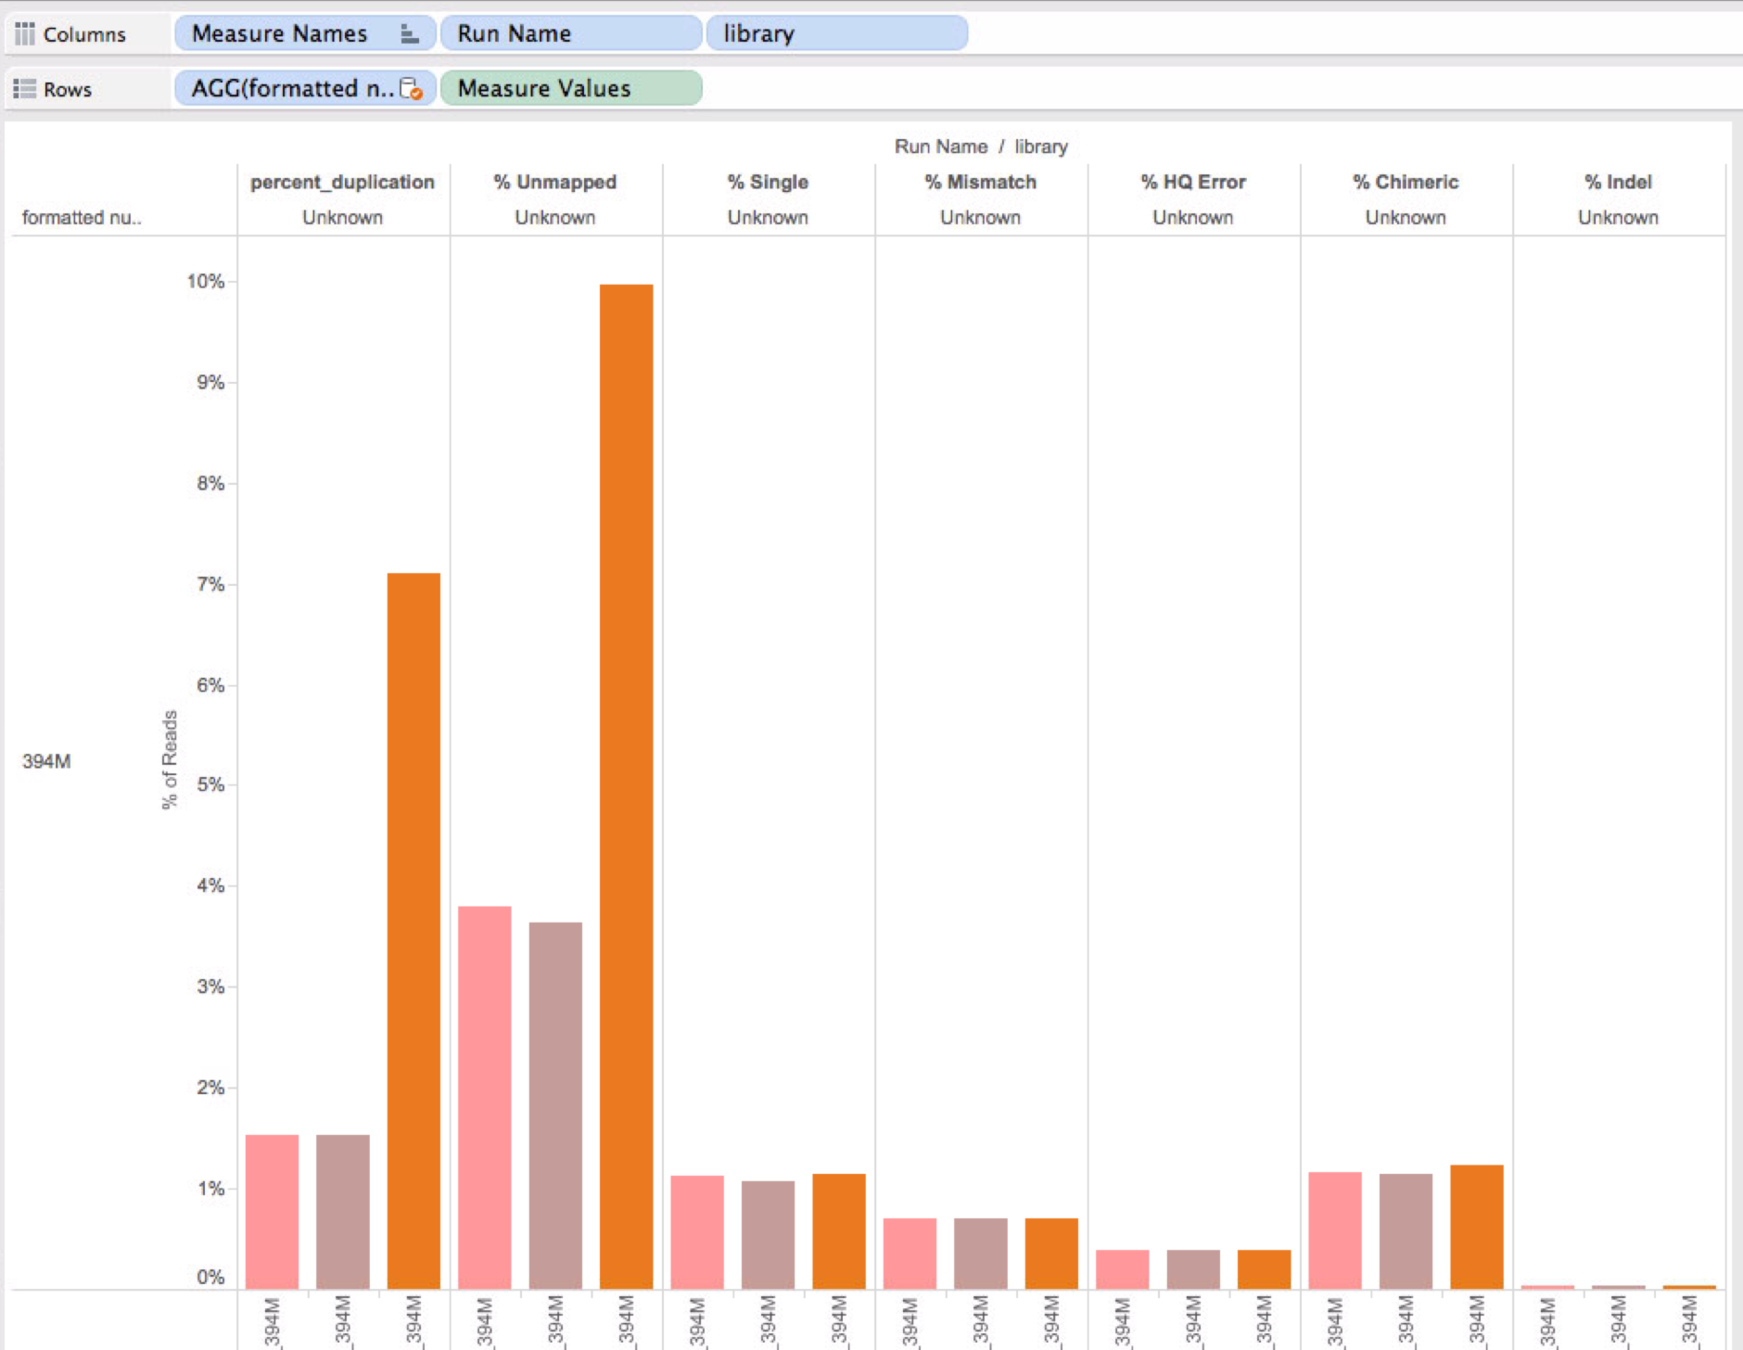
Visualization
Acquisition
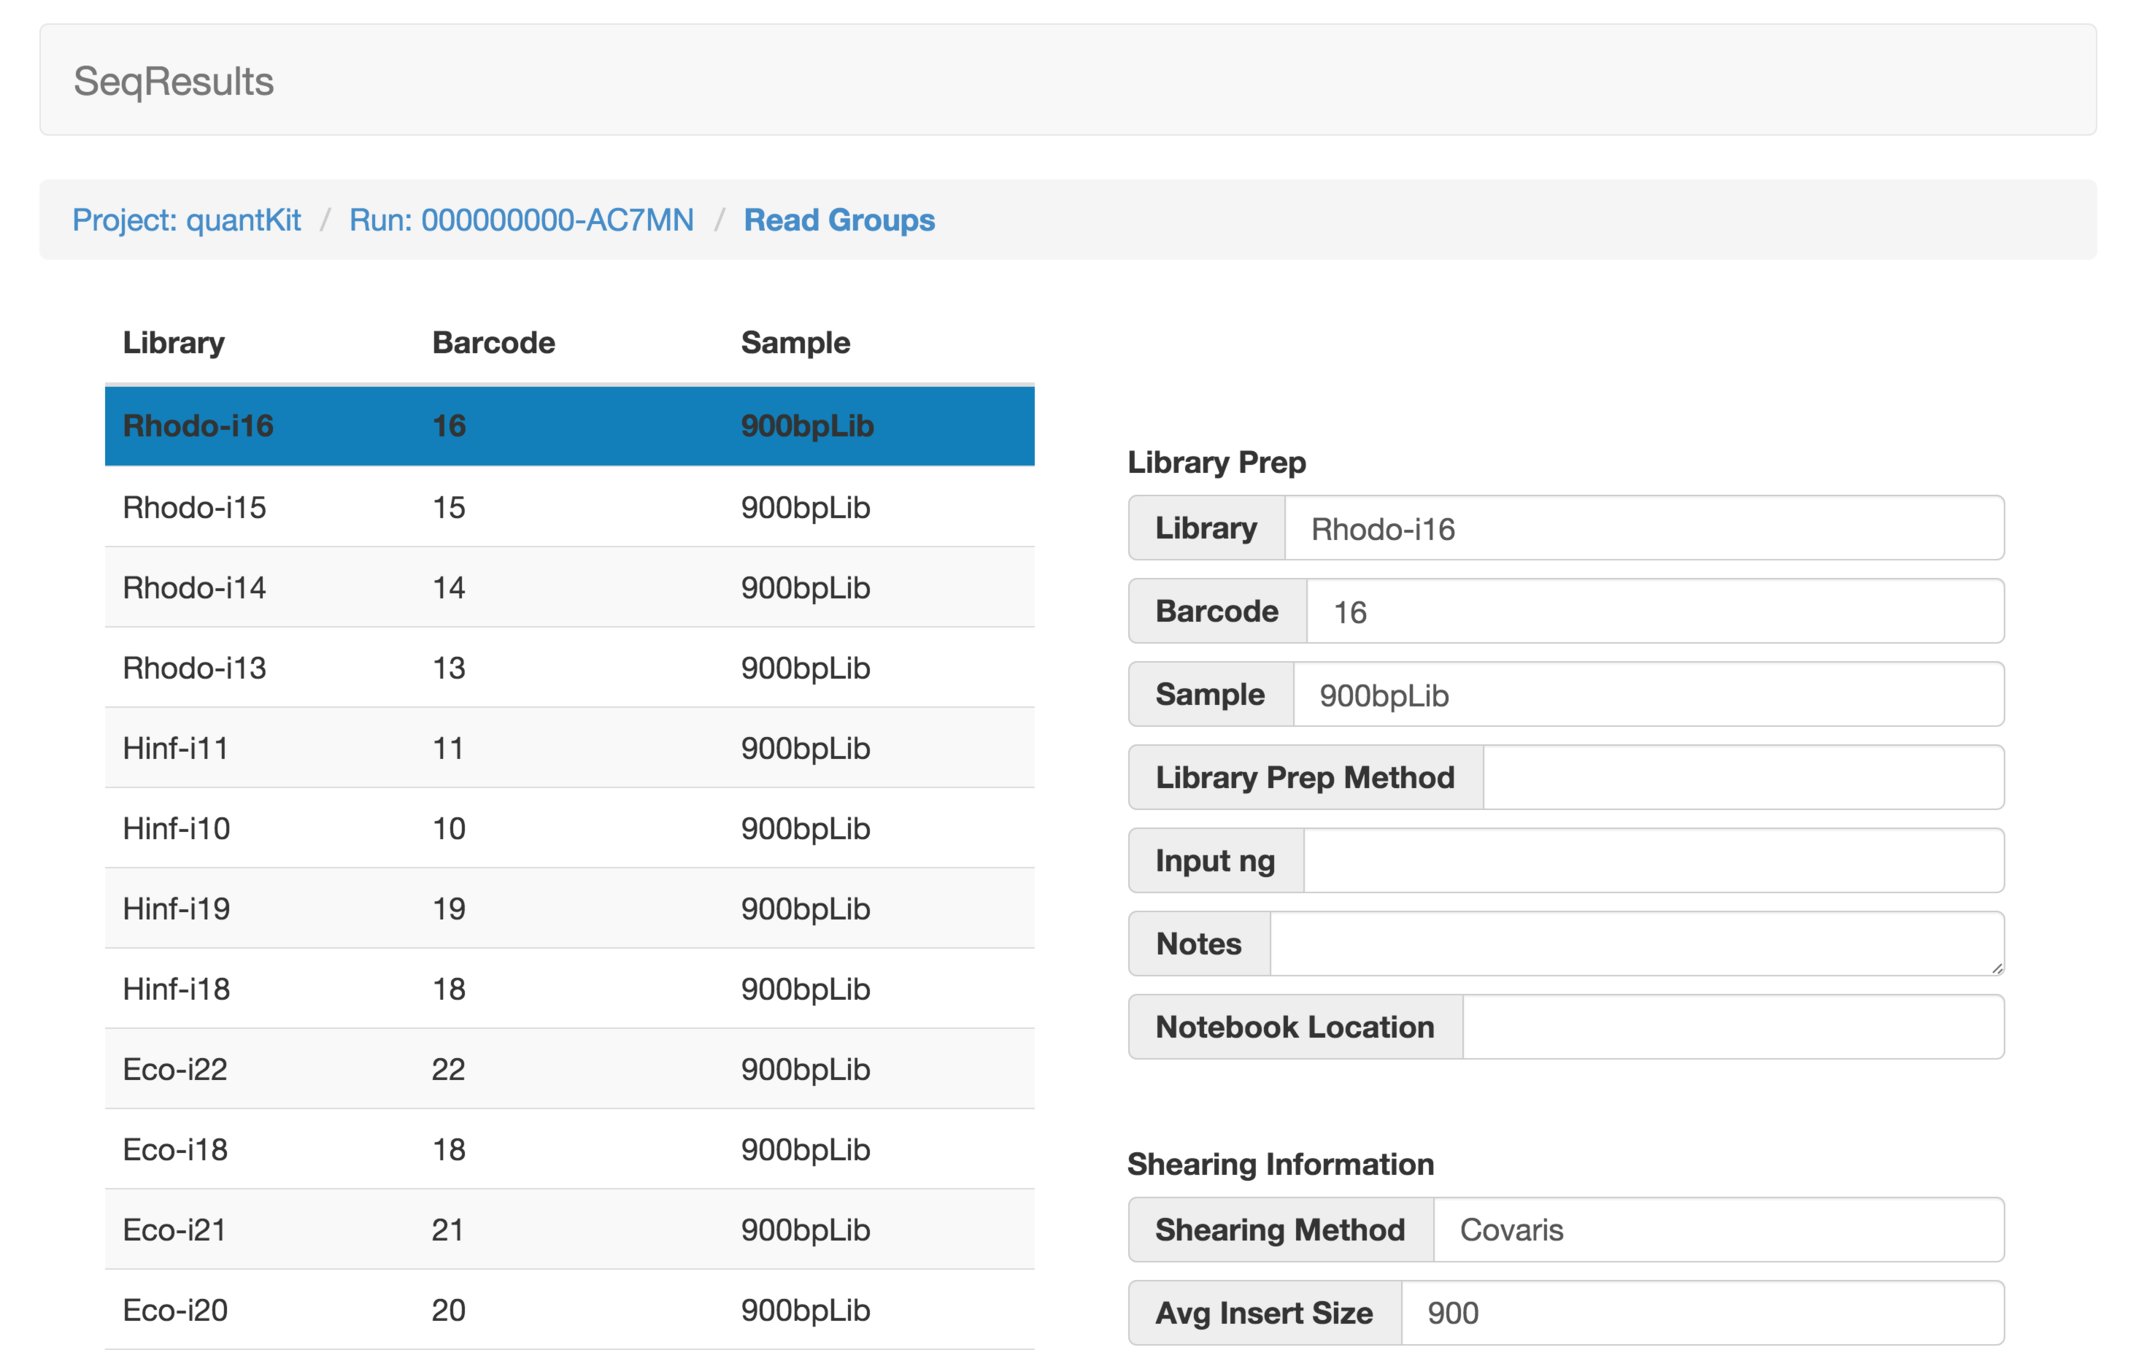
SeqShepherd
Timur, Mike Zulch
NGS Aggregate
Tableau
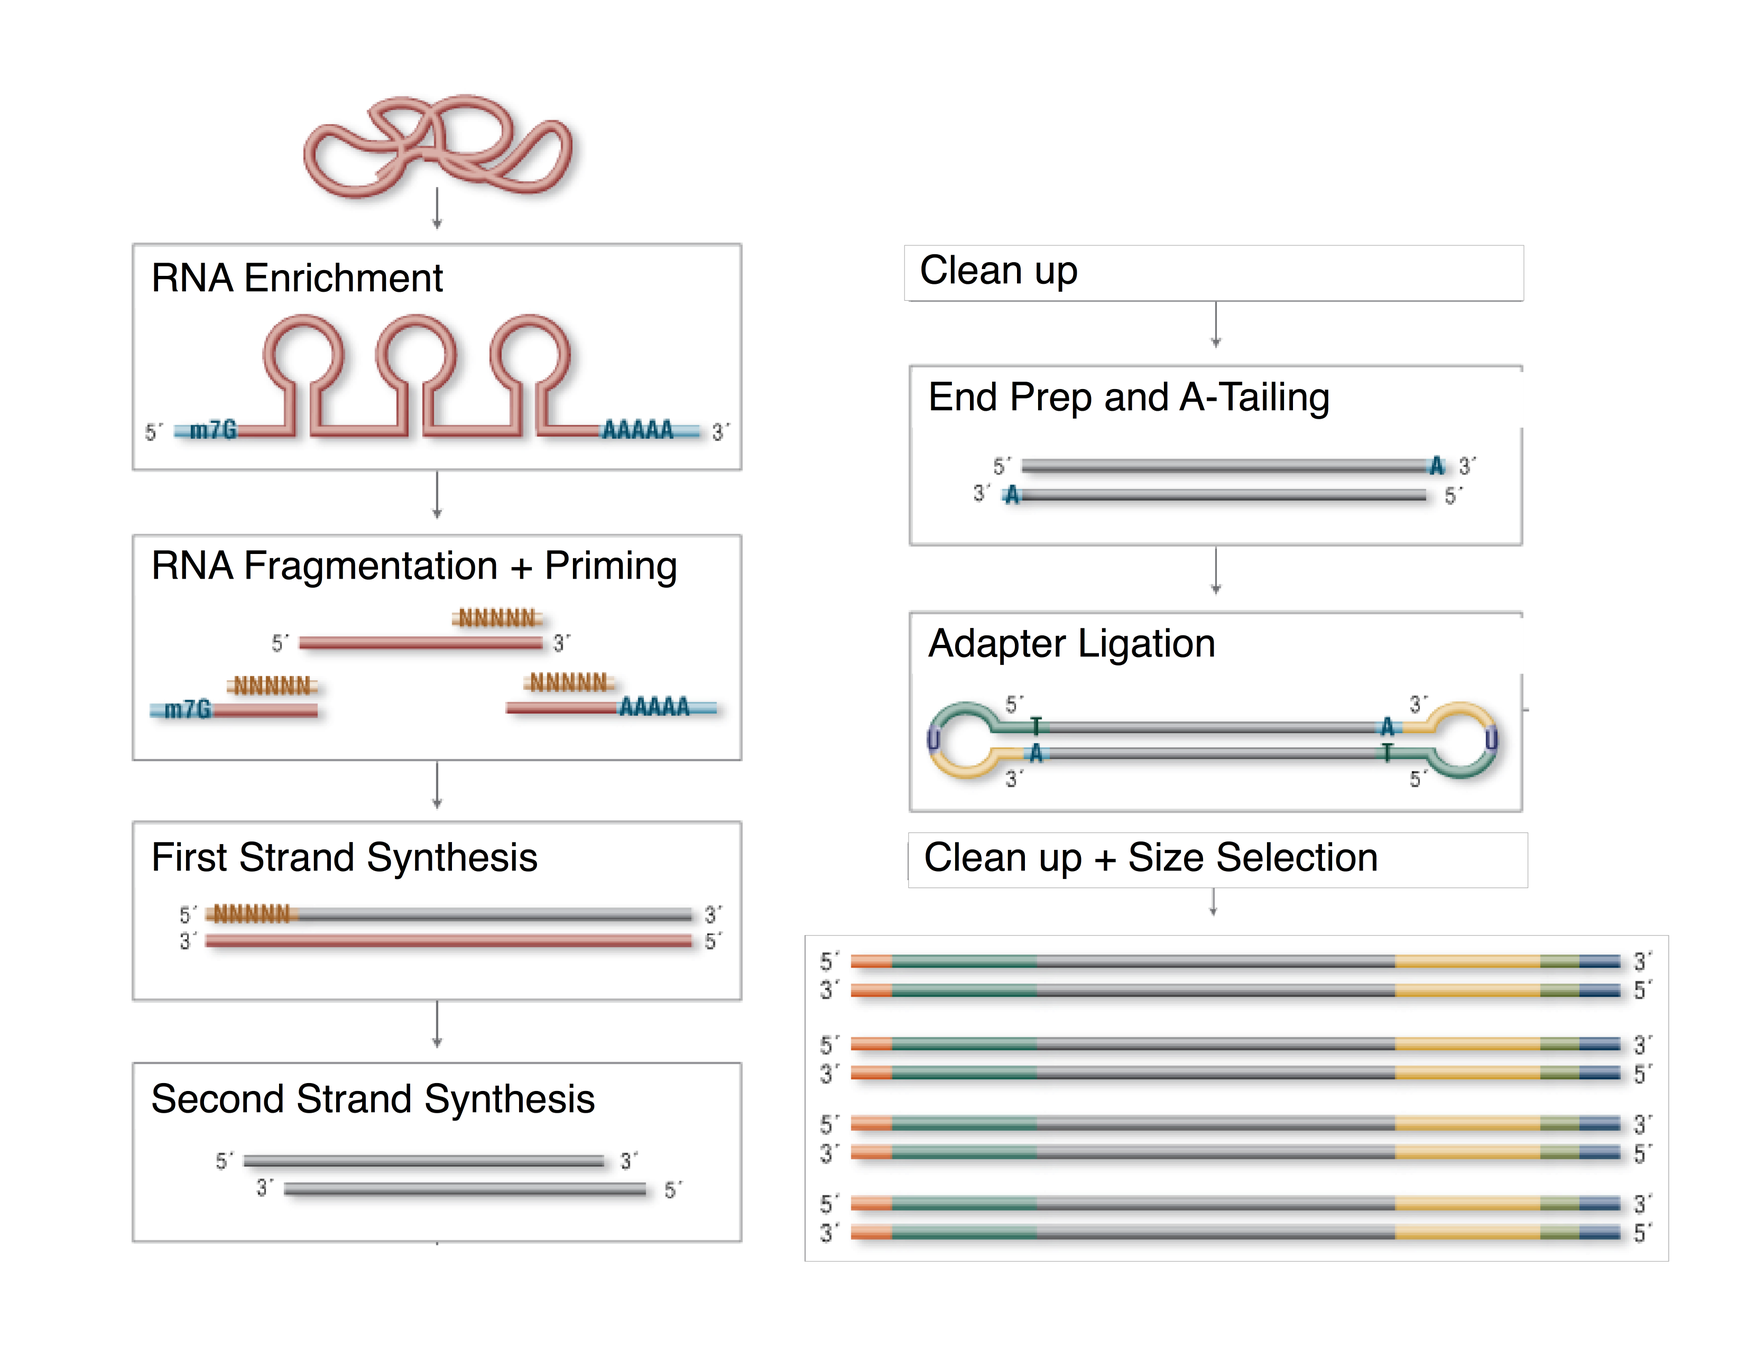
Library prep
Enzyme Steps
Kevin Sun
Timur Shtatland
Development is only part of where NEB uses Galaxy...
Lot to lot consistency
Goals:
Foster quantitative analysis by experiment designers to help make NEB products excellent
Identify opportunities for collaboration
New ideas for analysis?
Galaxy Team
IUC and other tool builders
By Brad Langhorst


