GIS PROJECT
Data Analysis Tool
by
Akshara Chukkannagari
Ceren Altunal Podlech
Ochwada Linda Nakhulo
Roswitha Neumann


Title Text
Task
The selection and realization of web application options that can serve as an analysis tool for the data generated by the sensor equipment.
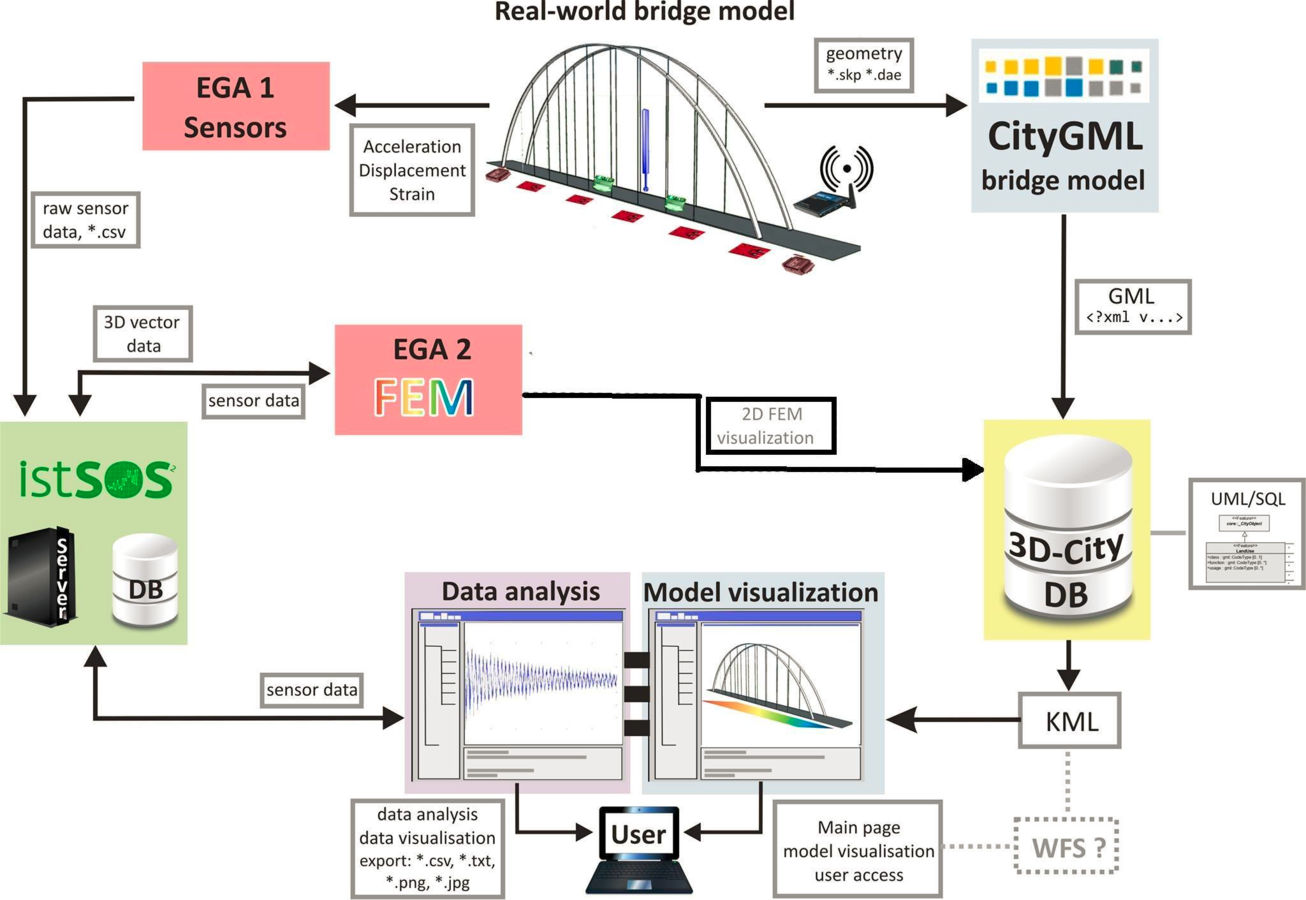
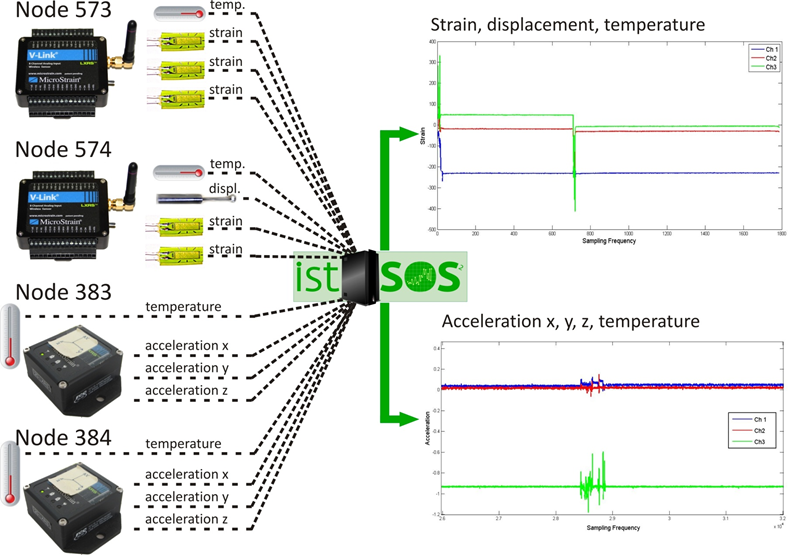
Sensor Inventory
Requirements User
- Intuitive user interface
- Visualization: sensor data, sensor type, data type node and channel.
- Data evaluation, processing, calibration and cleansing options.
- Browsing or search and export options for data mining.
Requirements Application
- Computational speed
- large amounts of data
- Numerical tools
- complex mathematical operations, libraries, inbuilt functions
- Adequate programming language
- Sophisticated visualization tools, libraries.
- Clarity of design and ease of use.
- Web-based accessibility options
- Free licensing & support options.
Data Processing Workflow
Questions to be answered:
- How to find relevant data?
- Is there a bias in my data?
- If bias is present, how can it be quantified?
- How can a bias be stripped off the data to reveal the true measurement values?
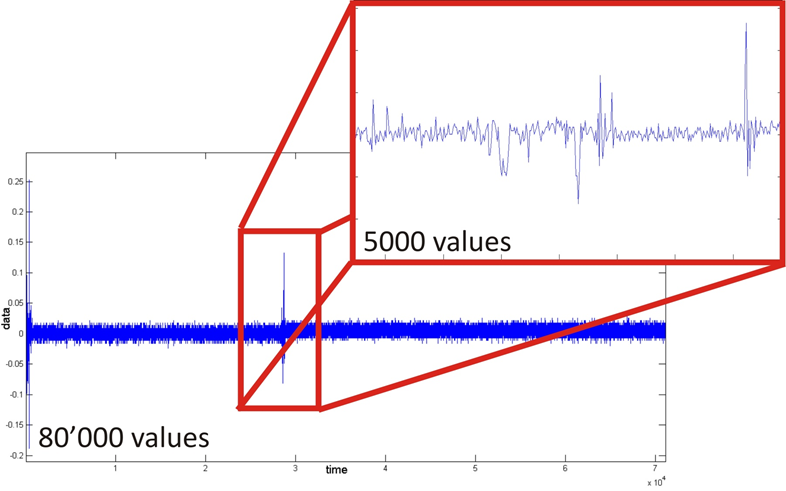
Event detection
Question: Where is my data?
Problem: Finding “events” of interest within large sets of recorded data
Solution: Event detection
Event detection
Event detection
Methods: Many!
Simple option: Manual setting of a threshold
Similarity measures
Question: Is there a bias in my data?
Problem: Recorded measurements don’t always reflect the true measurement value!
Disturbing effects:
- Long- or short-term temperature effects, seasonality
- Accumulative electric effects
- Influence of moisture
- Voltage leakage due to cabling
- Strong magnetic fields
- Sensor noise
Similarity measures
Solutions:
Stationarity testing:
Check if data is randomly distributed
Hypothesis testing:
Verification of stochastic processes with the help of statistic tests
Correlation coefficient r:
Measure of linear dependence between time and data column of a time series
Auto-Covariance & Autocorrelations:
Finds repeating patterns within a time series
E.g. day-night temperature changes
Cross-Correlation:
Tests for correlations between time series of e.g. different sensors
E.g. time delays between sensors recording the same event
E.g. temperature effects influencing all sensors, but maybe to a different extent
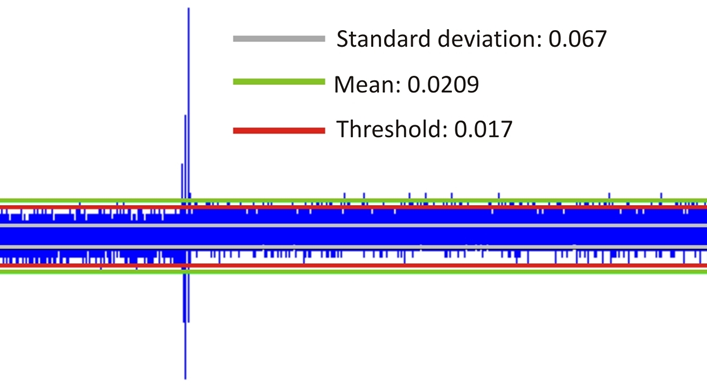
Similarity measures
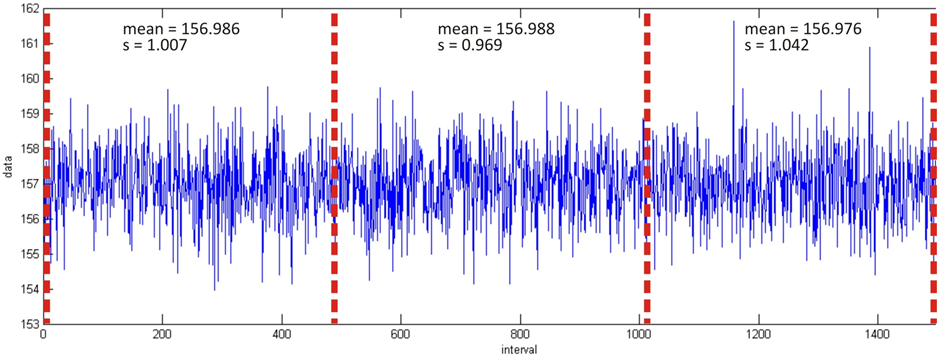
Example: Stationarity Testing
Sectioning the time series and testing for changes in mean, variance, standard deviation
Regressions & Filtering
Question: If a bias is present, how can it be treated?
Problem: Identification of disturbing effects in a time series
Solutions:
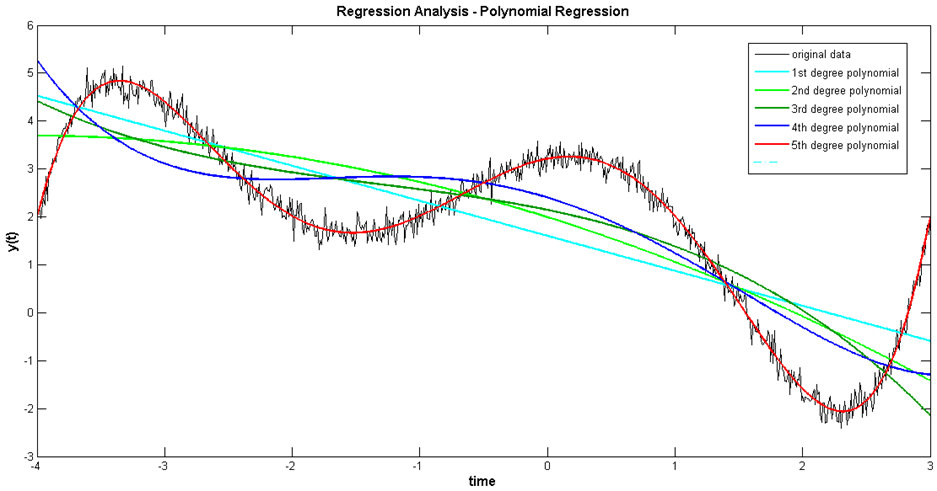
Regression analysis:
- Fitting of an adequate functional model to the data
- E.g. linear model for calibration tasks (zero-offset)
- E.g. Polynomials typically for electric effects
Filters:
- E.g. Moving Average for targeted identification of overlaying trends
- E.g. Smoothing Spline for noise removal
Regressions & Filtering
Regressions & Filtering
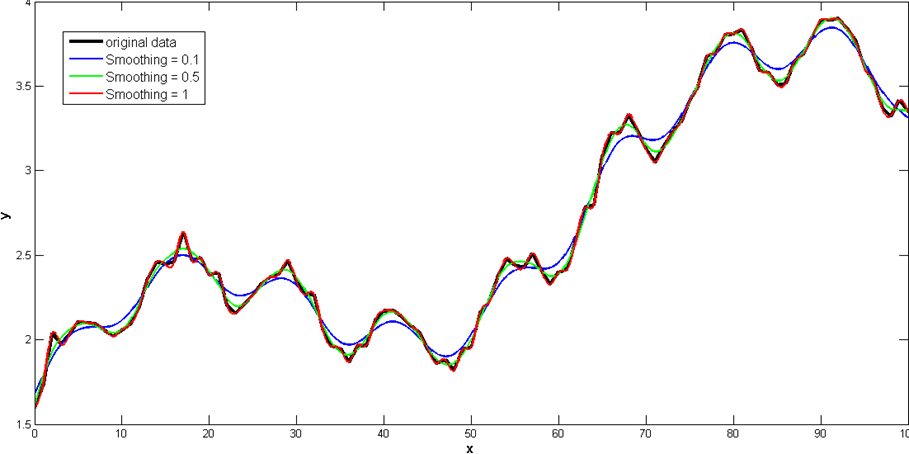
Example: Smoothing Spline
Segmented, local approximation, differing functional models for segment
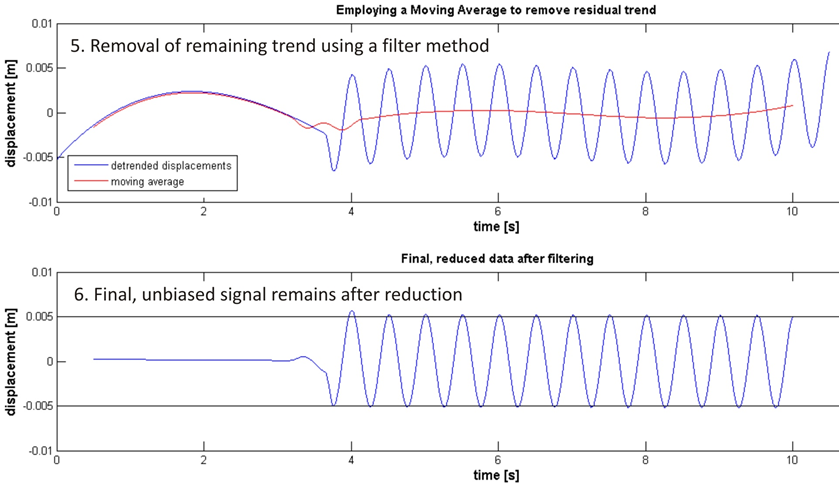
Decomposition
Question: If a bias was identified, how can it be removed from the measurement data?
Problem: Removal of identified unwanted trends and effects from the data to obtain the actual measurement.
Solution: Stepwise fitting of functional models or filters and consequent subtraction from the original data until stationarity is achieved.
Decomposition
Example: Processing workflow, accelerometer data
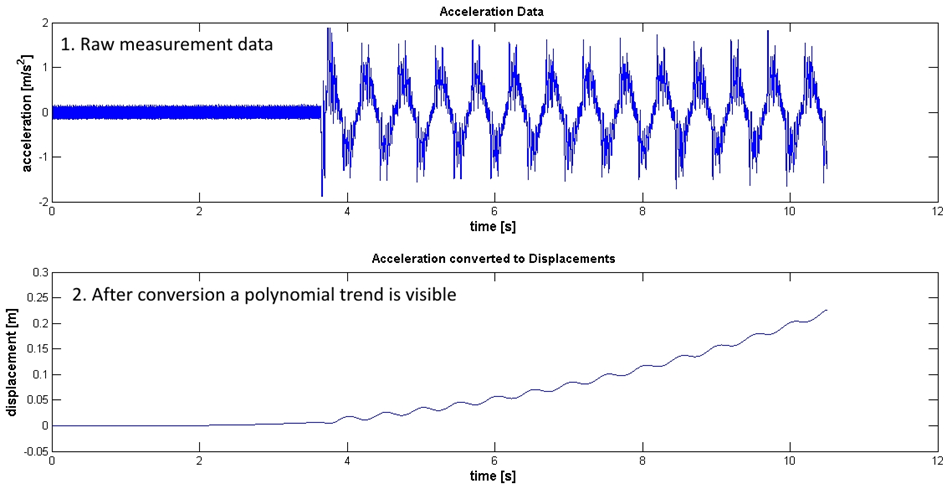
Decomposition
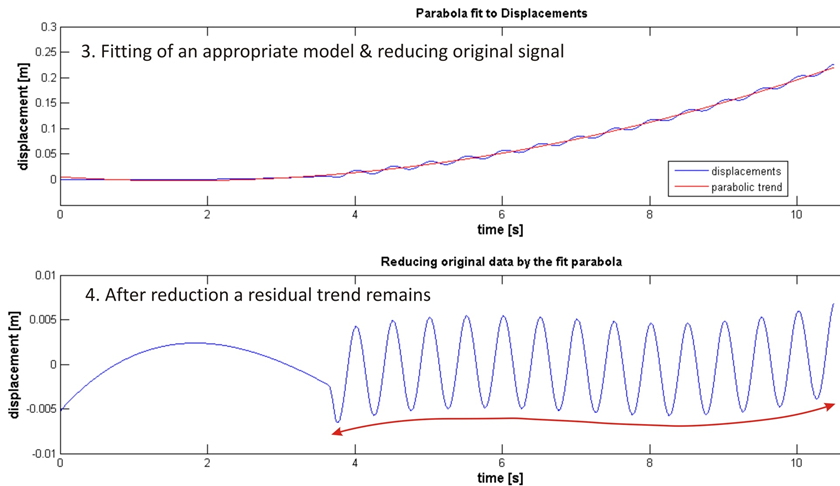
Example: Processing workflow, accelerometer data
Decomposition
Example: Processing workflow, accelerometer data
Javascript
Why javascript is choosen?
- Dynamic
- Easy to use RestAPI of IstSOS database
- Possibility to analyze data in client side
- Possiblitiy to reuse the code in server-side
- Variety of libraries & frameworks
Goal: A dynamic real-time web-based analysis tool to analyse sensor data
External Libraries & Frameworks
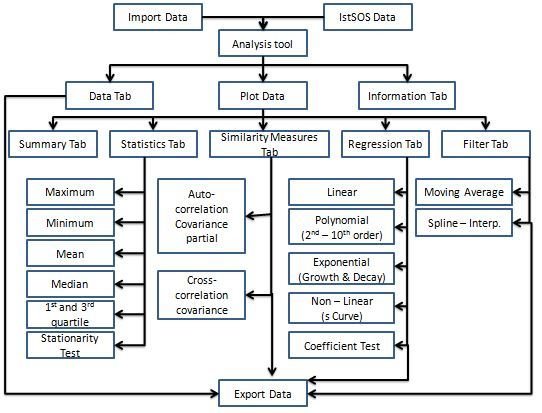
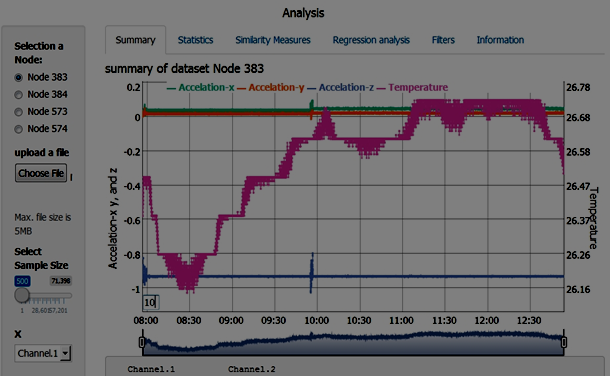
Analysis
Tool
JQuery
Bootstrap
Simple-statistics.js
Underscore.js
Numeric-1.2.6.js
Timeseries-analysis.js
Regression.js
IstSOS.js
Stationary Testing Process
Highstock.js
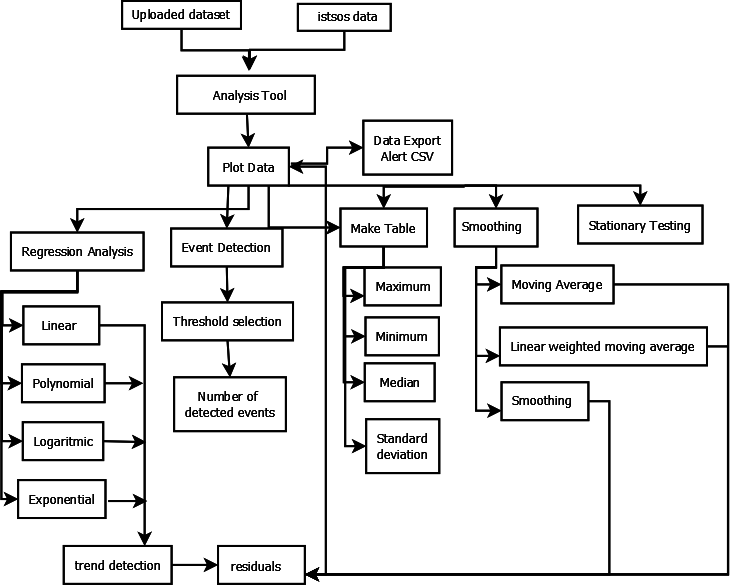
Software Overview
Challenges & Suggestions
Server-side scripting
Modern approaches for javascript
Browser limitations
More user interactivity
More functionality
Cross origin problem
Numerical functions in JS


R
Introduction to R &R studio
- statistical computing
- command line interface.
- freely available for UNIX platforms, Windows and MacOS.
- wide variety of statistical (linear and nonlinear modelling, classical statistical tests, time-series analysis, classification, clustering, …) and graphical techniques,
- Extensible via packages, available through the CRAN family
- RStudio is an IDE, available open source and commercial editions


Title Text
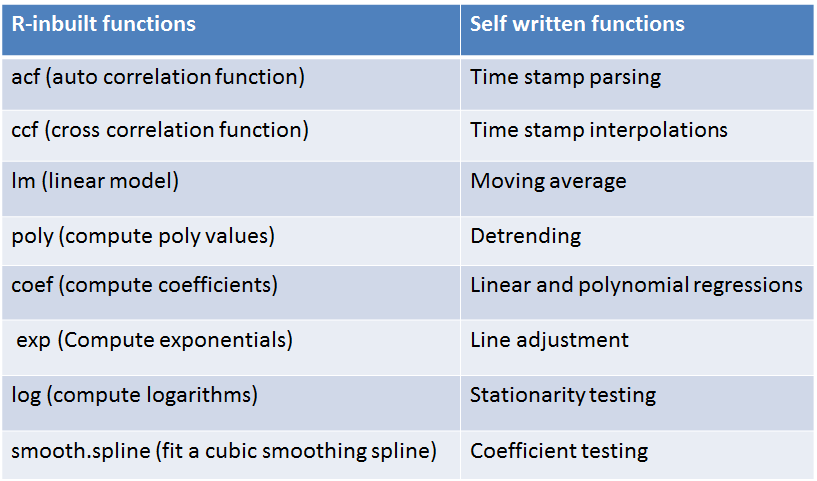
Used Functions
R shiny
- R shiny is a Web Application Framework for R, developed by R studio.
- Easy to convert the analysis into stylish, Interactive, web application.
- No need to have a good knowledge in HTML and CSS or JavaScript.
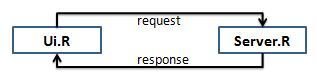
Ui.R: Creates user interface
- Controls the layout, appearance and widgets
- Display the output
Server.R : Set of instructions
- Process the request and produce the resultant output
- Respond to ui.r and display result
Title Text
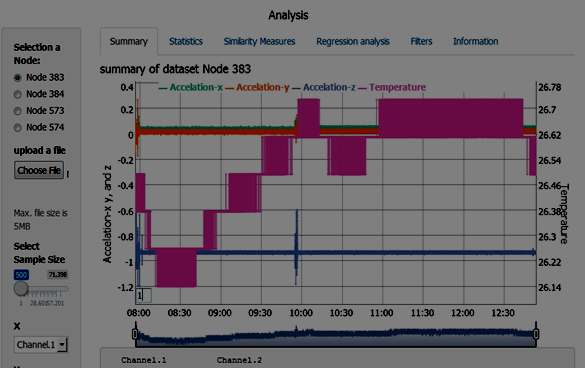
Software Overview
Shiny app demo
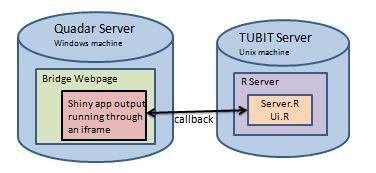
Shiny Server
- App available over web
- Multiple applications.
- Free and open source
- Supports only Linux OS
Embed into SHM website using iframe
code : <iframe src="http://hostname/app/" style=“ "></iframe>
Pros & Cons
Pros
- Easy to use
- Simplicity
- No special environment
- Easy to install
- Dynamic and interactive
Cons
- Less flexible
- Restricted server environment
- versioning
Problems & Suggestions
Problems faced
- Timestamp conversion
- Singularity issues in functions
- Downloading plots
Further improvement suggestions
- Deployment of app
- Kalman Filter
- Non-linear regression models
- Event detection
- Real time data analysis
- Flexible import/ export options
Dygraphs
Dygraphs - R interface from the JavaScript Charting Library for Time series Analysis
Main fuctions of Dygraphs:
- Auto plotting xts objects.
- Configure axis and series display including a second y axis.
- Interactive features can be included (zoom, pan, point highlighting e.t.c)
- Plots overlays.
Used Functions
- Cbind – combine sequence of data frame for plotting
- dyOption- Give more options to the graph
- dyseries –Manipulate a specific dataframe.
- dyRangeSelector- zooming options
- dyRoller- smoothing function
Smoothing function 1
Smoothing function 10
Setbacks
Dygraph is a new library in R , hence less documentation in it.
This results to unsolved errors
Conclusion
Javascript -Cons
- Lacking in mathematical convenience
- Community libraries not always reliable, few updates
R Shiny- Cons
- Lacking in building flexibility
- R-Version updates don't always accommodate library updates
- Con for both on large data sets
- Lack of Computational speed
- Success in implementing two analysis tool (Javascript and R- Shiny)
References
- Microstrain, L. (2015): LORD Microstrain Sensing Systems - Wireless Networks. Link: http://www.microstrain.com/wireless. Accessed: 2015-04-05
- Neitzel, F. & Weisbrich, S. (2014): Statistic test procedures and analysis of stochastic processes. Technical University of Berlin, Department of Engineering Geodesy and Adjustment Theory, Course Materials.
- Shumway, R. H. & Sto_er, D. S. (2015): Time series analysis and its applications: with R examples. Springer Science & Business Media. Link: http://www.stat.pitt.edu/sto_er/tsa3/tsa3EZ.pdf, Accessed: 2015-04-10
- Weisbrich, S. & Neitzel, F. (2014): Sample data for statistic test procedures. Technical University of Berlin, Department of Engineering Geodesy and Adjustment Theory, Course Material: Statistic Test Procedures.
- R webpage -> http://www.r-project.org/
- Beginners guide for R -> http://www.statmethods.net/index.html
- R- studio webpage -> http://www.rstudio.com/
- Shiny webpage-> http://shiny.rstudio.com/
- Complete tutorial to develop and Deploy shiny app over web -> http://rstudio.github.io/shiny/tutorial/
Gis project
By ceren altunal