


Cheuk Ting Ho
Developer advocate / Data Scientist - support open-source and building the community.
Grab the slides: slides.com/cheukting_ho/legend-data-viz1
Every Monday 5pm UK time
by Cheuk Ting Ho
Because of the way the human brain processes information, using charts or graphs to visualize large amounts of complex data is easier than poring over spreadsheets or reports
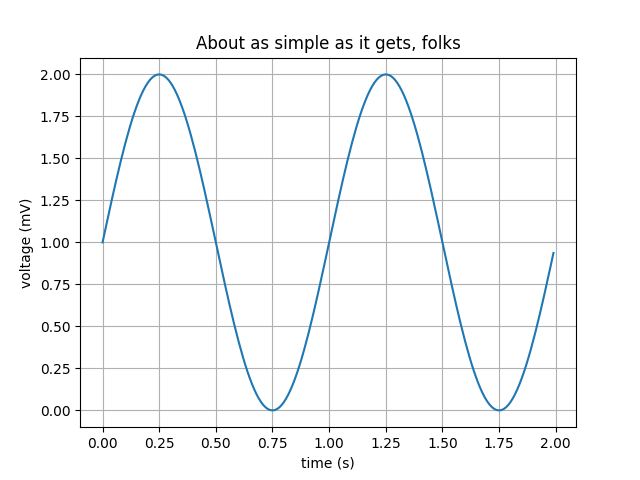
Line plot
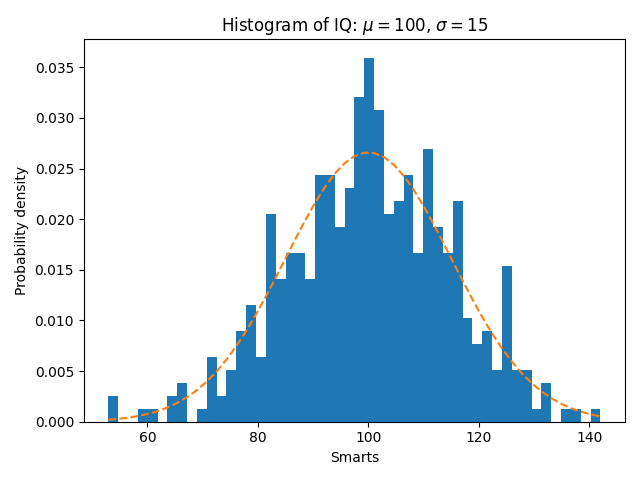
Histogram
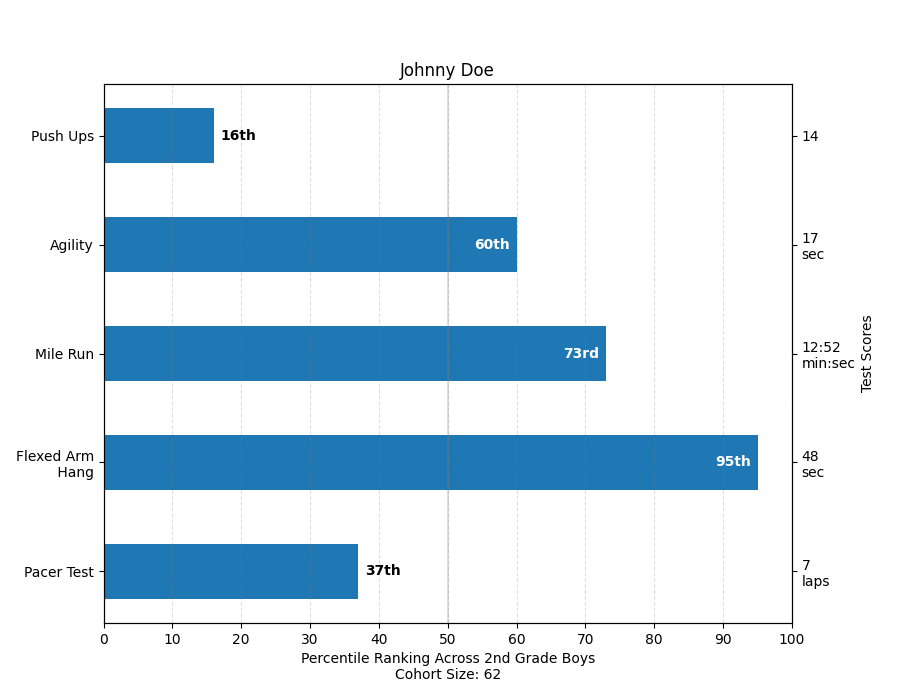
Bar chart
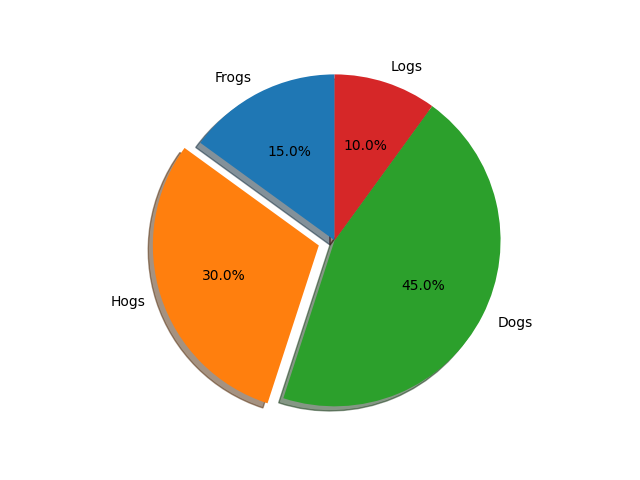
Pie chart
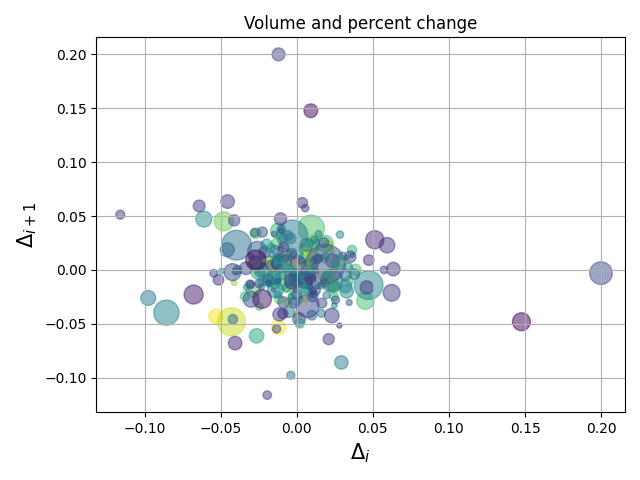
Scatter plot
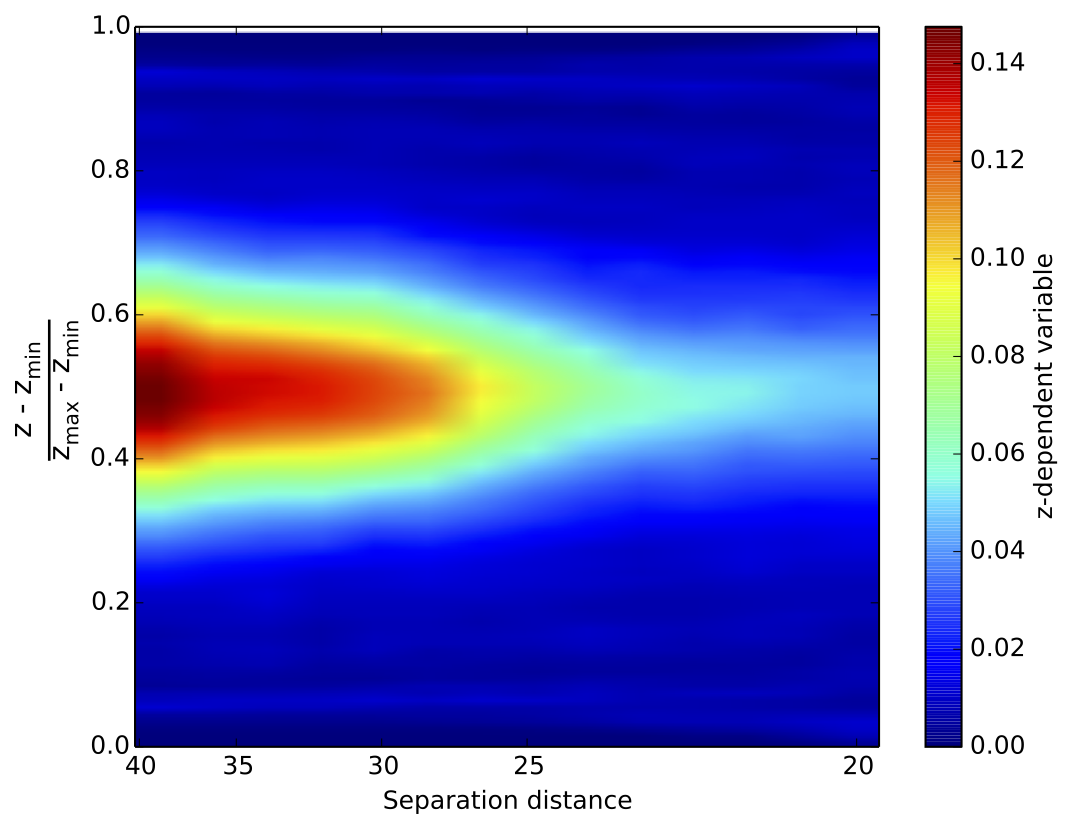
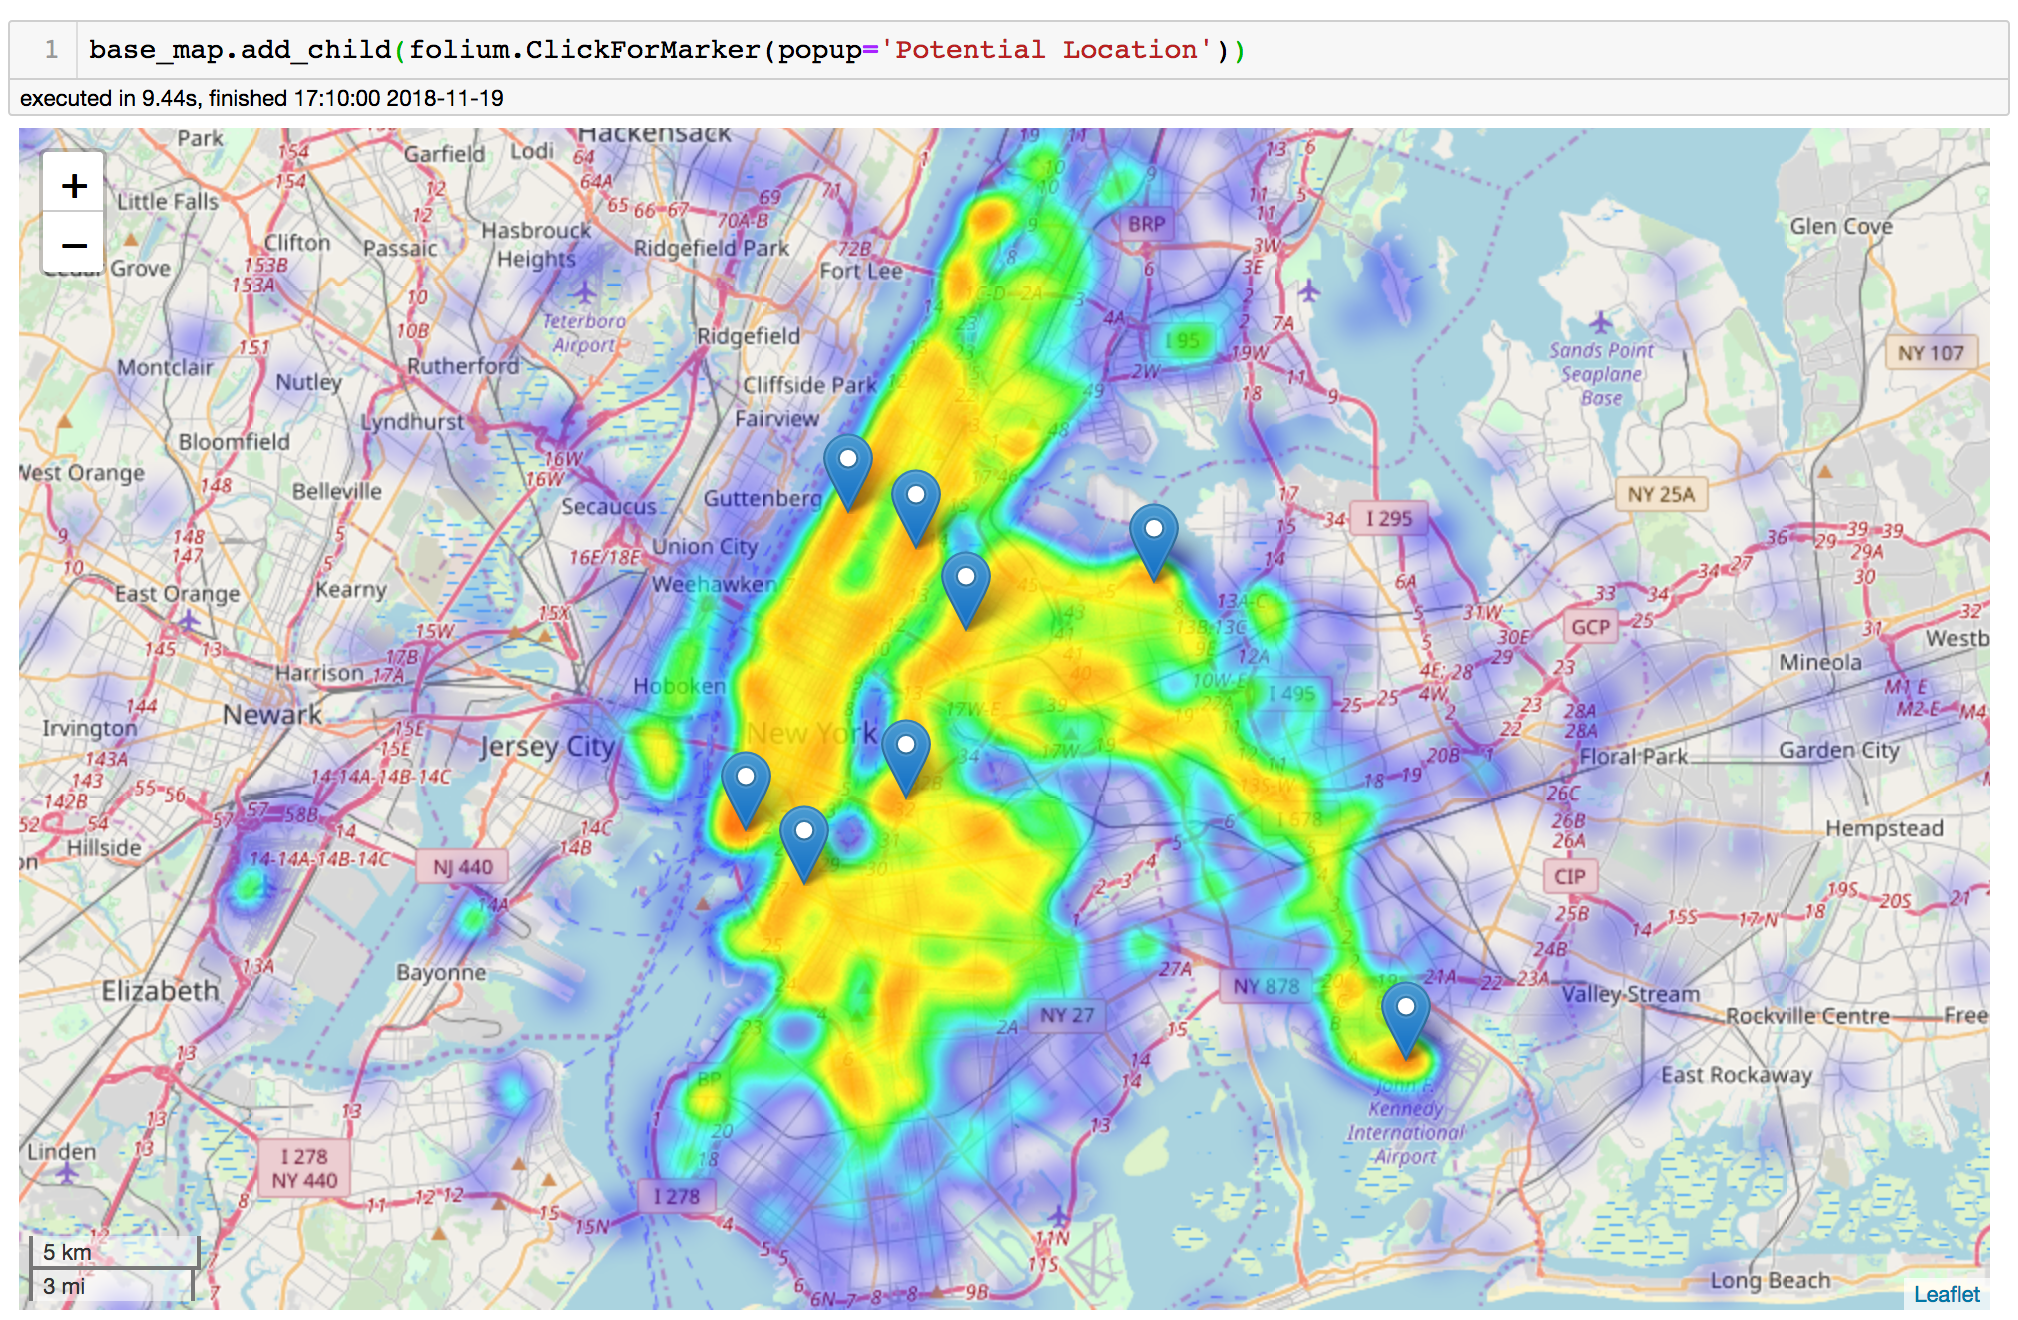
Heatmap
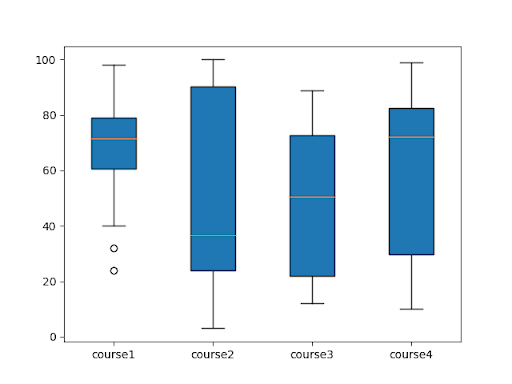
Box plot
Maps
Matplotlib is a plotting library for the Python programming language and its numerical mathematics extension NumPy. It provides an object-oriented API for embedding plots into applications using general-purpose GUI toolkits... designed to closely resemble that of MATLAB, though its use is discouraged. SciPy makes use of Matplotlib.
... Matplotlib has pledged to not support Python 2 past 2020 by signing the Python 3 Statement.
- wikipedia
Every Monday 5pm UK time
By Cheuk Ting Ho


