
Ramona Bîscoveanu
🤝
Hello 👋
Ramona Bîscoveanu

👩🏼💻 Developer @ SAP
@CodesOfRa
🧀 🍷
A tale of true friendship

D3
Vue
😎
🤨
🤝

- D3 renders
- Vue renders
}
DOM elements
1. D3 renders
<template>
  <svg id="myChart" ></svg>
</template>
import * as d3 from "d3";
export default {
  props: ["data"],
  mounted() {
    this.drawChart();
  },
  methods: {
    drawChart() {
     ....
      var xScale = d3
        .scaleLinear()
        .domain([0, n - 1])
        .range([0, width]);
      var yScale = d3
        .scaleLinear()
        .domain([105, 123])
        .range([height, 0]);
      var line = d3
        .line()
        .x(function(d, i) {
          return xScale(i);
        })
        .y(function(d) {
          return yScale(d.y);
        });
      var dataset = this.data;
      var svg = d3
        .select("#myChart")
        .append("svg")
        .attr("width", width )
        .attr("height", height)
        .append("g")
        .attr("transform",
              "translate(" + margin.left +
                         "," + margin.top + ")");
svg
.append("path")
.datum(dataset)
.attr("class", "line")
.attr("d", line);
svg
.selectAll(".dot")
.data(dataset)
.enter()
.append("circle")
.attr("class", "dot")
.attr("cx", function(d, i) {
return xScale(i);
})
.attr("cy", function(d) {
return yScale(d.y);
})
.attr("r", 3);
}
}
};
</script>
import * as d3 from "d3";
export default {
  props: ["data"],
  mounted() {
    this.drawChart();
  },
  methods: {
    drawChart() {
     ....
      var xScale = d3
        .scaleLinear()
        .domain([0, n - 1])
        .range([0, width]);
      var yScale = d3
        .scaleLinear()
        .domain([105, 123])
        .range([height, 0]);
      var line = d3
        .line()
        .x(function(d, i) {
          return xScale(i);
        })
        .y(function(d) {
          return yScale(d.y);
        });
      var dataset = this.data;
      var svg = d3
        .select("#myLineChart")
        .append("svg")
        .attr("width", width )
        .attr("height", height)
        .append("g")
        .attr("transform",
              "translate(" + margin.left +
                         "," + margin.top + ")");
svg
.append("path")
.datum(dataset)
.attr("class", "line")
.attr("d", line);
svg
.selectAll(".dot")
.data(dataset)
.enter()
.append("circle")
.attr("class", "dot")
.attr("cx", function(d, i) {
return xScale(i);
})
.attr("cy", function(d) {
return yScale(d.y);
})
.attr("r", 3);
}
}
};
</script>
😎
working
reuse old code
🤨
not readable
not reactive ✨
Watchers to the rescue
🔎
2. Vue renders and D3 🛠
<template>
  <svg :width="width" :height="heigth">
    <path
      v-for="(d,index) in data"
      :d="generateLine(d.values,index)"
      :key="d.country"
      :stroke="colours(index)"
      :stroke-width="selected[index]"
      fill="none"
      @mouseover="onSelected(d,index)"
      @click="onClick(d)"
    ></path>
  </svg>
</template>
<template>
<svg :width="width" :height="heigth">
<path
v-for="(d,index) in data"
:d="generateLine(d.values,index)"
:key="d.country"
:stroke="colours(index)"
:stroke-width="selected[index]"
fill="none"
@mouseover="onSelected(d,index)"
@click="onClick(d)"
></path>
</svg>
</template><template>
<svg :width="width" :height="heigth">
<path
v-for="(d,index) in data"
:d="generateLine(d.values,index)"
:key="d.country"
:stroke="colours(index)"
:stroke-width="selected[index]"
fill="none"
@mouseover="onSelected(d,index)"
@click="onClick(d)"
></path>
</svg>
</template><template>
<svg :width="width" :height="heigth">
<path
v-for="(d,index) in data"
:d="generateLine(d.values,index)"
:key="d.country"
:stroke="colours(index)"
:stroke-width="selected[index]"
fill="none"
@mouseover="onSelected(d,index)"
@click="onClick(d)"
></path>
</svg>
</template> computed: {
path() {
return d3.line();
}
} computed: {
...
colours: function() {
return d3.scaleSequential(d3.interpolateViridis).domain([0, 265]);
},
xScale: function() {
const { year, margin, width } = this.defaultData;
var xScale = d3
.scaleLinear()
.domain([year.min, year.max])
.range([margin.bottom, width]);
return xScale;
},
yScale: function() {
const { margin, heigth, value } = this.defaultData;
var yScale = d3
.scaleLinear()
.domain([0, value.max])
.range([heigth - margin.top, margin.top]);
return yScale;
}
}
generateLine: function(data) {
      this.path.x(d => this.xScale(d.year))
               .y(d => this.yScale(d.value));
      return this.path(data);
    }
Watch out for perfomance!
 <line-chart :data="data"
             :selected="selected"
             @onHover="handleHover" />
<template>
...
<path v-for="(data,index) in data"
:id="'arc'+index"
:key="'arc'+index"
:d="calculateArc(data,index)"
stroke="#fff"
:fill="returnColor(data.Consumption_Emissions)"
@mouseenter="(event) => hovered = hovered = {data:data,event:event}"
@mouseleave="() => hovered = null"
/>
...
</template> <template>
...
<path v-for="(data,index) in data"
:id="'arc'+index"
:key="'arc'+index"
:d="calculateArc(data,index)"
stroke="#fff"
:fill="returnColor(data.Consumption_Emissions)"
@mouseenter="(event) => hovered = hovered = {data:data,event:event}"
@mouseleave="() => hovered = null"
/>
...
</template> computed: {
arc() {
return d3.arc();
}
...
}
...
methods: {
calculateArc(data) {
this.arc
.innerRadius(80)
.outerRadius(() =>
this.yScale(
data["Consumption_Emissions"]
)
)
.startAngle(() => this.xScale(data["Code"]))
.endAngle(() => {
return this.xScale(data["Code"]) + this.xScale.bandwidth();
})
.padAngle(0.01)
.padRadius(80);
return this.arc(data);
}
...
}computed: {
arc() {
return d3.arc();
}
...
}
...
methods: {
calculateArc(data) {
this.arc
.innerRadius(80)
.outerRadius(() =>
this.yScale(
data["Consumption_Emissions"]
)
)
.startAngle(() => this.xScale(data["Code"]))
.endAngle(() => {
return this.xScale(data["Code"]) + this.xScale.bandwidth();
})
.padAngle(0.01)
.padRadius(80);
return this.arc(data);
}
...
}😎
Easy to read for Vue developers
Reactive
🤨
-
Animations
When D3 needs to control the DOM ?
Axes
Brushes
Transitions
Axes
<g ref="xAxis" :transform="styleX"></g>
<g ref="yAxis" :transform="styleY"></g>
mounted() {
this.$nextTick(function() {
d3.select(this.$refs.xAxis)
.call(d3.axisBottom(this.xScale)
.ticks(7));
d3.select(this.$refs.yAxis)
.call(d3.axisLeft(this.yScale)
.ticks(7));
});
}<g ref="xAxis" :transform="styleX"></g>
<g ref="yAxis" :transform="styleY"></g> mounted() {
this.$nextTick(function() {
d3.select(this.$refs.xAxis)
.call(d3.axisBottom(this.xScale)
.ticks(7));
d3.select(this.$refs.yAxis)
.call(d3.axisLeft(this.yScale)
.ticks(7));
});
}Transitions
  watch: {
    data(newValue) {
      newValue.map((data, index) => {
        var id = "#arc" + index;
        var d = this.calculateArc(data, index);
        TweenMax.to(id, 2, {
          attr: {
            d: d
          },
          ease: Power1.easeInOut,
          repeat: 0,
          yoyo: true
        });
      });
    }
  }
<transition-group tag="g" css="false" appear="true"
@enter="enter" @leave="leave">
...
</transition-group>What about layouts?
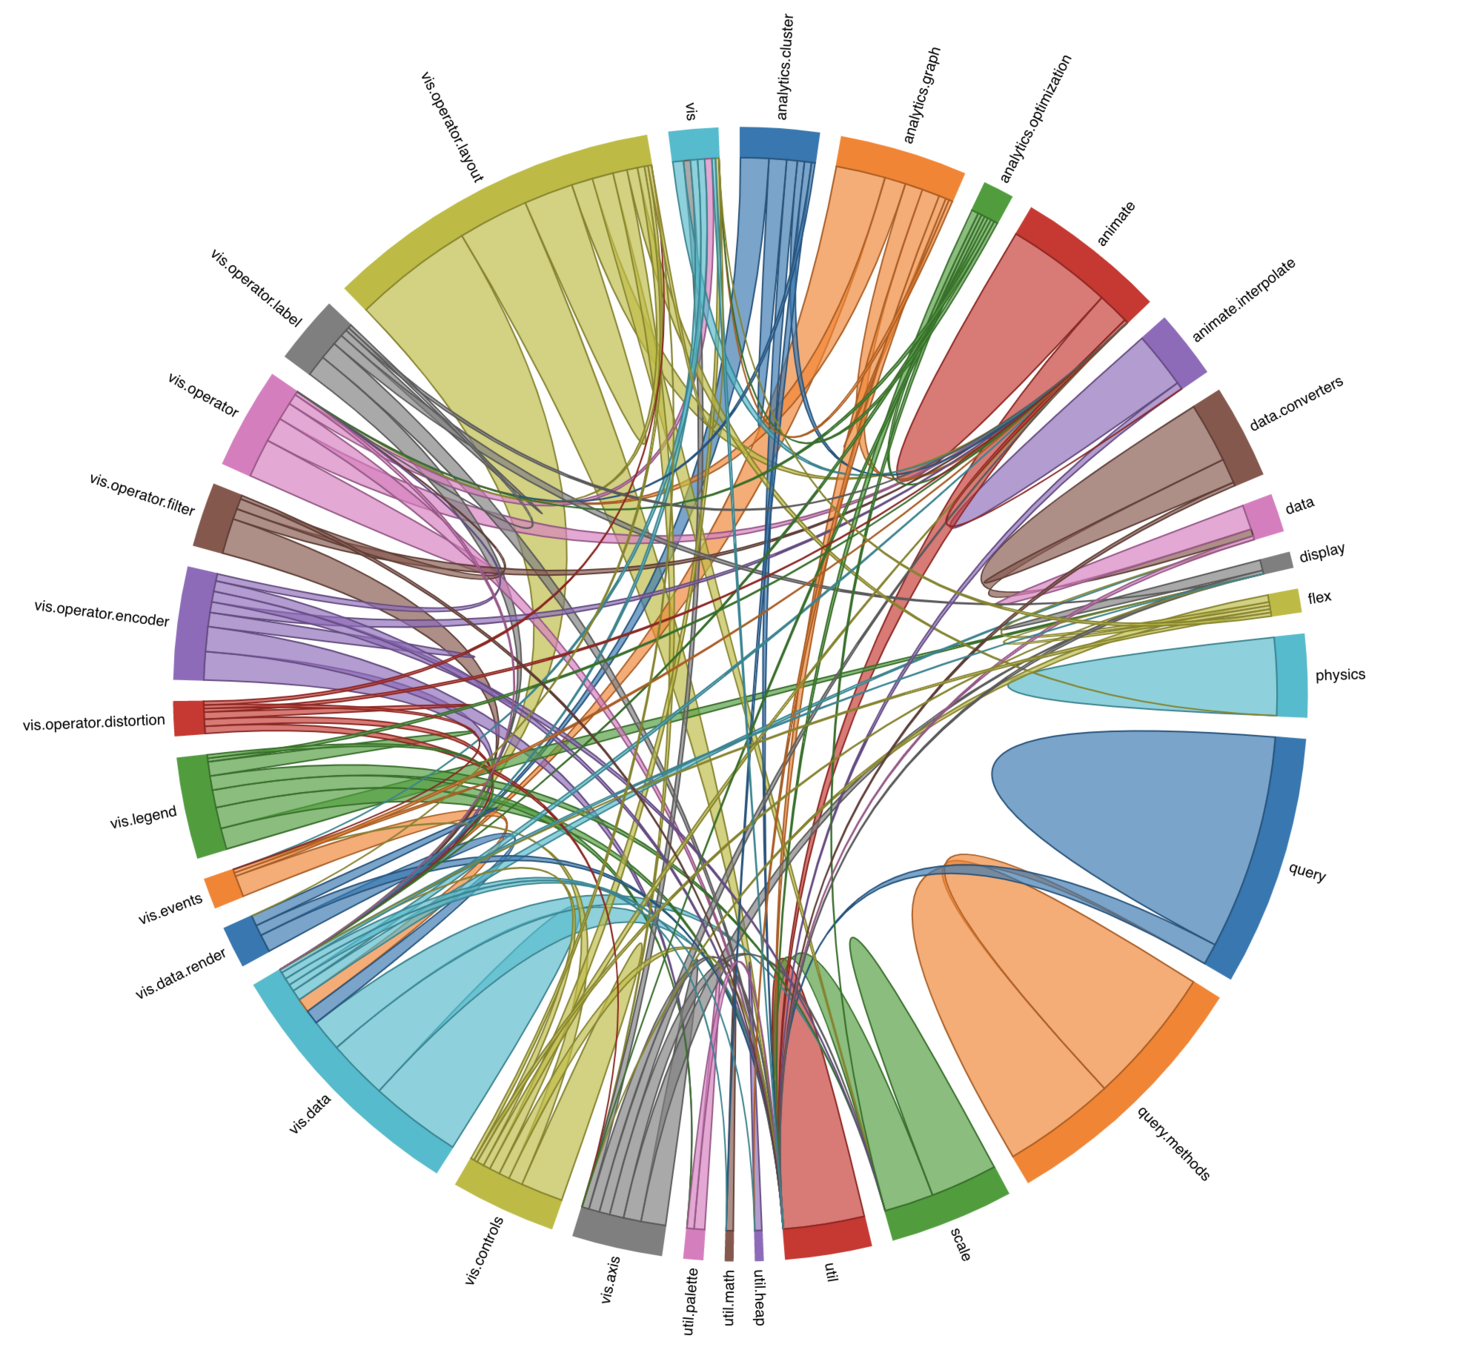
Links
Nodes
  <svg>
    <g transform="translate(460,430)">
      <g class="links">
        <line
          v-for="d in links"
          :key="d.index+'link'"
          :id="d.index"
          :x1="d.source.x"
          :y1="d.source.y"
          :x2="d.target.x"
          :y2="d.target.y"
          :stroke="calculateLinkColour(d)"
        ></line>
      </g>
      <g class="nodes">
        <circle
          v-for="(d,index) in nodes"
          :key="index+'node'"
          :r="calculateR(d.name)"
          :cx="d.x"
          :cy="d.y"
          :fill="calculateColour(d)"
          @click="selectedNode(d)"
        ></circle>
      </g>
    </g>
  </svg>
<svg>
<g transform="translate(460,430)">
<g class="links">
<line
v-for="d in links"
:key="d.index+'link'"
:id="d.index"
:x1="d.source.x"
:y1="d.source.y"
:x2="d.target.x"
:y2="d.target.y"
:stroke="calculateLinkColour(d)"
></line>
</g>
<g class="nodes">
<circle
v-for="(d,index) in nodes"
:key="index+'node'"
:r="calculateR(d.name)"
:cx="d.x"
:cy="d.y"
:fill="calculateColour(d)"
@click="selectedNode(d)"
></circle>
</g>
</g>
</svg>Links
Nodes
data() {
    return {
        ....
        layout: null
    }
},
mounted() {
    this.layout = d3
        .forceSimulation()
        .force(
            "link",
            d3.forceLink().id(function(d) {
                return d.index;
            })
        )
        .force(
            "charge",
            d3
            .forceManyBody()
            .strength(-75)
            .distanceMax([230])
        )
        .force("center", d3.forceCenter(15, 15));
},
watch: {
data(newData) {
var relations = [];
var data = newData;
this.filterChildren(data);
this.createLinks(data, relations);
relations.map((d, index) => {
this.links.push({
index: index,
source: this.nodes[d[0]],
target: this.nodes[d[1]]
});
});
this.layout
.nodes(this.nodes)
.on("tick", () => {
this.$forceUpdate();
})
.force("link")
.links(this.links)
.distance(40)
.strength(0.3);
}
}, watch: {
data(newData) {
var relations = [];
var data = newData;
this.filterChildren(data);
this.createLinks(data, relations);
relations.map((d, index) => {
this.links.push({
index: index,
source: this.nodes[d[0]],
target: this.nodes[d[1]]
});
});
this.layout
.nodes(this.nodes)
.on("tick", () => {
this.$forceUpdate();
})
.force("link")
.links(this.links)
.distance(40)
.strength(0.3);
}
},😎
-
Clean
-
Easier to read
🤨
- re-rendering on every 'tick'
- will it scale ?
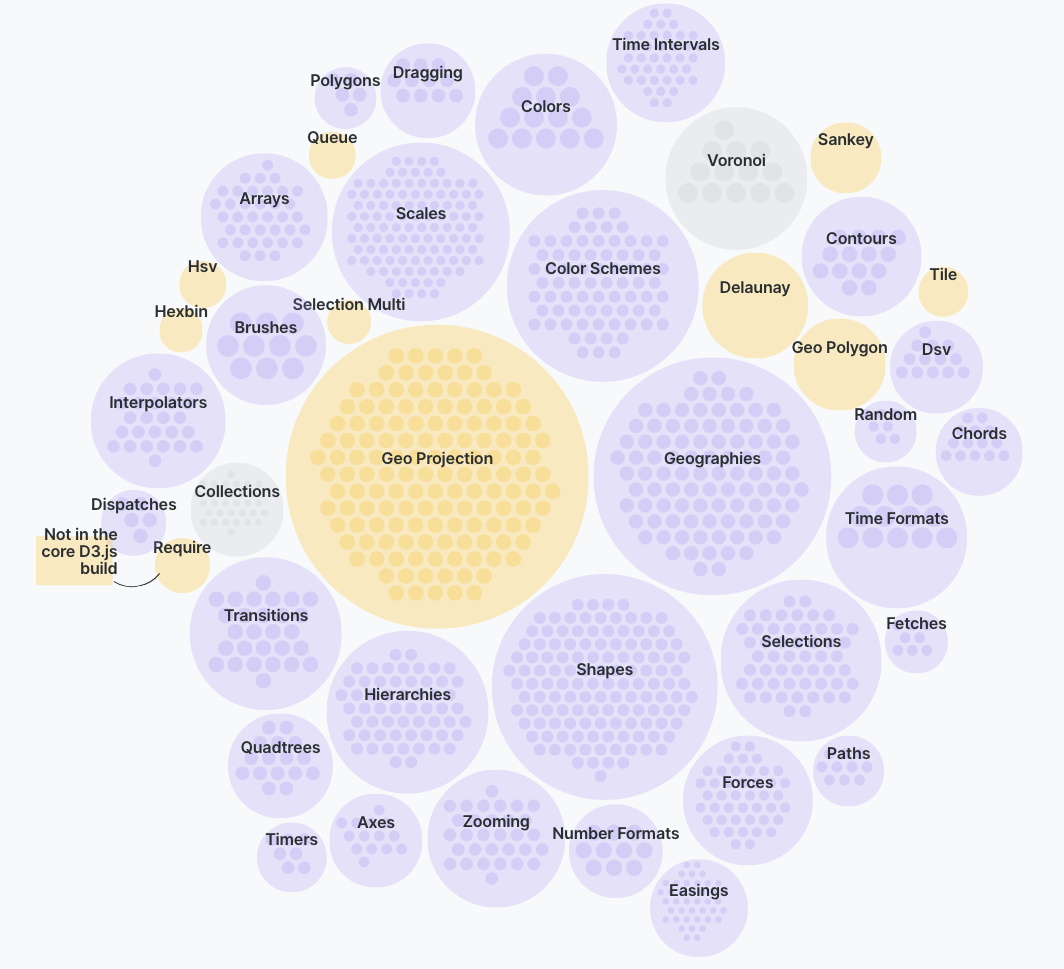
Large datasets
<canvas ref="myBigChart"></canvas>v-show
🤝
Thank you!

Data Visualization in Vue
By Ramona Biscoveanu
Data Visualization in Vue
D3 and Vue - Talk from Vue London 2019


