


Content ITV PRO
This is Itvedant Content department
Generate Business Insights Using Pivot Tables
Business Scenario
Welcome!
Today is your thirteenth day as a Junior Data Analyst at a retail analytics company.
The retail company operates across multiple cities and stores, selling products through various channels and customer segments. Every day, thousands of transactions generate information about revenue, units sold, product categories, and customer behavior.
Pre-Lab Preparation
Click here to download previous lab file: DM LAB 12
Topic: Data Manipulation with Pandas
1) Unlocking Pivot Table Techniques
Git Pull
git pull origin branchNameClick to download Dataset : Retail_Dataset_Cleaned
Task 1: Building Sales Summary Reports Using Pivot Tables
In retail businesses, managers regularly need summarized reports instead of viewing thousands of individual records
They often want to know which categories, cities, and customer segments contribute more to business performance. Creating such reports manually can be difficult and time-consuming.
Therefore, analysts use Pivot Tables to transform detailed transactional data into summarized business reports.
What is a Pivot Table?
A Pivot Table is a data summarization technique that reorganizes and groups information to generate meaningful insights from large datasets.
It helps analysts:
Open Google Colab
1
2
Import Required Libraries
import pandas as pd
import numpy as np
3
Upload the Retail Dataset
4
Load Dataset Using Pandas
df = pd.read_csv("/content/Retail_Dataset_Modified.csv")
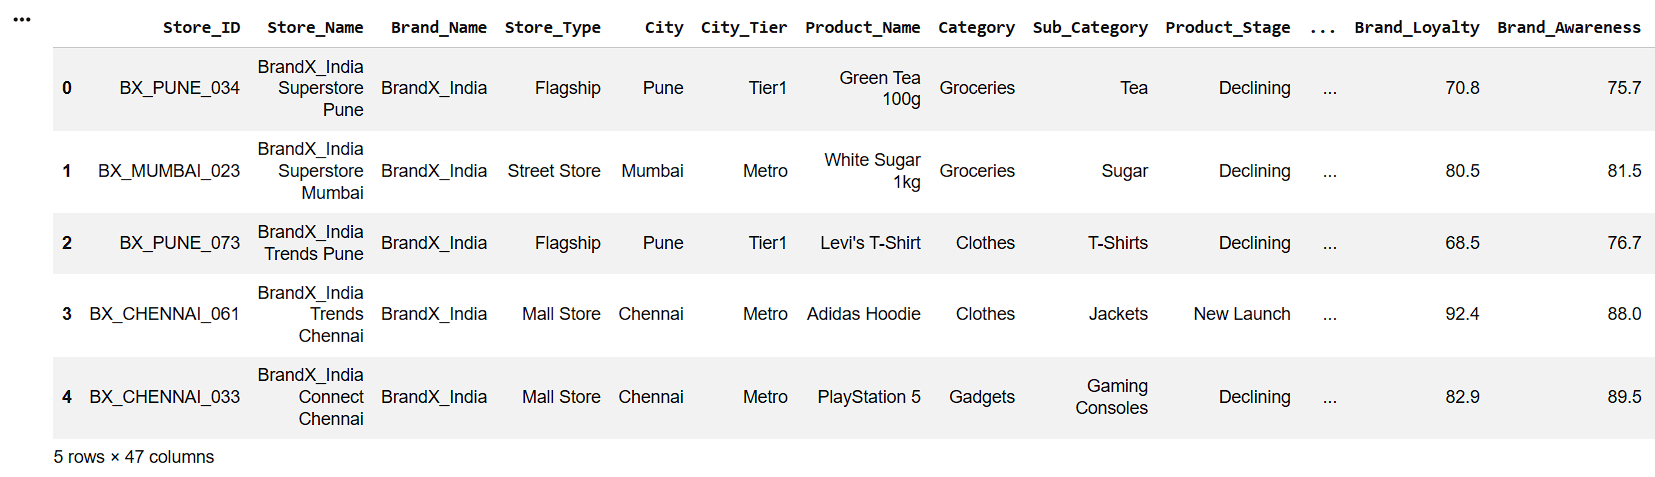
print("Dataset Loaded Successfully")Display First Five Records
5
df.head()6
Check Dataset Information
df.info()7
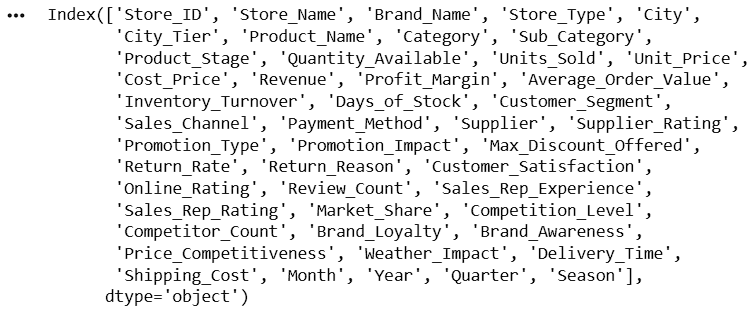
Display Column Names
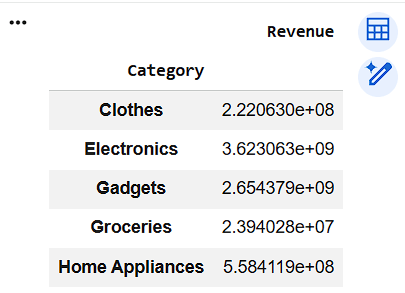
df.columnsCreate Category-wise Revenue Pivot Table
category_revenue = pd.pivot_table(
    df,
    values="Revenue",
    index="Category",
    aggfunc="sum"
)

category_revenue
8
pivot_table() is a Pandas function used to summarize and aggregate data.
values="Revenue" -> Perform calculations on the Revenue column.
index="Category" -> Group the data according to the Category column.aggfunc="sum" -> aggfunc means Aggregation Function.
Add all Revenue values within each category.
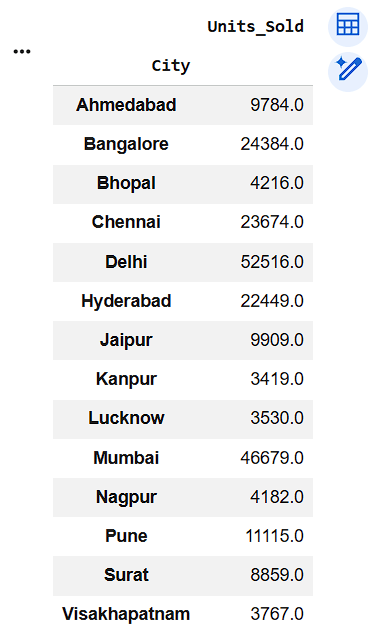
Create City-wise Units Sold Pivot Table
9
8
city_sales = pd.pivot_table(
df,
values="Units_Sold",
index="City",
aggfunc="sum"
)
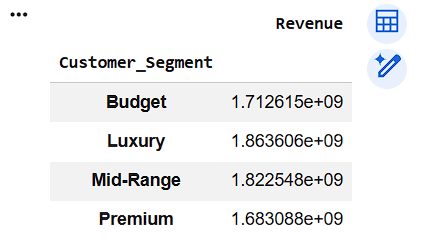
city_salesCreate Customer Segment-wise Revenue Report
10
segment_revenue = pd.pivot_table(
    df,
    values="Revenue",
    index="Customer_Segment",
    aggfunc="sum"
)

segment_revenue
Task 2: Aggregating Retail Data for Business Decision-Making
In retail businesses, managers do not only require summarized reports but also need multiple performance measures such as average revenue, total units sold, and maximum profit margins. Calculating these statistics individually for every category or city is inefficient.
Therefore, analysts use Data Aggregation techniques to perform multiple calculations and generate comprehensive business reports.
What is Data Aggregation?
Data Aggregation is the process of combining and summarizing data by applying statistical operations such as:
Aggregation converts raw data into useful business information that supports analysis and decision-making.
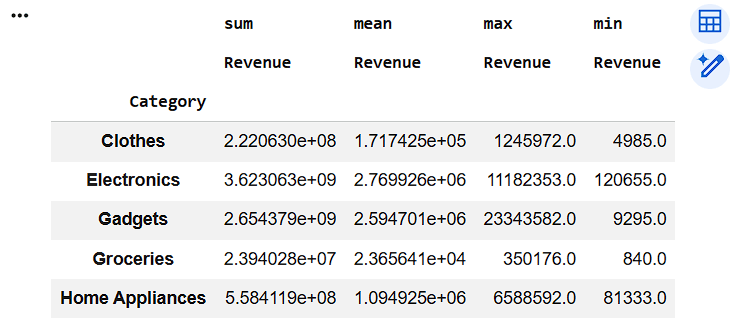
Calculate Multiple Revenue Statistics Category-wise
1
category_summary = pd.pivot_table(
df,
values="Revenue",
index="Category",
aggfunc=["sum", "mean", "max", "min"]
)
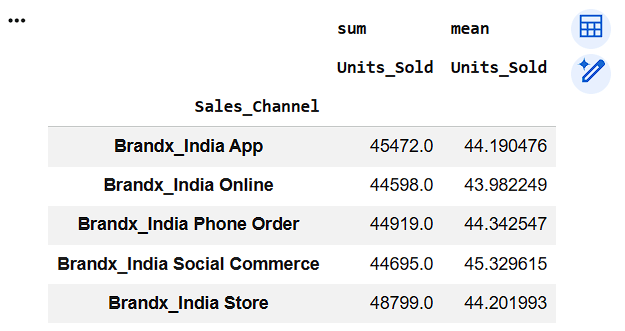
category_summaryAggregate Units Sold by Sales Channel
2
channel_summary = pd.pivot_table(
df,
values="Units_Sold",
index="Sales_Channel",
aggfunc=["sum", "mean"]
)
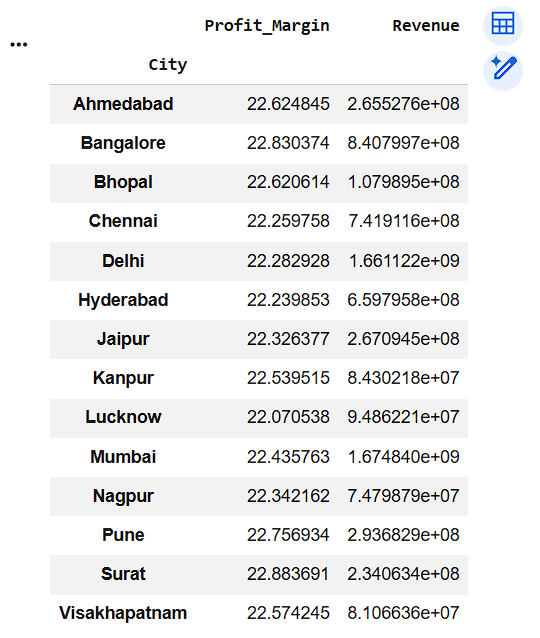
channel_summaryAggregate Revenue and Profit Margin by City
3
city_performance = pd.pivot_table(
df,
values=["Revenue", "Profit_Margin"],
index="City",
aggfunc={
"Revenue": "sum",
"Profit_Margin": "mean"
}
)
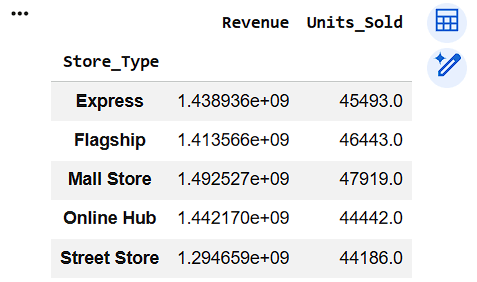
city_performanceCreate Store Type Performance Report
4
store_summary = pd.pivot_table(
    df,
    values=["Revenue", "Units_Sold"],
    index="Store_Type",
    aggfunc="sum"
)

store_summary
Great job!
You have successfully completed your lab on Generate Business Insights Using Pivot Tables. In this lab, you have: Created Pivot Tables using Pandas, Generated category-wise and city-wise business reports, Aggregated retail data using statistical functions, Summarized revenue and sales performance, produced insights that support business decision-making
You are now ready to move to the next stage of Junior Data Analyst.
Checkpoint
Git Push
git push origin branchNameNext-Lab Preparation
Topic: Data Manipulation with Pandas
1) Deep Dive Into Data Analysis: Concept of crosstab and pivot table
By Content ITV


