Unit 2 - Metrics
-
"Quality metrics let you know when to laugh and when to cry", Tom Gilb
-
"If you can't measure it, you can't manage it", Deming
-
"Count what is countable, measure what is measurable. What is not measurable, make measurable", Galileo
THE IMPORTANCE OF METRICS
"Not everything that can be counted counts, and not everything that counts can be counted.", Albert Einstein
SOME WORDS OF WARNING
SUBJECTIVENESS OF QUALITY
"When a measure becomes a target, it ceases to be a good measure"
SOME WORDS OF WARNING
GOODHART'S LAW
E.g. Increase number of test cases, detected bugs, penalize false bug reports...
Fingerpointing, Create Reports, Evaluate People...
WHY DOES THAT HAPPEN?
BECAUSE OF THE TARGET OF MEASURING
Goodhart's laws occur when metrics are used for:
By measuring something, you should not always imply that the target is always improving that metric
WHY SHOULD WE MEASURE?
Improve Process
Increase Quality
Predict
Re-use Experiences
Estimate Cost, Effort, etc.
...
UNDERSTAND TO IMPROVE
What is measuring?
Collect (Data)
Calculate (Metrics)
Evaluate (Metrics)
Measures
Metrics
Indicator
Examples: 120 detected bugs, 12 months of project duration, 10 engineers working on the project, 100.000 Lines of Code (LOC)
Examples: 2 bugs found per engineer-month, 1.2 bugs per KLOC
Examples: bugs found per engineer-month might be an indicator of the test process efficiency, bugs/KLOC an indicator of code quality, etc..
Measure: Quantitative indication of the exact amount (dimension, capacity, etc.) of some attributes
Measurement: The act of determining a measure
Metric: is a quantitative measure of the degree to which a system, component or a process possesses a given attribute
Indicator: a metric that provides insights into the product, process, project
Key Concepts
Software Metrics
The 3 "P"s
Process
Project
Product
Process Project Product
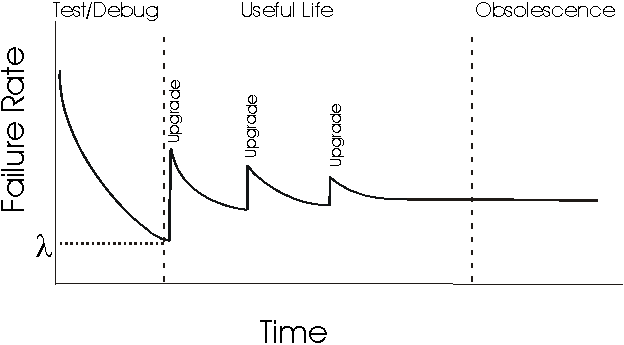
Process Metrics: Related to the Software Development Life Cycle (e.g. the process throughout which we developed software). E.g. if a measure the defects I detect every month, I can get the metric "Defect Arrival Pattern" and get an indication on how good my process is about removing defects. E.g. If the number of defects detected increases with the time, I might need to increases testing, review the testing approach, add code reviews, etc...
Project Metrics: Related to the Team that developed the product, usually focused on efficiency, productivity, etc. Errors found per engineer-month is an example of a project metric that provides an indication of how the efficiency of my engineers with respect to detecting defects.
Product Metrics: Related to the finished product itself. They measure aspect such as product size, complexity, quality level... E.g in the case of quality, a possible metric is the Defect Density (number of defects / Size) which provides an indication of the quality of the product (the higher the worse)
The Example
120 defects detected during 6 months by 2 engineers

Defects defected every month: 10, 10, 20, 20, 25, 35

Defects remaining in the final product: 40

Size of the Product: 40.000 Lines of Code
Process Metric: Defect Arrival Pattern 10, +0, +10, +0, +5, +10   -> Indicator of Maturity

Project Metric: 40 KLOC / 2 / 6 = KLOC per eng-month   -> Indicator of Productivy

Product Metric: 40 defects / 40 KLOC = 1 defect / KLOC -> Indicator of Quality
Measurements
Metrics and Indicators
Not all the metrics above are related to quality, let's focus on them
Software Quality Metrics
End Product
In Process
Intrinsic
Customer
Quality
Metrics
Metrics that provide indications of the Quality of the Product and Process
Metrics that provide indications of the Quality of the Process. Useful to take actions to improve the process the team is following for building products.
Metrics that provide indications of the Quality of the end of product. Don't take into account how the product has been developed as they just look at a snapshot.
Not useful to improve the current product but to understand its quality
Don't take into account the customer. The product and just the product.
Focused on customer perception of the product.
TYPE OF QUALITY METRICS
End Product Metrics do not let me improve product quality as it's too late
In-process metrics provide information about the process but not about the product as it's not finished
Prevent Bugs

Detect Bugs and fix them

Implement techniques to contain them
Measure and Calculate them

AND

Anticipate end-product metrics
NO RETURN POINT
Controlled roll-out

A/B Testing

Beta programs
are intended to mitigate this "leap of faith"
QA Activities
Process metrics
KNOWING BEFORE IT'S TOO LATE
Intrinsic End Product Metrics
End Product
In Process
Intrinsic
Customer
Quality Metrics
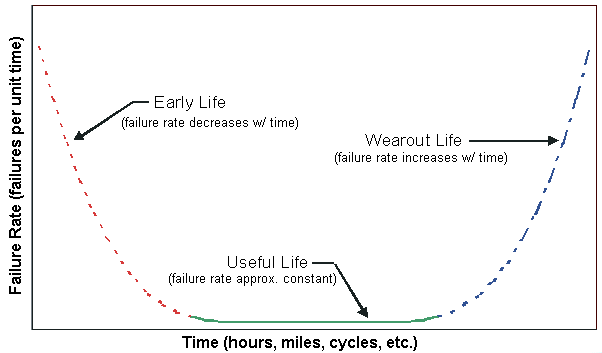
Reliability
How often your product has a failure, i.e.
Probability of not having a failure during a specific amount of time
R(n) - Probability of not failing during n time
where n is the number of time units (days, hours...)
F(n) = 1 - R(n) - Probability of failing during n time
For instance, if the time is measured in days, R(1) is the probability of the product not having a failure during 1 day
Error Rate and Mean Time to Failure
Metrics very related to Reliability
Mean Time To Failure (MTTF) is the average time that occurs between two failures in the system
Error Rate is the average number of failures suffered by the system during a given amount of time
Error Rate = 1 / MTTF
Error Rate vs. Reliability
Relationship between them depends on the statistical distribution of the errors, not only on the error rate.
Example: The number of failures of one product during the days of one week is 10, 20, 30, 40, 50, 60, 70. A second product fails in the opposite way: 70, 60, 50, 40, 30, 20, 10.
Total number of errors is 280, Error Rate = 280/7 = 40 Errors / Day for both systems, but the Reliability of the first day is very different, right?
Error Rate vs. Reliability
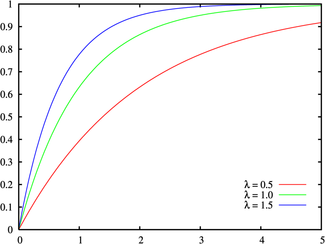
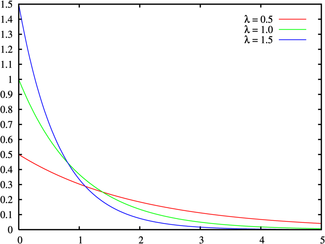
If the system failures follow an exponential distribution:
R(t) = e^{-\lambda*t}
\lambda =
Constant Error Rate, in failures per unit of measurement, (e.g., failures per hour, per cycle, etc.)
Probability Density Function
Cumulative Density Function
Error Rate vs. Reliability
Think about Hardware...
Do you think Hardware has a constant error rate or do you think it changes with the time? If it changes with the time, how?
Error Rate vs. Reliability
Think about Hardware...
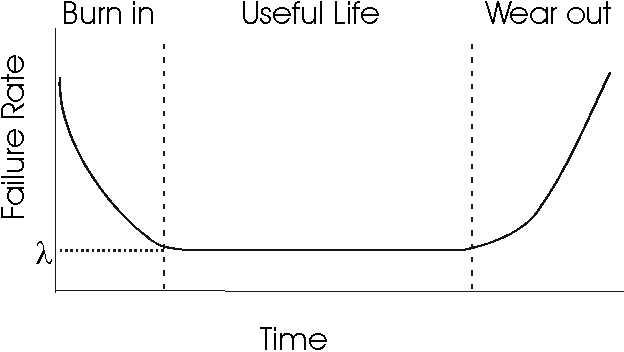
Error Rate vs. Reliability
Weibull distribution intended to be versatile and flexible enough to deal with this kind of Failure Rates
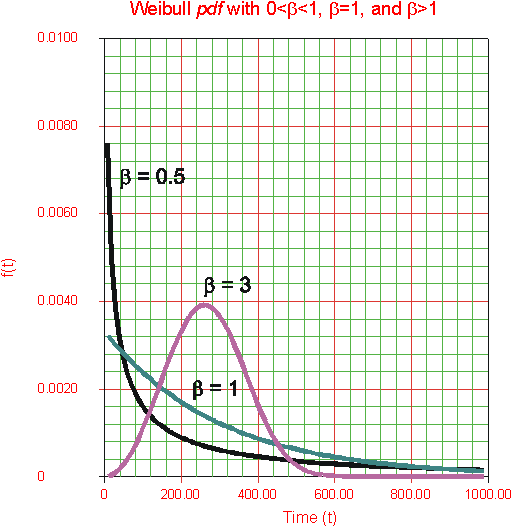
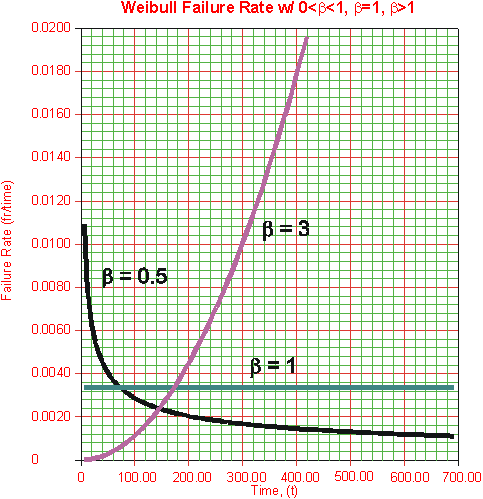
R(t) = e^{-(t/\eta)^\beta}
\lambda(t) = (\beta/\eta)*(t/\eta)^{\beta-1}
Fixed eta
Fixed eta
Error Rate vs. Reliability
Parallel and Series Systems
To not fail, the system requires all the three modules not to fail
To not fail, the system requires all the three modules not to fail at the same time
DEFECT DENSITY
Density = Amount / Volume
Density = Weight / Volume
for instance:
Defect Density =
Amount of Defects / Software Size
Number of Defects
- Total number of defects remaining in the product
- Total number of defects reported by end-users
- Total number of critical/major/minor defects
- Total number of new defects (in a new version)
Different types of densities can be calculated depending on the type of defects that we count into the numerator, for instance:
... in any case, the only difference is the name and the meaning of the metric, the way to calculate it is the same
Size of the Software
The easiest way to measure the size of a Software is counting the Lines of Code (LOC). The more LOC, the bigger is the software, the more opportunities for inject defects we have.
With the same amount of defects. The bigger the software is, the smaller the density.
1.000 LOC = 1 KLOC
Example
Product A - Version 1
- 20 Defects reported by end-users
- 10 Defects detected but not reported by end-users
- From the overall 30 defects, 15 Critical ones.
- Size: 30 KLOC
PLEASE CALCULATE THE DIFFERENT DEFECT DENSITIES YOU CAN IMAGINE
Example
PLEASE CALCULATE THE DIFFERENT DEFECT DENSITIES YOU CAN IMAGINE
Product A - v1.0
-
1000 Defects reported during development
- 900 Critical (Fixed in v1.0)
- 70 Major (Fixed in v1.0)
- 30 Minor (NOT fixed in v1.0)
30 KLOC
- 20 new defects detected after the release (because of user usage)
Example
Product A - v1.0
-
1000 Defects reported during development
- 900 Critical (Fixed in v1.0)
- 70 Major (Fixed in v1.0)
- 30 Minor (NOT fixed in v1.0)
30 KLOC
- 20 new defects detected after the release has been used for a month (because of user usage)
FOR REPORTED BUGS:
DD = 1000 / 30 = 33.33 Defects reported / KLOC
Per type:
900 / 30 = 30 Critical Defects Reported / KLOC
70 / 30 = 2.3 Major Defects Reported / KLOC
30 / 30 = 1 Minor Defects Reported / KLOC
FOR BUGS IN FINAL PRODUCT (AT RELEASE TIME)
DD = 30 / 30 = 1 Defects / KLOC

FOR ALL THE BUGS WE KNOW AFTER 1 MONTH
DD = (30+20) / 30 = 1.6 Defects / KLOC
Example
Product A - v1.1
30 KLOC
5 KLOC
v1.0 released
v1.1 released
1 month
Team fixed all the bugs remaining (30) and reported by users (20)
Team added new functionality (5000 new LOC)
During Development of v1.1 we reported:
200 Bugs, 180 Critical, 10 Major, 10 Minor
We fixed all the bugs except Minor ones
1 month
During the usage of v1.1 (1 month) based on users usage we detected 10 new bugs
PLEASE CALCULATE THE DIFFERENT DEFECT DENSITIES YOU CAN IMAGINE
Example
FOR REPORTED BUGS:
DD = 1000 / 30 = 33.33 Defects reported / KLOC
Per type:
900 / 30 = 30 Critical Defects Reported / KLOC
70 / 30 = 2.3 Major Defects Reported / KLOC
30 / 30 = 1 Minor Defects Reported / KLOC
FOR BUGS IN FINAL PRODUCT (AT RELEASE TIME)
DD = 30 / 30 = 1 Defects / KLOC

FOR ALL THE BUGS WE KNOW AFTER 1 MONTH
DD = (30+20) / 30 = 1.6 Defects / KLOC
FOR REPORTED BUGS:
DD = 200 / 35 = 5.7 Defects reported / KLOC
Per type:
180 / 35 = 5.14 Critical Defects Reported / KLOC
10 / 35 = 0.28 Major Defects Reported / KLOC
10 / 35 = 0.28 Minor Defects Reported / KLOC
FOR BUGS IN FINAL PRODUCT (AT RELEASE TIME)
DD = 10 / 35 = 0.38 Defects / KLOC

FOR ALL THE BUGS WE KNOW AFTER 1 MONTH
DD = (10+10) / 35 = 0.57 Defects / KLOC
v1.0
v1.1
Defect Density?
Which number would you choose as
Example
FOR REPORTED BUGS:
DD = 1000 / 30 = 33.33 Defects reported / KLOC
Per type:
900 / 30 = 30 Critical Defects Reported / KLOC
70 / 30 = 2.3 Major Defects Reported / KLOC
30 / 30 = 1 Minor Defects Reported / KLOC
FOR BUGS IN FINAL PRODUCT (AT RELEASE TIME)
DD = 30 / 30 = 1 Defects / KLOC

FOR ALL THE BUGS WE KNOW AFTER 1 MONTH
DD = (30+20) / 30 = 1.6 Defects / KLOC
v1.0
v1.1
FOR REPORTED BUGS:
DD = 200 / 5 = 40 Defects reported / KLOC
Per type:
180 / 5 = 36 Critical Defects Reported / KLOC
10 / 5 = 2 Major Defects Reported / KLOC
10 / 5 = 2 Minor Defects Reported / KLOC
FOR BUGS IN FINAL PRODUCT (AT RELEASE TIME)
DD = 10 / 5 = 2 Defects / KLOC

FOR ALL THE BUGS WE KNOW AFTER 1 MONTH
DD = (10+10) / 5 = 4 Defects / KLOC
FOR REPORTED BUGS:
DD = 1000 / 30 = 33.33 Defects reported / KLOC
Per type:
900 / 30 = 30 Critical Defects Reported / KLOC
70 / 30 = 2.3 Major Defects Reported / KLOC
30 / 30 = 1 Minor Defects Reported / KLOC
FOR BUGS IN FINAL PRODUCT (AT RELEASE TIME)
DD = 30 / 30 = 1 Defects / KLOC

FOR ALL THE BUGS WE KNOW AFTER 1 MONTH
DD = (30+20) / 30 = 1.6 Defects / KLOC
FOR REPORTED BUGS:
DD = 200 / 35 = 5.7 Defects reported / KLOC
Per type:
180 / 35 = 5.14 Critical Defects Reported / KLOC
10 / 35 = 0.28 Major Defects Reported / KLOC
10 / 35 = 0.28 Minor Defects Reported / KLOC
FOR BUGS IN FINAL PRODUCT (AT RELEASE TIME)
DD = 10 / 35 = 0.38 Defects / KLOC

FOR ALL THE BUGS WE KNOW AFTER 1 MONTH
DD = (10+10) / 35 = 0.57 Defects / KLOC
All
Lines
New
Lines
If you just focus on the absolute figures, this could be misleading: for end-users we are improving the quality but we might be doing worse and worse in every iteration
YOU NEED TO UNDERSTAND WHAT YOU ARE MEASURING, OTHERWISE, IT'S JUST A NUMBER OF NO HELP TO YOU
NOW, LET'S FOCUS ON THE DENOMINATOR
ARE THE LINES OF CODE A GOOD MEASUREMENT OF PRODUCT SIZE?
WHAT IS A LOC?
When the only programming language was assembler, this could be easy:
Physical Line = Instruction = LOC
But now, there are multiple programming languages with different approaches that includes comments, control sentences, logical lines that occupy multiple screen lines
... and as programming languages are very flexible, the same programming language could be used in different styles
WHAT IS A LOC?
- EXECUTABLE LINES
- EXECUTABLE LINE + DATA DEFINITIONS
- EXECUTABLE LINES + DATA DEFINITIONS + COMMENTS
- EXECUTABLE LINES + DATA DEFINITIONS + JOB CONTROL LINES
- PHYSICAL LINES ON AN INPUT SCREEN
- LINES TERMINATED BY LOGICAL DELIMITERS
Is it a good measurement of how big the code is? Maybe we should not talk about the size of the code in terms of length but in terms of how many opportunities for injecting defects there are. (OFE)
for (i=0; i<100; ++i) printf("I love compact coding"); /* what is the number of lines of code in this case? */
/* How many lines of code is this? */
for (i=0; i<100; ++i)
{
  printf("I am the most productive developer");·
}
/* end of for */
1 LOC if I count lines limited by line breaks
6 LOC if I count lines limited by line breaks, 4 if I don't count comments...
Conclusion: If I want to measure how many opportunities to inject defects are there in the software, using Lines of Code is not the best approach
The opportunities for injecting defects are about the same in both examples, but the LOC count is very different
EXAMPLE
LOC BEYOND QA
Remember the Goodhart's Law: If a metric becomes a target, it's not useful anymore
If I want to improve productivity, and for that, my target is increasing the number of LOC per developer-month, it could have a very negative impact on the project (devs can start doing stupid things such as adding unneeded comments)
Please have a look at:
FUNCTION POINTS
-
Alternative way to measure software size
-
Useful for quality purposes but also for measuring team productivity in a fair way
-
Created by Albrecht at IBM in the mid-1970s
-
Very-very-very bad name: it does not count the functions
-
It counts different aspects to determine how complex a software is
-
It's agnostic of the programming language and development styles
WHAT?
-
External Inputs (EI): Process in which data comes inside from the outside (e.g. from an input screen from another app...)
-
External Outputs (EO): Process in which data goes from inside to outside. The data must be derived data (i.e. data that was not stored directly but that has been calculated based on other data)
-
External Inquiries (EQ): Similar to EO but the data must not be derived data.
-
Internal Logical Files (ILF): A group of logically related data that resides inside the application (and hence maintained by EI).
-
External Interface Files (EIF): A group of logically related data that resides outside of the app and is maintained by other app.
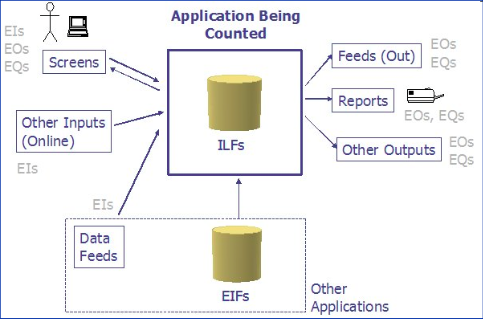
KEY CONCEPTS
Need to count the amount of:
CALCULATING FUNCTION POINTS
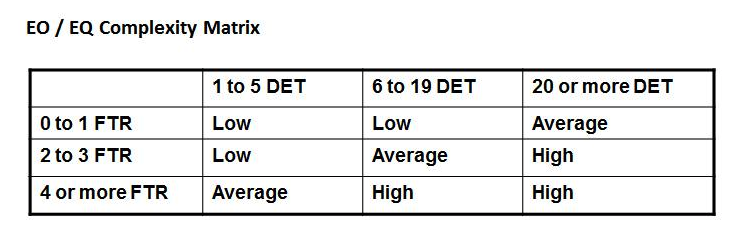
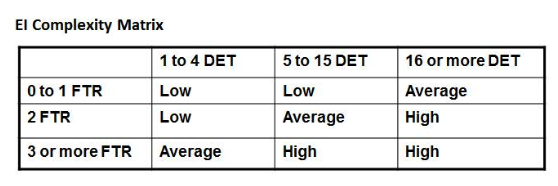
1 - Count Number of EIs, EOs, EQs, ILF, EIF
X1 High
Y1 Mid
Z1 Low
2 - Divide every bucket you have counted in 3 depending on its complexity (Low, Medium, High)
3 - Multiply the count of every bucket by the predefined factor (based on a table) and add all to calculate the Function Count
EIs
EOs
EQs
ILF
EIF
X2 High
Y2 Mid
Z2 Low
X3 High
Y3 Mid
Z3 Low
X4 High
Y4 Mid
Z4 Low
X5 High
Y5 Mid
Z5 Low
#EIs
#EOs
#ILFs
#EQs
#EIFs
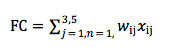
X1*Factor-EI-High + Y1*Factor-EI-Mid + Z1*Factore-EI-Low + X2*Factor-EO-High...
X5*Factor-EIF-High + Y5*Factor-EIF-Mid + Z5*Factore-EIF-Low = FUNCTION COUNT
4 - Multiply the Function Count by the adjustment factor that depends on the type of software
FUNCTION COUNT * VALUE ADJUSTMENT FACTOR = FUNCTION POINTS
In order to fill in the table we need to:
 - Know how to count the components
 - Know how to classify depending on complexity
 - Know how to calculate the Value Adjustment Factor
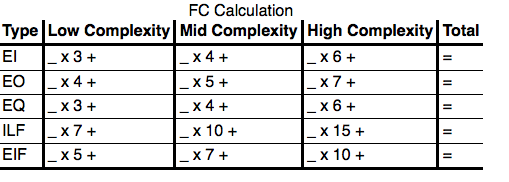
Function Points = FC * ValueAdjustmentFactor
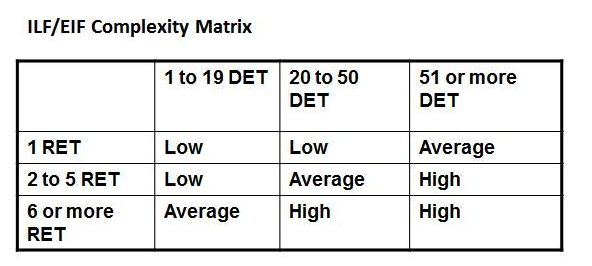
Know how to classify depending on complexity
FTR (File Types Referenced): Number of files updated or referred
DET: Number of unique fields in the files
RET (Record Element Type): is a user recognizable subgroup of data elements (e.g. a table in a DB)

DET: unique user recognizable, non recursive field
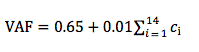
Know how to calculate the Value Adjustment Factor
Based on a list of 14 characteristics and evaluate the degree in terms of effect in the software from 0 to 5 (ci). After that, apply the following formula:
- Data communications: How many communication facilities are there to aid in the transfer or exchange of information with the application or system?
- Distributed data processing: How are distributed data and processing functions handled?
- Performance: Did the user require response time or throughput?
- Heavily used configuration: How heavily used is the current hardware platform where the application will be executed?
- Transaction rate: How frequently are transactions executed daily, weekly, monthly, etc.?
- On-Line data entry: What percentage of the information is entered On-Line?
- End-user efficiency: Was the application designed for end-user efficiency?
- On-Line update: How many ILF’s are updated by On-Line transaction?
- Complex processing: Does the application have extensive logical or mathematical processing?
- Reusability: Was the application developed to meet one or many user’s needs?
- Installation ease: How difficult is conversion and installation?
- Operational ease: How effective and/or automated are start-up, back-up, and recovery procedures?
- Multiple sites: Was the application specifically designed, developed, and supported to be installed at multiple sites for multiple organizations?
- Facilitate change: Was the application specifically designed, developed, and supported to facilitate change?
Characteristics:
You are now ready to count Function Points
 - Count the components
 - Classify depending on complexity
 - Calculate the Value Adjustment Factor
A simple example on the difference between FP and LOC
| Assembly Version | Java Version | ||
|---|---|---|---|
| LOC | 1000 | 200 | Java is higher level and hence requires fewer LOC |
| FP | 5 | 5 | As the SW has the same features, FP are equal |
| Coding Effort | 2 months | 1.25 months | Using a higher level language helps to reduce times |
| Cost per month | $5,000 | $5,000 | The cost of the team per month is exactly the same |
| Cost | $10,000 | $6,250 | As the team spend less time, the cost was smaller |
| LOC per month | 500 | 160 | However, the number of LOC per month decreases |
| FP per month | 2.5 | 4 | While the number of FP per month grows |
| $ per LOC | $10 per LOC | $31.25 per LOC | The cost per LOC is higher... BUT it's not important |
| $ per FP | $2,000 per FP | $1,250 per FP | As the important thing is cost per functionality which reduces a lot |
After developing an assembly version of one software we want to move to a higher level programming language (Java). Please check the impact on the project figures:
Function Points Examples
Intrinsic End Product Metrics
End Product
In Process
Intrinsic
Customer
Quality Metrics
Intrinsic End Product Metrics
End Product
In Process
Intrinsic
Customer
Quality Metrics
Problems
Satisfaction
Actionable
Customer Problem Metrics
What if we want to measure the quality of the product from an end-user point of view?
What would be a good metric?
IDEAS?
User Problems
We should not talk about defects but about users' problems
What is a user problem?
User Problems
We should not talk about defects but about users' problems
What is a user problem?
- Usability problems.
- Unclear documentation or information.
- Duplicates of valid defects (defects that were reported by other customers and fixes were available but the current customers did not know of them).
- User errors.
Everything users perceive as a problem
User Problems
When counting user problems, the total count is going to be affected by the total number of users.
E.g. If 1million users, half of them report a similar problem, I have 500.000 users with a problem
Problem Density
Needs to take into account the amount of users... but also how long they have been using the product
Users-Months of usage.
1.000 users, using a product during 1 year are 12.000 users-month
(The software has been used during 12.000 months)
Problems per User Month
PUM =
Problems Reported
Months of usage
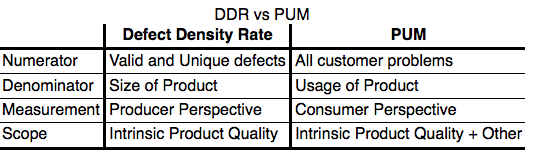
PUM vs. DD
DIFFERENCES BETWEEN PROBLEM USER-MONTH AND DEFECT DENSITY?
PUM vs. DD
CUSTOMER SATISFACTION METRICS
ASK DIRECTLY TO END-USERS:
CSAT (CUSTOMER SATISFACTION)
NPS (NET PROMOTER SCORE)
CES (CUSTOMER EFFORT SCORE)
...
CSAT
GUIDELINES
- AVOID ANY ASSUMPTIONS
- DON'T ASK ABOUT HYPOTHETICAL SITUATIONS
- USE CLEAR AND COMPREHENSIBLE LANGUAGE
- ASK ONLY NECESSARY QUESTIONS
- IF YOU NEED DETAILED INFO USE "HOW" QUESTIONS
Measure of how products and services supplied by a company meet or surpass customer expectations
CSAT: EXAMPLE


NET PROMOTER SCORE
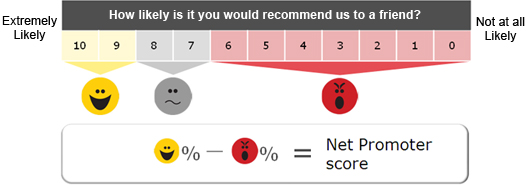
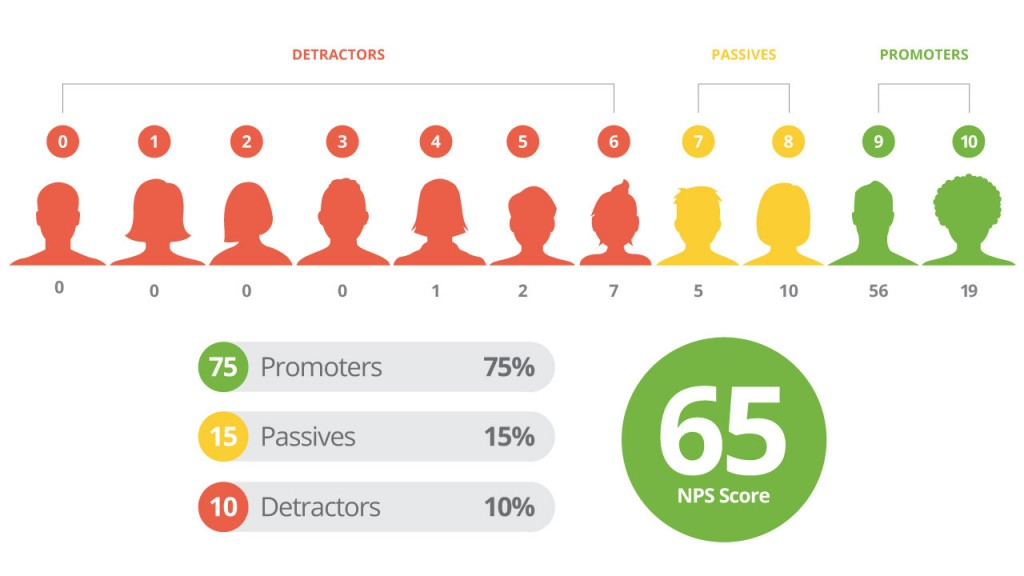
NET PROMOTER SCORE (EXAMPLE)

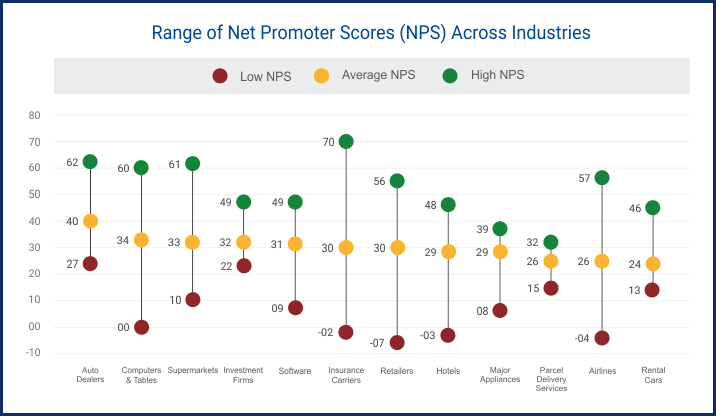
NET PROMOTER SCORE VS. INDUSTRIES
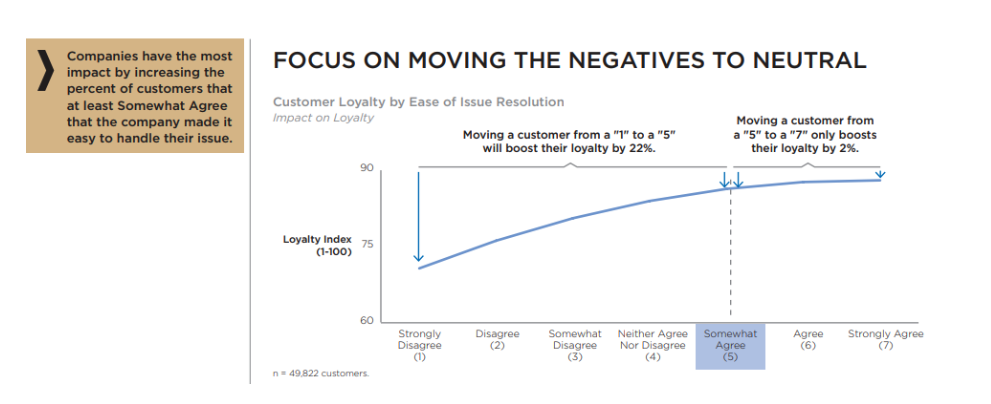
CUSTOMER EFFORT SCORE
SCALE:
1 - Strongly Disagree
2 - Disagree
3 - Somewhat Disagree
4 - Neither Agree nor Disagree
5 - Somewhat Agree
6 - Agree
7 - Strongly Agree
Measures the level of difficulty customers experience when using a product
CSAT: Tracks overall customer happiness
NPS: Tracks how loyal are your customers
CES: Tracks how easy is being a customer
CUSTOMER SATISFACTION METRICS: SUMMARY
Q: Are you making your product better?
A: Yes
Q: How do you know?
A: ...
ACTIONABLE METRICS
Typical answer: we've made many changes during the last month, our customers seem to like them and our overall numbers are higher this month...
VANITY METRICS (CAUTION)
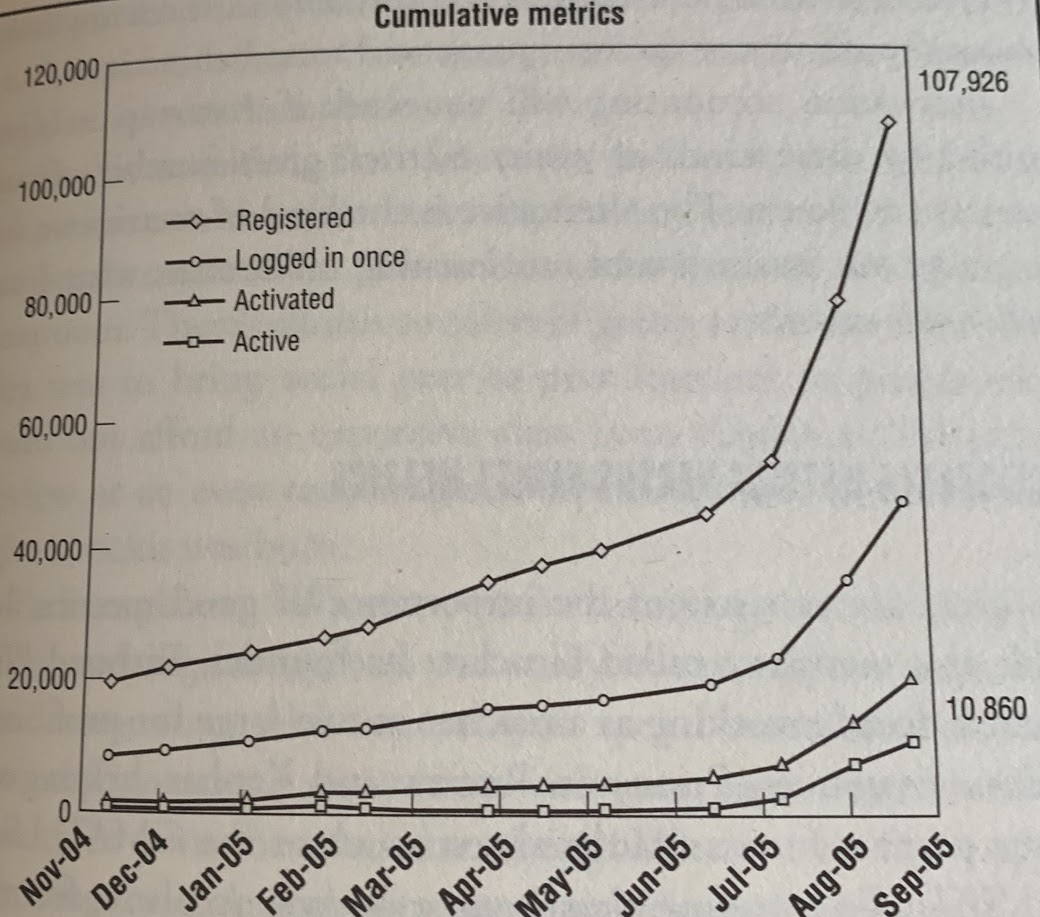
Real Project graphics. Start-up running for about 2 years and getting significant funding.
Everything looks great, every month there are more customers. Right?
Let's look at the data from a different Point of View...
COHORT ANALYISIS
Don't look to total numbers (to avoid vanity metrics) but check the "performance" of each group of customers that comes into contact with the product independently (group = cohort)
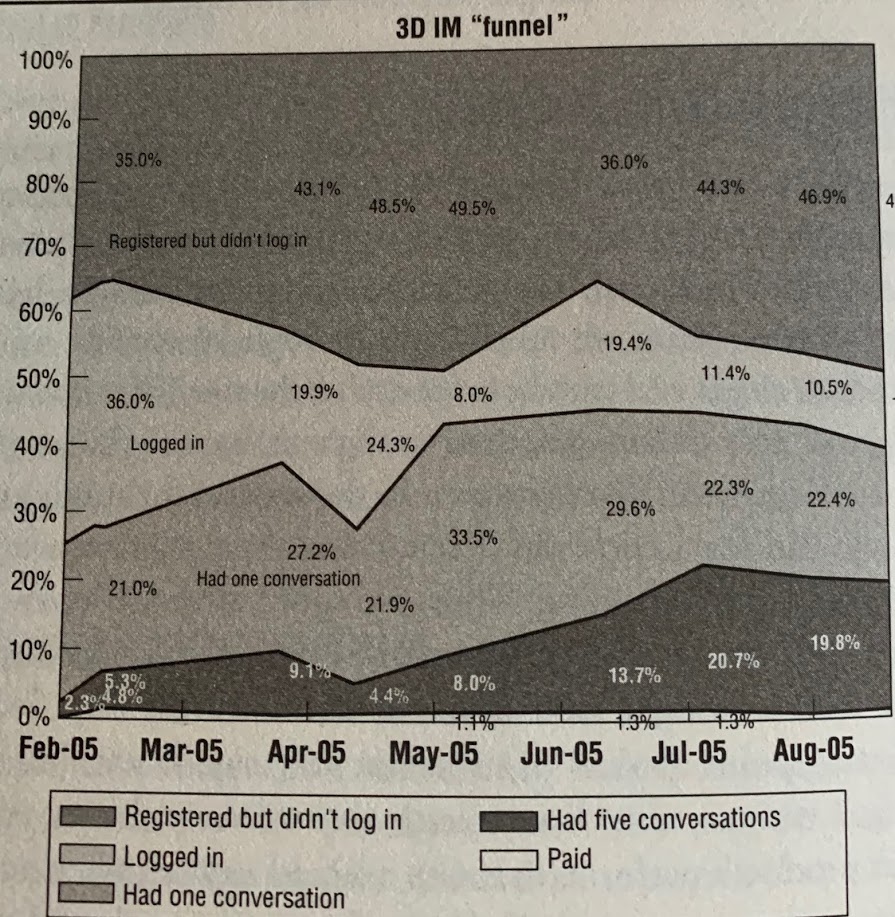
COHORT ANALYSIS: THE TRUTH
After months of work, investment, improvements, new features, the percentage of new customers who subsequently pay money is exactly the same as in the beginning, even though we have more users using our product...
COHORT AND SPLIT TESTS
- Every feature added to a product should be based on a hypothesis. The product should not only include the feature functionality, but a way to gather enough information to check if the hypothesis was true.
- When the feature is deployed, we can get the metrics and check if the hypothesis was right or not.
- This is typically combined with split test or A/B testing to compare cohorts with and without that feature.
COHORT AND SPLIT TESTS
HANDS-ON WORK. FIREBASE AND GOOGLE ANALYTICS
FIREBASE HOSTING
STEP 1. CREATE A FIREBASE ACCOUNT
https://firebase.google.com/

STEP 2. ADD A NEW PROJECT STEP

STEP 3. ENABLE HOSTING STEP

STEP 4. FOLLOW THE INSTRUCTIONS TO CONFIGURE THE ENV
STEP 5. DEPLOY THE DEFAULT PAGES
ADD GOOGLE ANALYTICS TO YOUR WEBSITE
STEP 1. CREATE A GOOGLE ANALYTICS ACCOUNT

STEP 2. ADD A NEW PROPERTY (INCLUDING THE DOMAIN)

STEP 3. GET THE CODE TO BE ADDED TO YOUR WEBSITE

STEP 4. INSERT IT INTO YOUR WEBPAGES

STEP 5. DEPLOY THE NEW VERSION
USING GOOGLE ANALYTICS
MONITOR REAL-TIME INFORMATION

GET INFORMATION ABOUT YOUR AUDIENCE: TIMES, VISITED PAGES, FLOWS, ORIGINGS...

CREATING GOALS

CREATING EXPERIMENTS (A/B TESTING)
In Process Quality Metrics
End Product
In Process
Intrinsic
Customer
Quality Metrics
In Process Quality Metrics
Calculated during the development of the product
Most of them are based on:
a/ the number of defects detected
b/ when are they detected
c/ when are they fixed
Defect Density after a development/testing cycle
Calculate the Defect Density of the non-final product after a development cycle (e.g. iteration, sprint, etc.) or after a testing cycle (e.g. integration testing)
Keep track of the evolution of this metric over the different cycles: E.g. is the metric getting better or worse in every sprint?
Defect Density after a development/testing cycle
Purpose: get an indication of the potential Defect Density of the final product when it's on the field
Why do you think it's important to get that indication?
Myers suggested a counter-intuitive principle that the more defects found during testing, the more defects will be found later: Positive correlation between defect rates during development/testing and on the field.
In general, we could try to identify patterns in the evolution of the Defect Density
Defect Density after a development/testing cycle
Example A
Example B
Defect Density after a development/testing cycle
Defect Density after a development/testing cycle
But... can you think of any reason for detecting more defects but not because the software is getting worse?
Defect Density after a development/testing cycle
The defect rate is same or lower that on previous iteration (or a similar product). But has been testing worse?
YES
NO
The defect rate is higher than previous iteration. But, did we plan to test more thoroughly?
YES
NO
Defect Arrival Pattern
Although the previous metric is useful, is not enough to understand the progress of the development team:
1 - Because it's a discrete function: we only measure it after an iteration
2 - Because as any Defect Density, it tends to improve as the product matures: when fewer features are introduced, fewer defects are injected and hence can be fixed faster (fixed defects are not counted in Defect Density)
We use the Defect Arrival Pattern to complement the Defect Density.
What do you think it's the defect arrival pattern?
Defect Arrival Pattern
DAP: Distribution of the defects detected over the time
There are two ways to represent it: Rate or Cumulative
Rate
Day1
Day2
Day3
Day4
Day5
Day6
Day7
2
4
5
5
3
4
4
Defects
Day1
Day2
Day3
Day4
Day5
Day6
Day7
2
6
11
16
19
23
27
Time
Time
Defects / day
Defects
Defect Arrival Pattern: Example
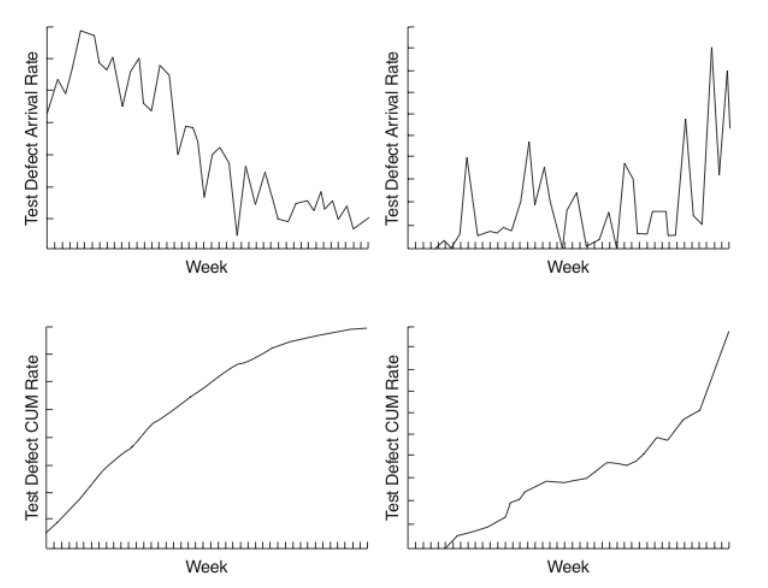
Imagine this was part of a single iteration. Which one would have the best Defect Density?
Defect Arrival Pattern: Variations
Valid/All Defects: We could count all the defects reported or only those that have confirmed as valid
Defect Severity: Maybe we are just interested in the critical/major defects
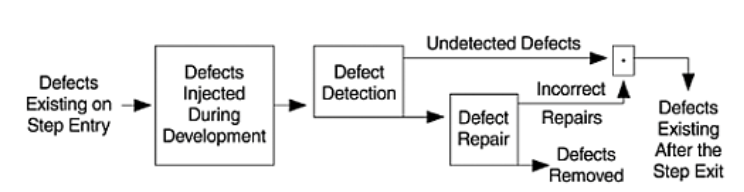
Defect Removal Metrics
So far, we have talked about metrics related to the defects that I have detected.
Not all the defects that are detected can be immediately removed: Remember that a defect is just the visible symptom of something that needs to be fixed. But in order to do so, many actions must be done:
- Is it a valid defect?
- What is the root behind the defect?
- How complicated is to fix it?
- By fixing it, am I breaking other functionalities?
....
Can you think on some metrics to take this into account?
Defect Removal Pattern
It describes the distribution of removed defects over time.
It can be done per-unit-of-time or per-iteration.
But this metric in an isolated way it's quite useless. There are some additional ones that complement it:
- Average time to fix a defect
- Average time to detect a defect
Remember that the cost of a defect is higher, the later we find it and the later we fix it
Defect Backlog / Burdown
A burn-down chart is a graphical representation of work left to do vs. time
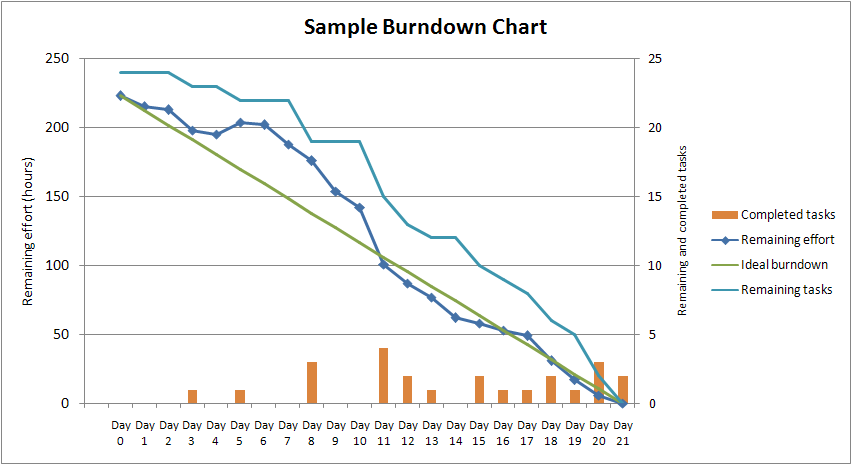
Typical Agile Burn-down chart
Defect Backlog / Burdown
work left: number of defects remaining that
can go up (new defect found) or go down (defect fixed)

Defect Backlog / Burdown
In an ideal world, before releasing a product both curves should be at the same point. What can we do to make it happen?
Defect Backlog / Burdown
In an ideal world, before releasing a product both curves should be at the same point. What can we do to make it happen?
- Reduce time to fix defects: more resources
- Inject fewer defects by stop adding features at some point and preventing any regression because of fixes. In some cases, this could mean reduce product scope.
- Spend more time removing defects
- Reduce the criticality of defects to be fixed at some point of time. This has two effects:
- Reduces the number of defects
- Reduces the opportunity for bad fixes / regressions
In summary, the classic quality, scope, time, resources dilemma
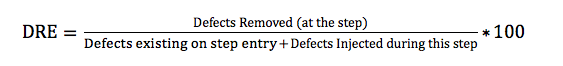
Defect Removal Effectiveness
Measures how good my process is with respect to detect and remove defects: "How many defects I have removed from the potential list of defects that I could have removed?"
This question could be asked globally or in any phase/iteration.
Trying to be more formal:
- DRE = (Defects Removed / Defects Latent)*100 %
where Defects Latent = Defects Removed + Defects Found Later
Defect Removal Effectiveness
An example
For instance, during the development a product I detected and fixed 80 defects. When the product hit the market, 20 additional defects were discovered.
DRE = Defects Found / Latent Defects = 80 / (80+20) = 80%
In average, I have removed 80 of every 100 defects I injected.
Defect Removal Effectiveness:
Another view
Defect Removal Effectiveness:
Another example
| IT1 | IT2 | IT3 | IT4 | TOTAL REMOVED | |
|---|---|---|---|---|---|
| IT1 | 5 | 5 | |||
| IT2 | 10 | 15 | 25 | ||
| IT3 | 5 | 5 | 10 | 20 | |
| IT4 | 5 | 5 | 0 | 5 | 15 |
| TOTAL INJECTED | 25 | 25 | 10 | 5 | 65 |
During It1 25 defects were injected. 5 of them were fixed during the same iteration, 10 in It2, 5 in It3 and 5 in It4.
During It4 15 defects were removed. 5 of them were introduced in It1, 5 in It2 and 5 in It4.
What is the DRE of all the phases?
Defect Removal Effectiveness:
Another example
| IT1 | IT2 | IT3 | IT4 | TOTAL REMOVED | |
|---|---|---|---|---|---|
| IT1 | 5 | 5 | |||
| IT2 | 10 | 15 | 25 | ||
| IT3 | 5 | 5 | 10 | 20 | |
| IT4 | 5 | 5 | 0 | 5 | 15 |
| TOTAL INJECTED | 25 | 25 | 10 | 5 | 65 |
During It1 25 defects were injected. 5 of them were fixed during the same iteration, 10 in It2, 5 in It3 and 5 in It4.
During It4 15 defects were removed. 5 of them were introduced in It1, 5 in It2 and 5 in It4.
DRE-IT1 = 5 / 25 = 20%
DRE-IT2 = 25 / (25+25) - 5 = 25 /45 = 55%
DRE-IT3 = 20 / (25+25+10) - 5 - 25 = 20 / 30 = 66%
DRE-IT4 = 15 / (25+25+10+5) - 5 - 25 - 20 = 15/15 = 100%
DRE = 65 / 65 = 100%
Defect Removal Effectiveness:
Another example
| IT1 | IT2 | IT3 | IT4 | TOTAL REMOVED | |
|---|---|---|---|---|---|
| IT1 | 2 | 2 | |||
| IT2 | 2 | 3 | 5 | ||
| IT3 | 4 |
2 |
4 |
10 | |
| IT4 | 2 |
1 |
2 |
3 |
8 |
| ON THE FIELD | 2 | 1 | 1 | 1 | 5 |
| TOTAL INJECTED | 12 | 7 | 7 | 4 | 30 |
During It1 12 defects were injected. 2 of them fixed in It1, 2 in It2, 4 in It3, and 2 in It4. 2 were only discovered on the field.
During It4 8 defects were removed. 2 of them were introduced in It1, 1 in It2, It3, It4.
What is the DRE of all the phases?
On the field we discovered 5 remaining defects that were introduced: 2 in It1 and 1 in It2, It3, It4.
Defect Removal Effectiveness:
Another example
| IT1 | IT2 | IT3 | IT4 | TOTAL REMOVED | |
|---|---|---|---|---|---|
| IT1 | 2 | 2 | |||
| IT2 | 2 | 3 | 5 | ||
| IT3 | 4 |
2 |
4 |
10 | |
| IT4 | 2 |
1 |
2 |
3 |
8 |
| ON THE FIELD | 2 | 1 | 1 | 1 | 5 |
| TOTAL INJECTED | 12 | 7 | 7 | 4 | 30 |
During It1 25 defects were injected. 2 of them fixed in It1, 2 in It2, 4 in It3, and 2 in It4. 2 were only discovered on the field.
During It4 8 defects were removed. 2 of them were introduced in It1, 1 in It2, It3, It4.
On the field we discovered 5 remaining defects that were introduced: 2 in It1 and 1 in It2, It3, It4.
DRE-IT1 = 2 / 12 = 16.67%
DRE-IT2 = 5 / (12+7) - 2 = 5 / 17 = 29.41%
DRE-IT3 = 10 / (12+7+7) - 2 - 5 = 10 / 19 = 52.63%
DRE-IT4 = 8 / (12+7+7+4) - 2 -5 - 10 = 8 / 13 = 61.54%
DRE = 2+5+10+8 / 12+7+7+4 = 25/30 = 83.33%
Defect Removal Effectiveness
Injecting vs. Removing defects
Software Metrics vs. Quality Metrics
We have been discussing so far Quality Metrics, but it's interesting to check some Software Metrics because, as we studied in Unit 1, internal quality affects external quality:
Internal Software Metrics can affect External Quality Metrics in the long-term
Software Metrics vs. Quality Metrics
Quality is linked to Size, Control Flow Complexity, Complexity, Understandability, Testability
There are some Software metrics that are linked to them: Average method size, Cyclomatic Number, Average Number of methods/instance variables per class, nesting level, Number of classes/relationships within in a module or outside of the module...
Understanding the relationship between them is critical
Examples
Cyclomatic Complexity
This metric measures the complexity of the control flow graph of a method or procedure
High Value: High Complexity, difficult to test and maintain
Examples
WMC: Weighted Methods per Class
This metric measures the complexity of a class. Class complexity can be calculated using the cylomatic complexity of every method
High value of WMC indicates the class is more complex and hence difficult to maintain
Examples
DIT: Depth of Inheritance Tree
It measures the maximum level of the inheritance hierarchy of a class
If DIT increases, it means that more methods are to be expected to be inherited, which makes it more difficult to calculate a class’s behavior. Thus it can be hard to understand a system with many inheritance layers.
Examples
NOC: Number of Children
how many sub-classes are going to inherit the methods of the parent class
If NOC grows it means reuse increases. On the other hand, as NOC increases, the amount of testing will also increase because more children in a class indicate more responsibility
Software Metrics
Most of these metrics (and many others) can be calculated using static analysis tools
What to do if metrics are bad?
REFACTOR YOUR CODE...
YOU SHOULD ALSO REFACTOR IF YOU DETECT OTHER ISSUES, E.G. DUPLICATED CODE, SHOTGUN SURGERY, ETC.
SOME OF THESE ISSUES CAN BE ALSO SPOTTED WITH TOOLS (E.G. DUPLICATED TOOLS)
UNIT 2
By Daniel Coloma