Postprocessing Neuroimaging methods in MRI and PET/MRI
with applications to Multiple Sclerosis and other Neurological diseases
Candidate: D. Poggiali
Supervisor: Prof.ssa E. Pegoraro
Cosupervisor: Prof. P. Gallo

Summary:
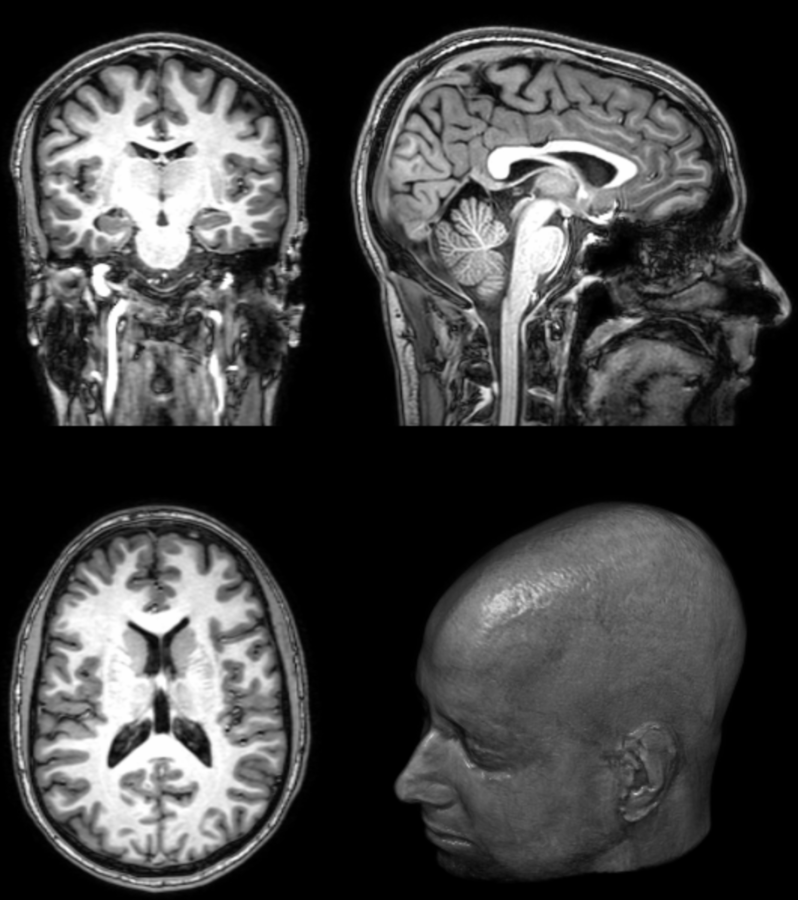
- Introduction to Neuroimaging
- State of the art algorithms and pipelines
- Glucose PET/MRI in MS
- Amyloid PET/MRI in AD
1. Introduction
A modern neurological study aims to relate several biomarkers from different sources in order to explain the illness evolution improve prognostic accuracy and optimize the treatment.
A modern research group can have at disposal:
- clinical,
- imaging,
- neuropsychological,
- liquor biomarkers
2. State of the art
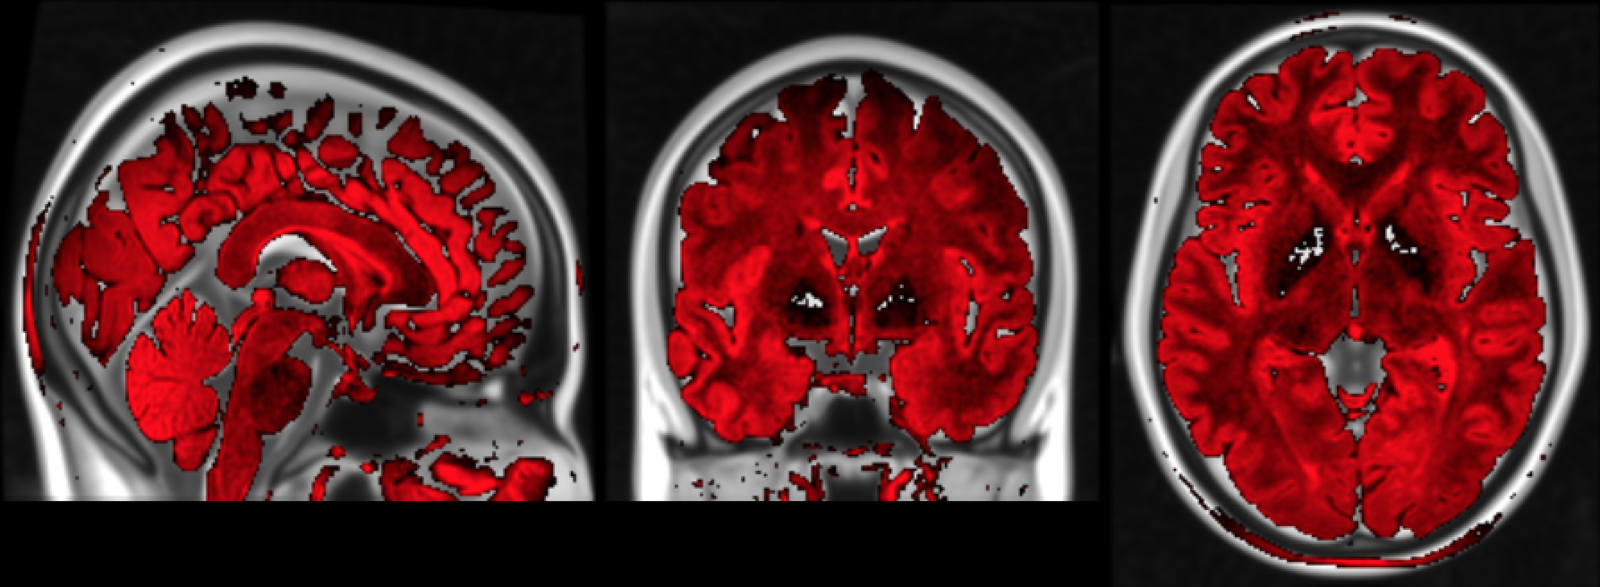
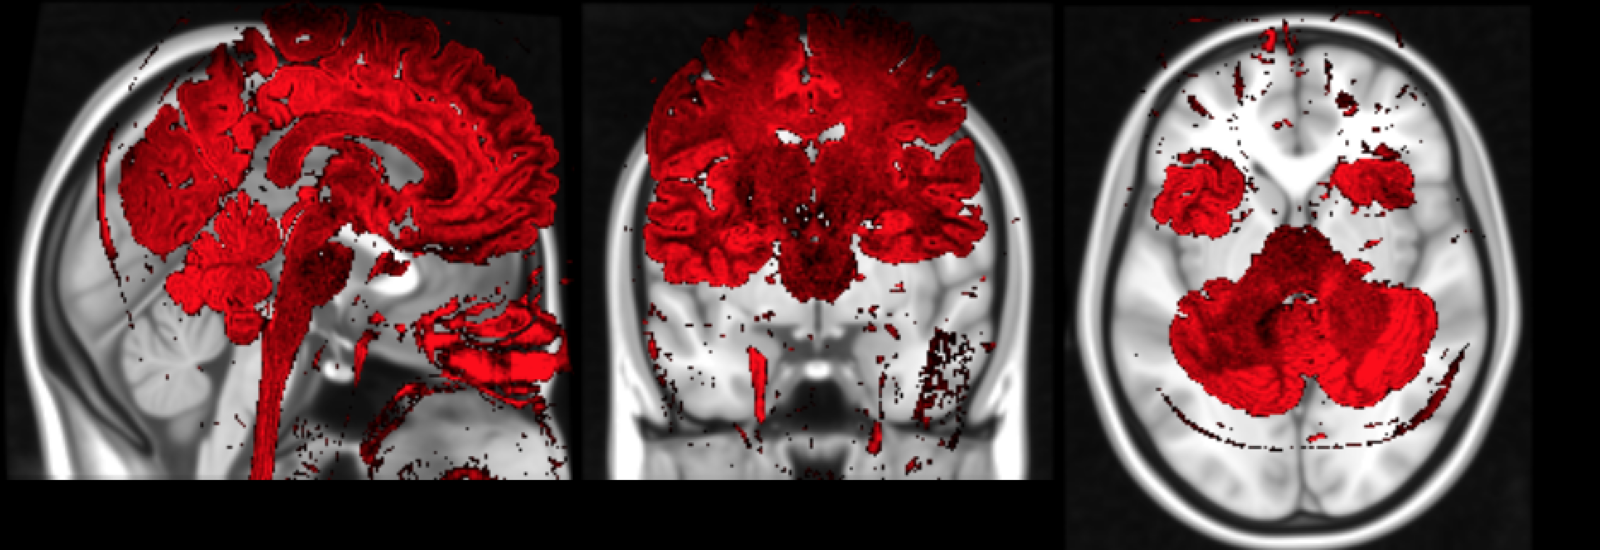
1. Registration (rigid, affine, nonlinear)
2. Correction (Bias Field, Lesion Filling,
Motion Correction, PVC)
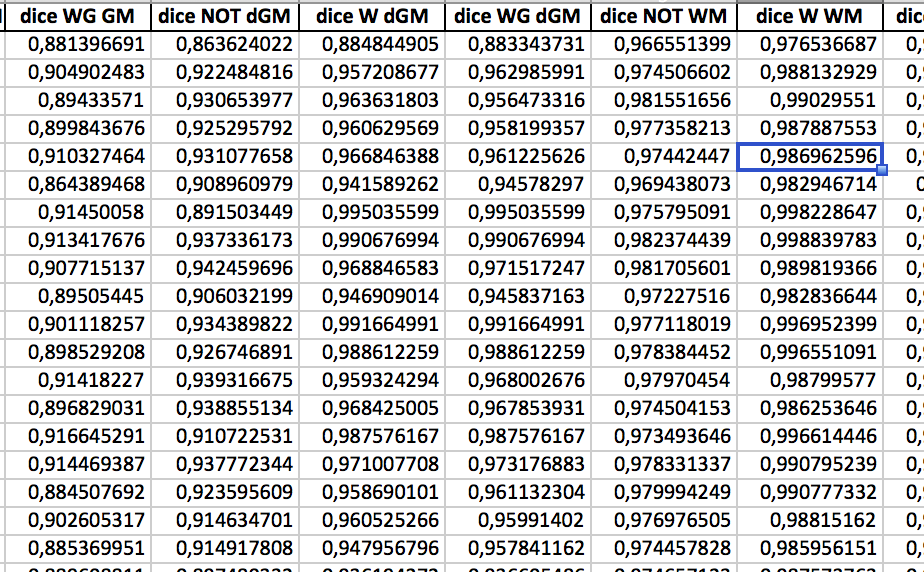
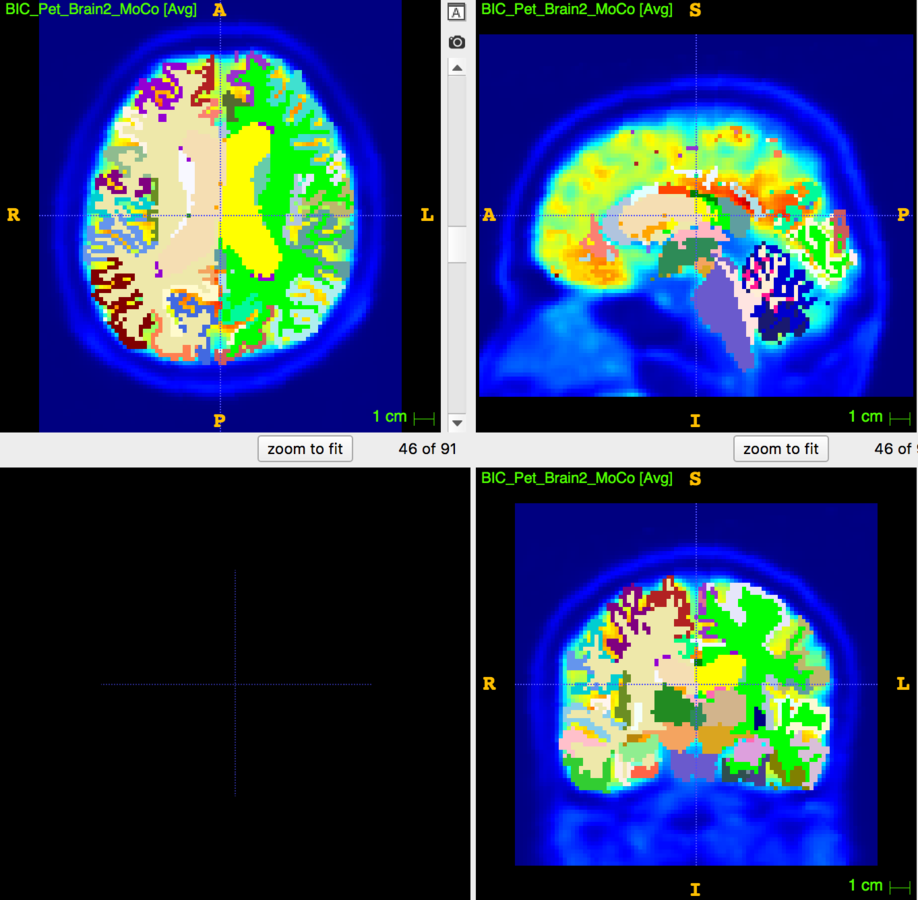
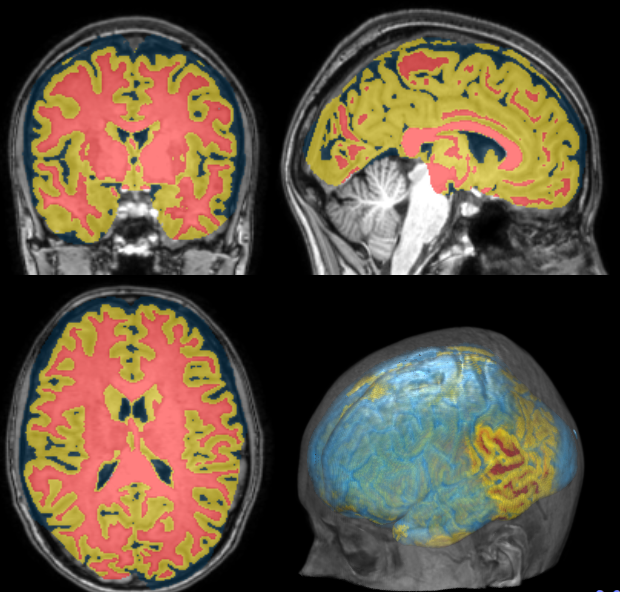
3. Segmentation (Manual, Template-based)
4. Measurement (mean, std over VOIs)
Registration
Correction
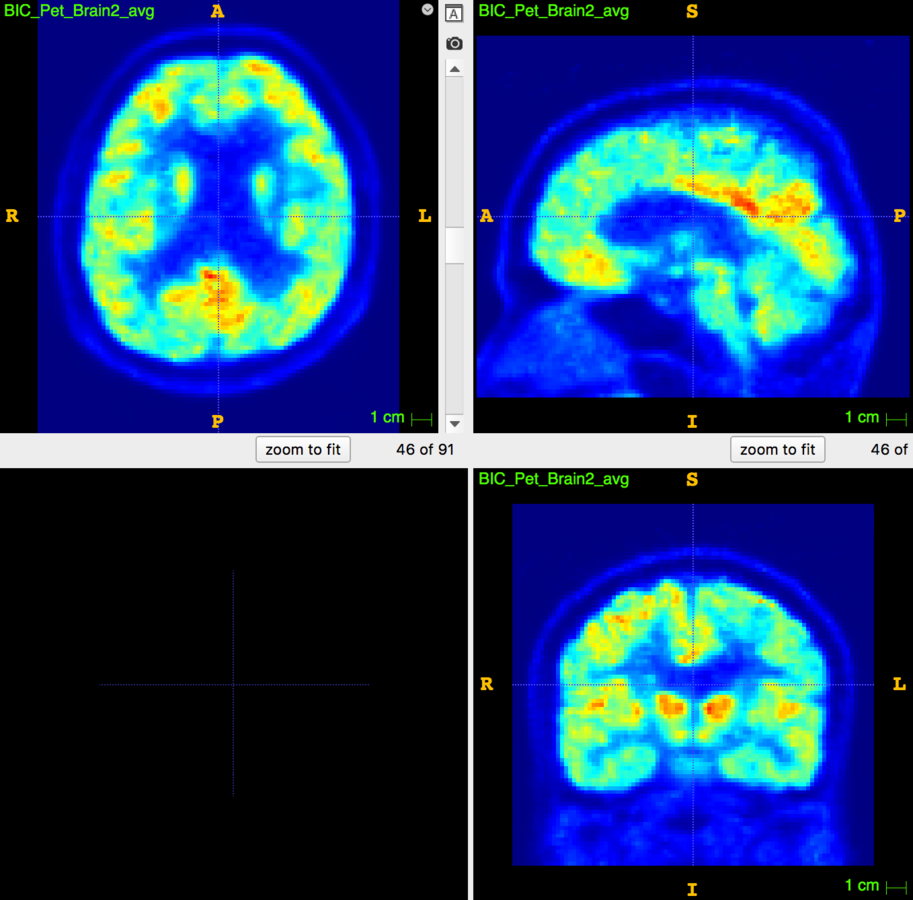
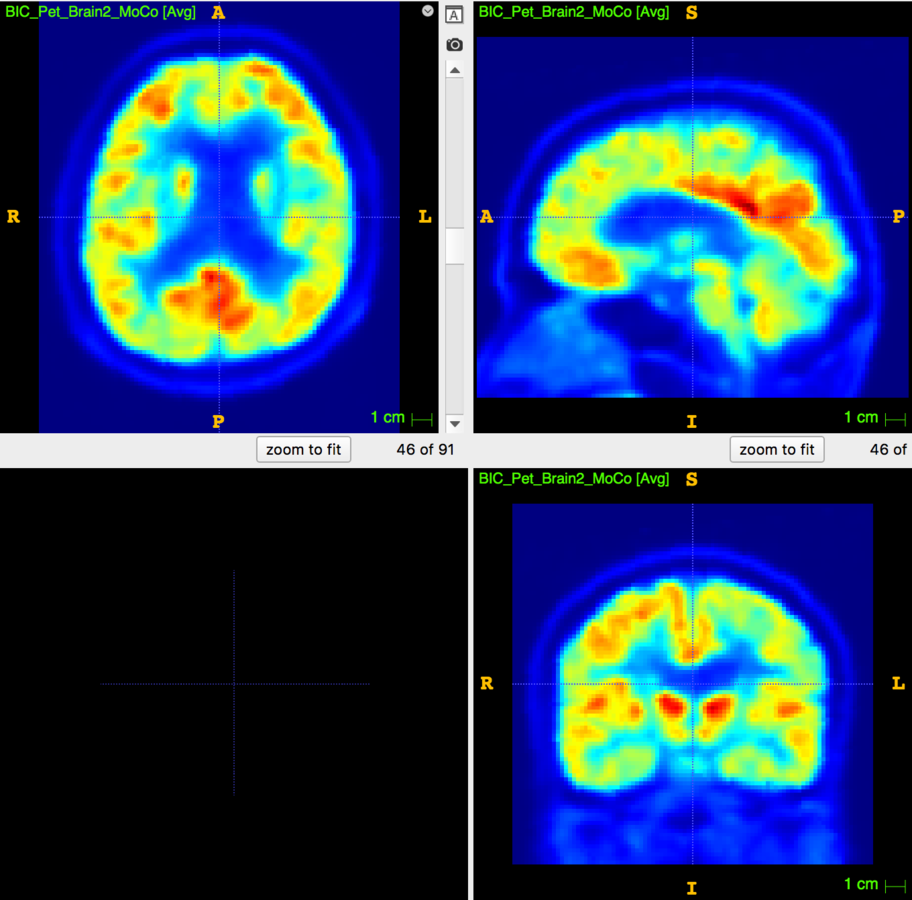
Motion Correction
Correction
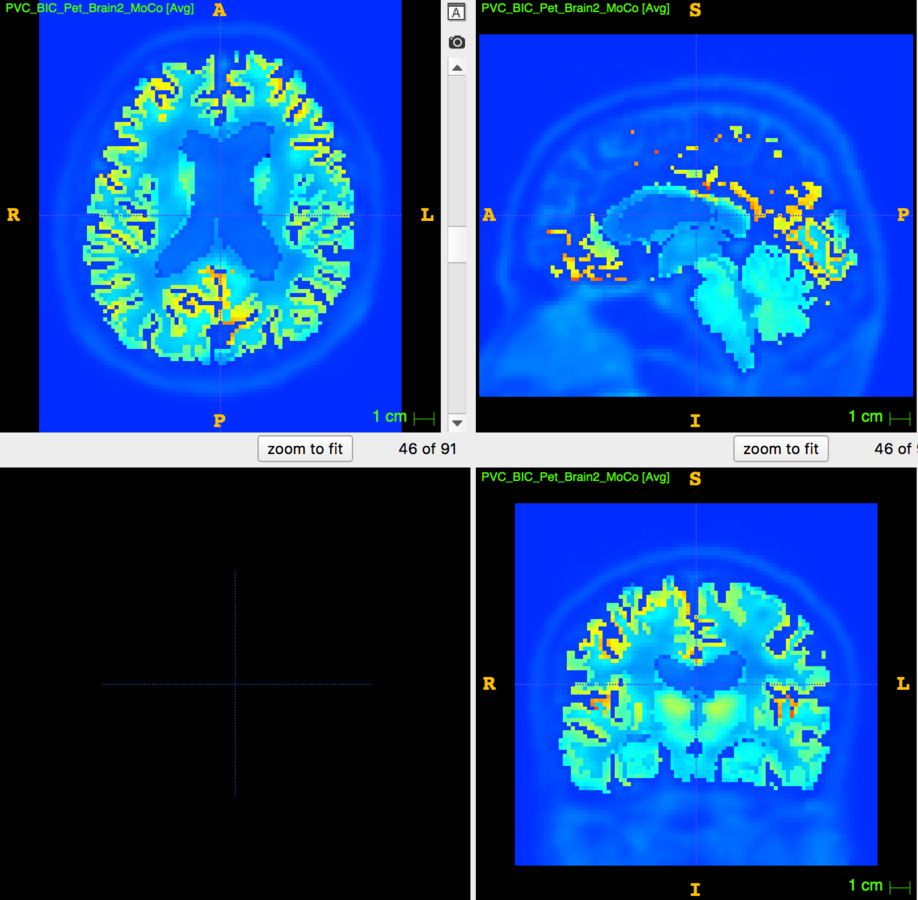
Partial Volume Correction
Segmentation

Measurements
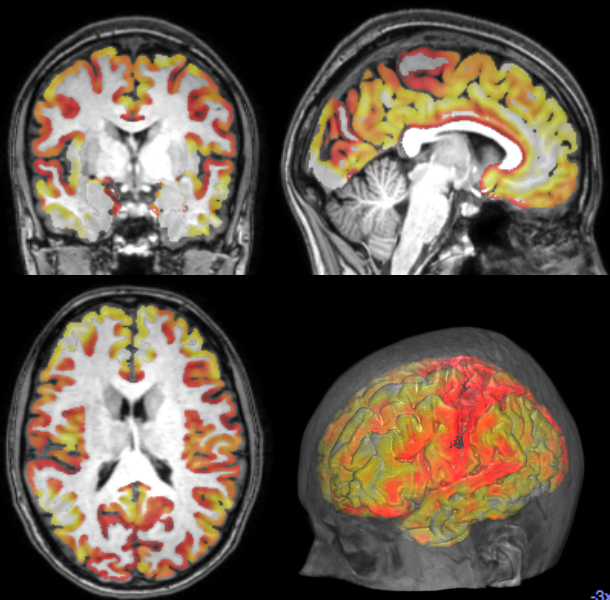
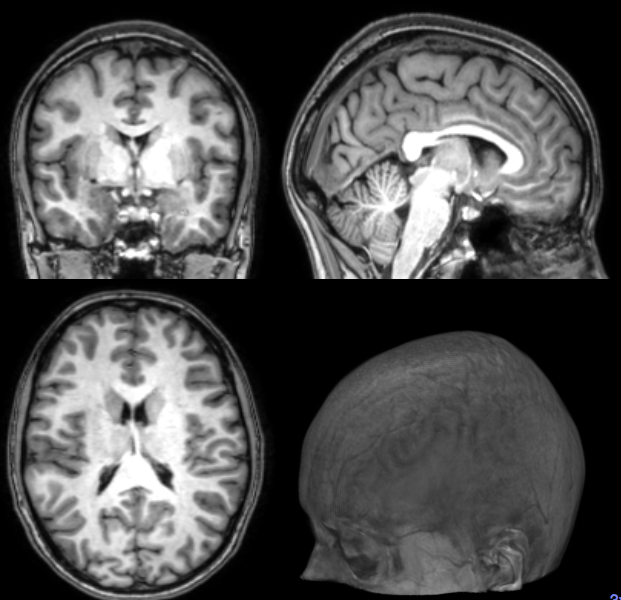
Cortical Thickness Estimation
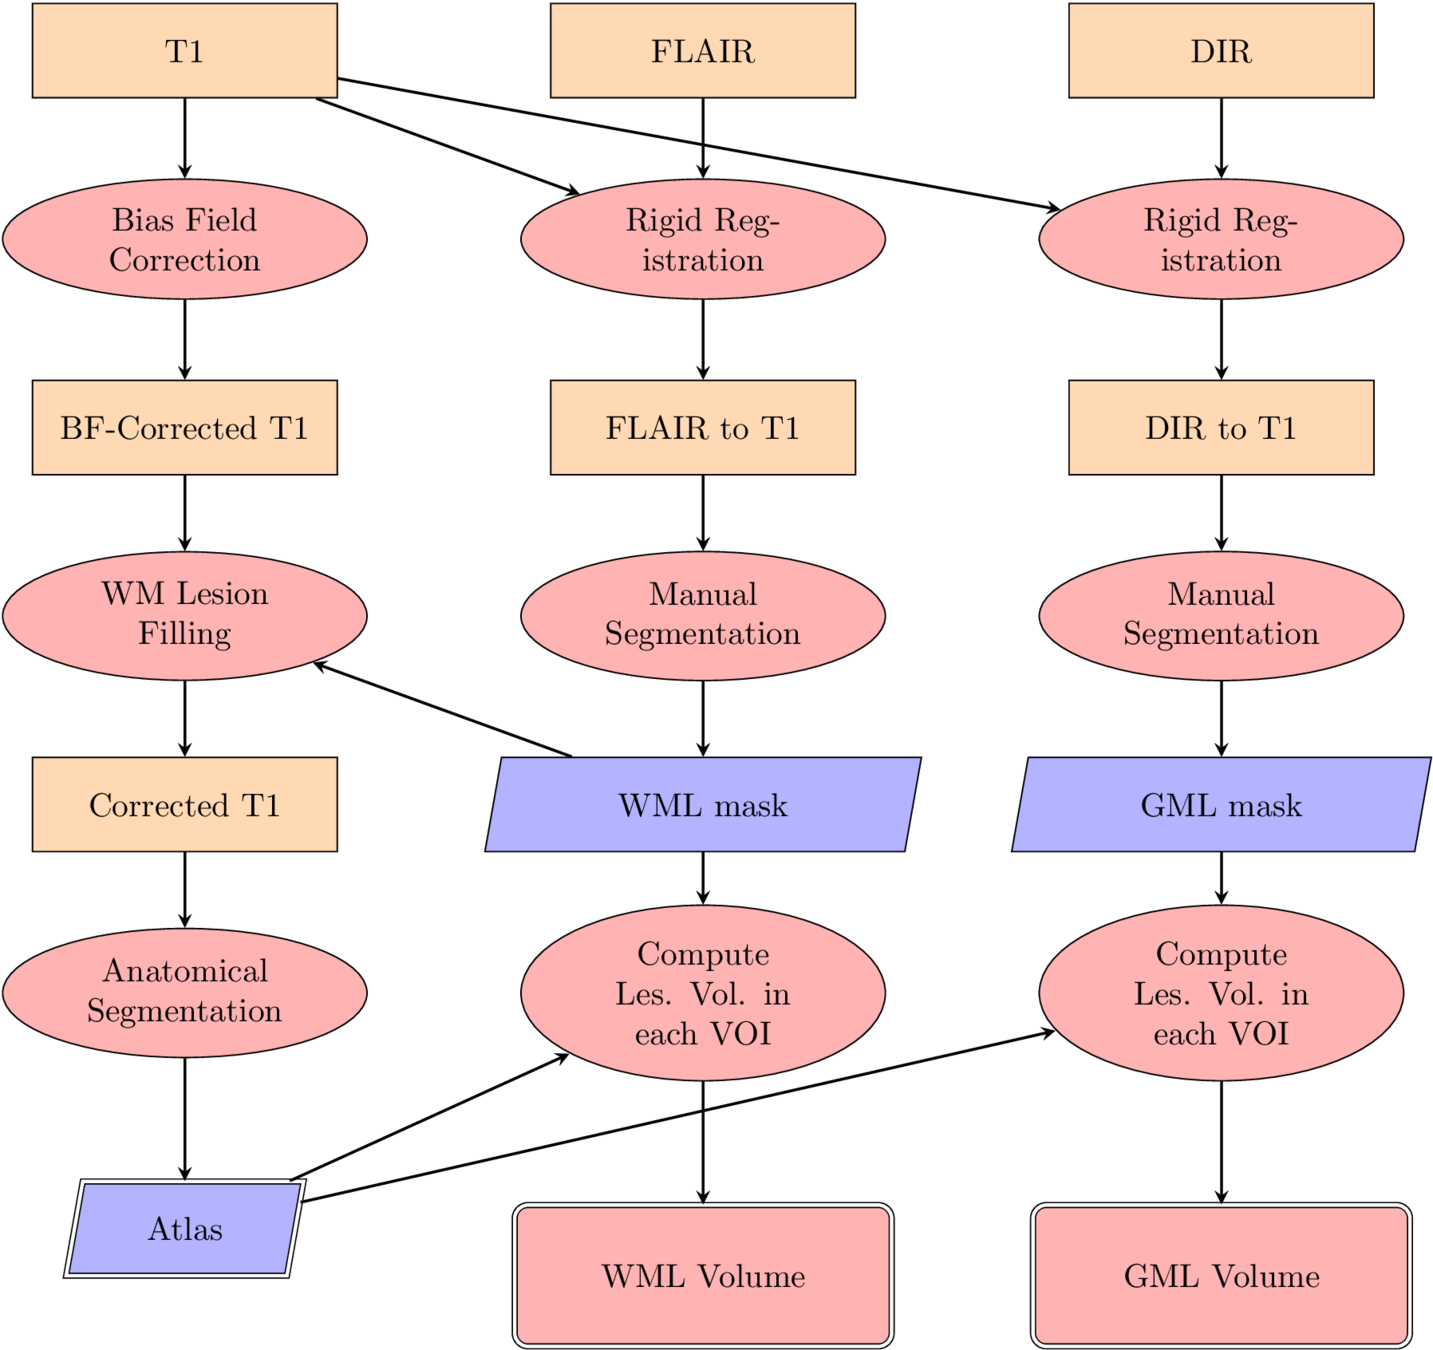
Pipelining
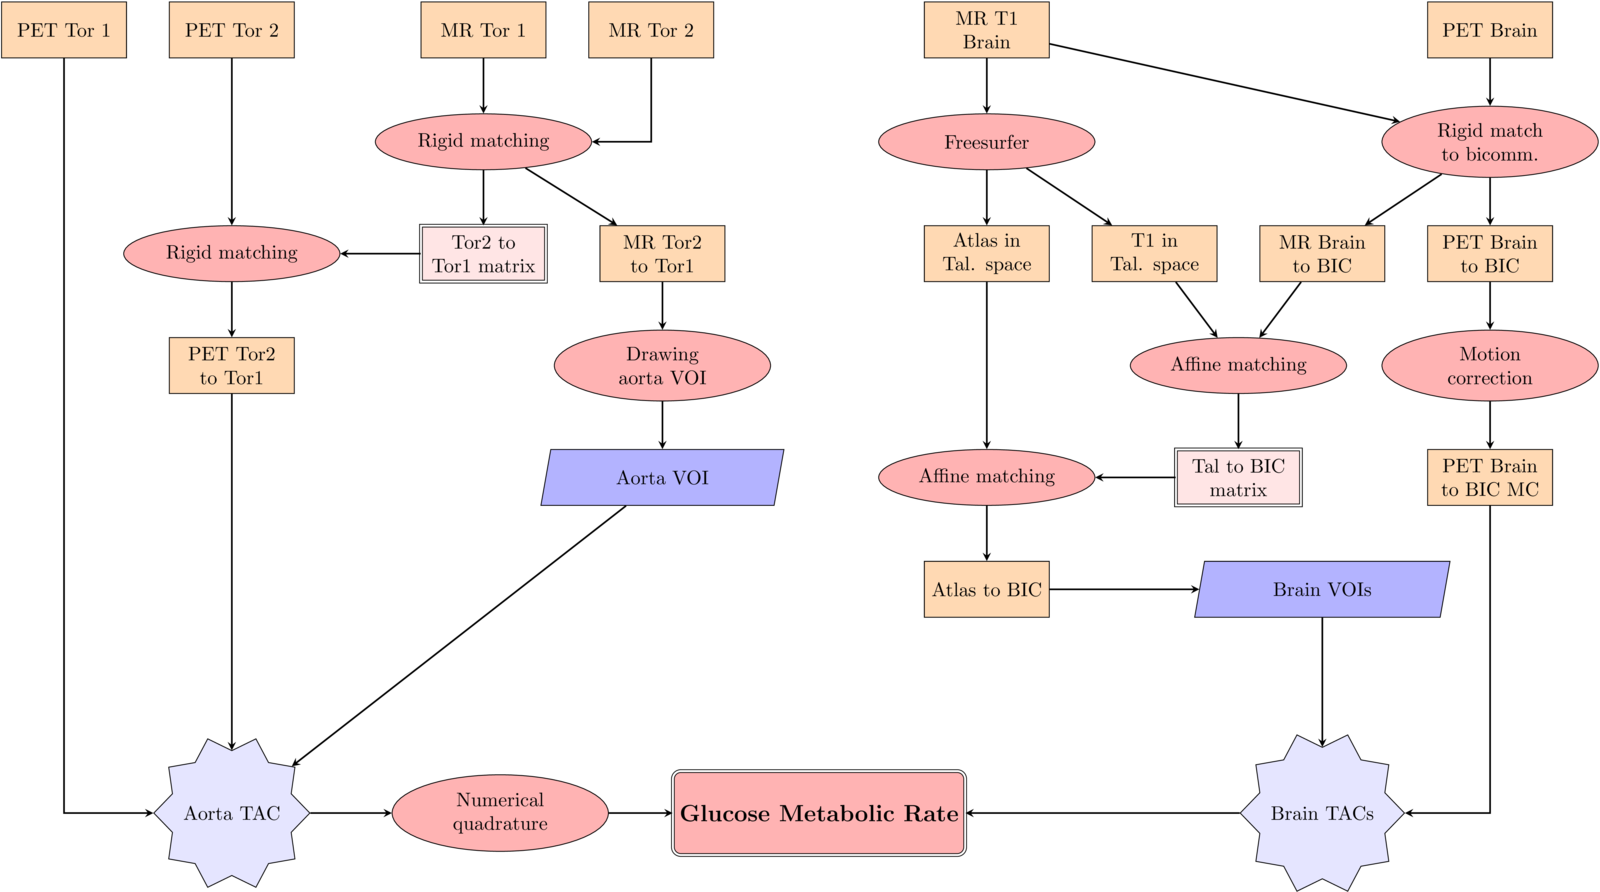
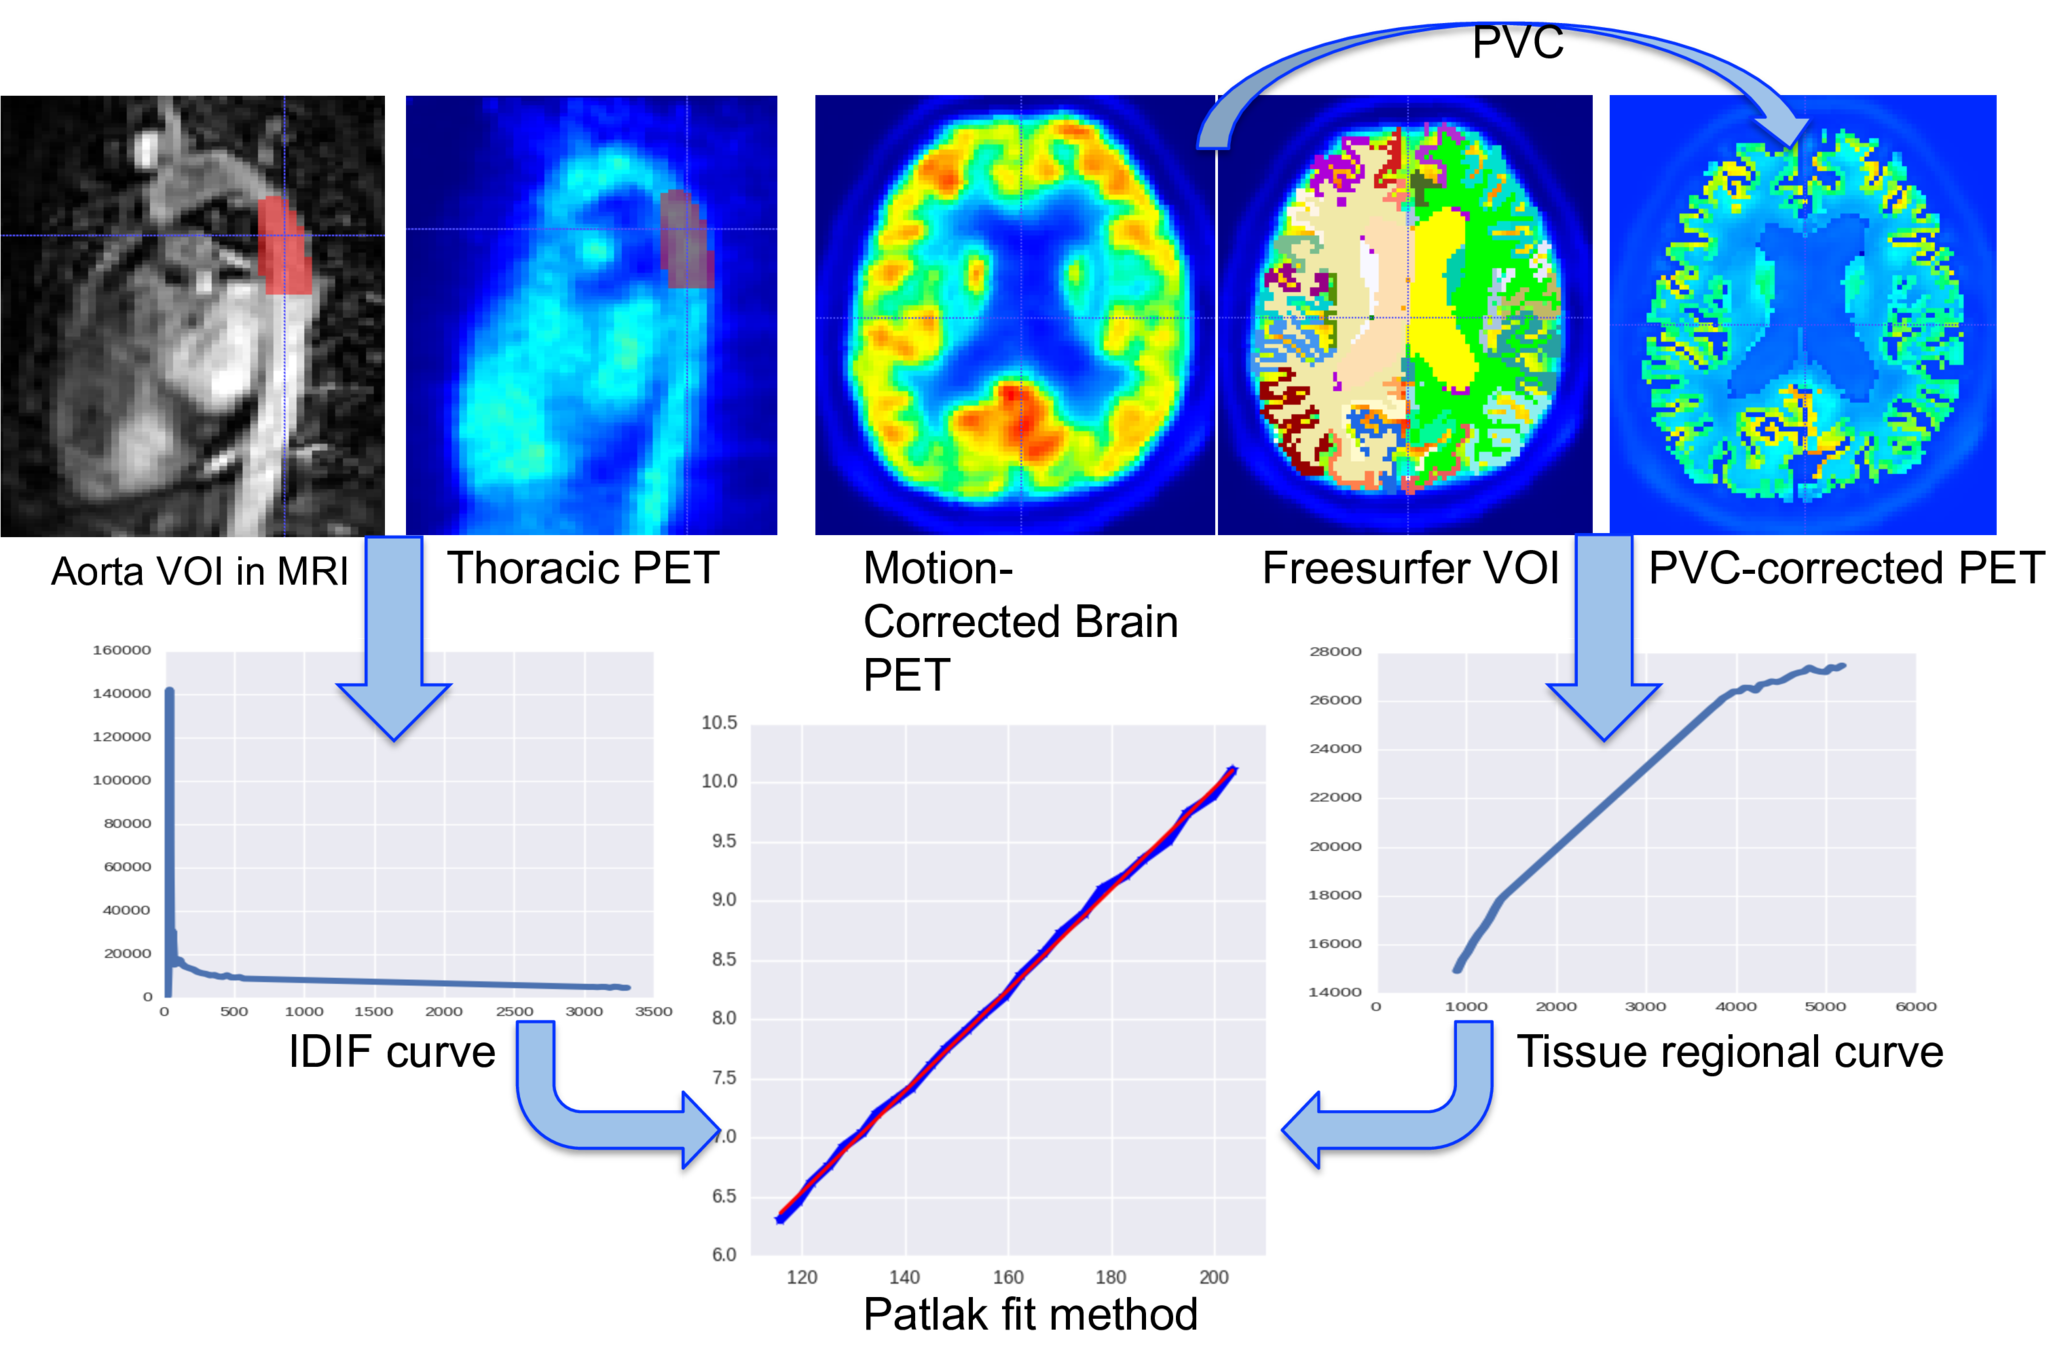
4. Glucose PET/MRI in MS
29 patients, 14 CIS/eRRMS and 15 RRMS underwent a PET/MRI with:
- MRI sequences: 3D T1, 3D FLAIR, 3D DIR
- 18F-Fdg PET in list-mode
The aim is to study the relationship between:
- Cortical Thickness
- WM/GM lesion number/volume
- aMRGlu
Results:
CIS/eRRMS differed significantly:
- 0/66 cortical areas in CTh
- 33/66 cortical areas in aMRGlu
- 10/66 cortical areas lesion Number
- 10/66 cortical areas lesion Volume
No correlation was demonstrated between CTh and WM and GM lesion load
No correlation was found between global and regional aMRglu and CTh.
aMRglu correlated with lesion load
Inverse correlation was found between:
- the total number of focal lesions (WM+GM lesions) and the global cortical aMRglu (R=-0.36 e p=0.04)
- WM lesion volume and number and cortical global aMRglu (R=-0.4 and p=0.02 for both)
-
GM lesion number with global aMRglu (R=-0.36, p=0.046)

p<0,01
p=0,18
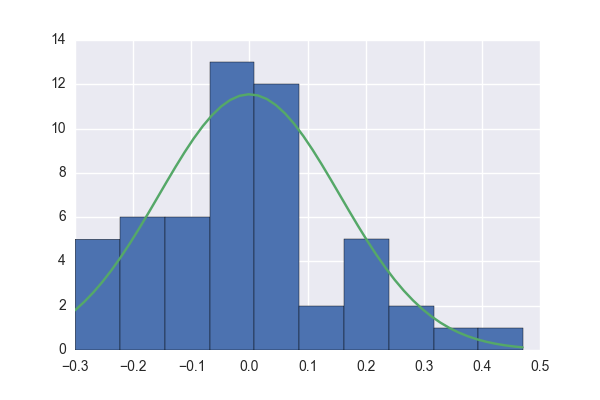
Histograms of aMRGlu values
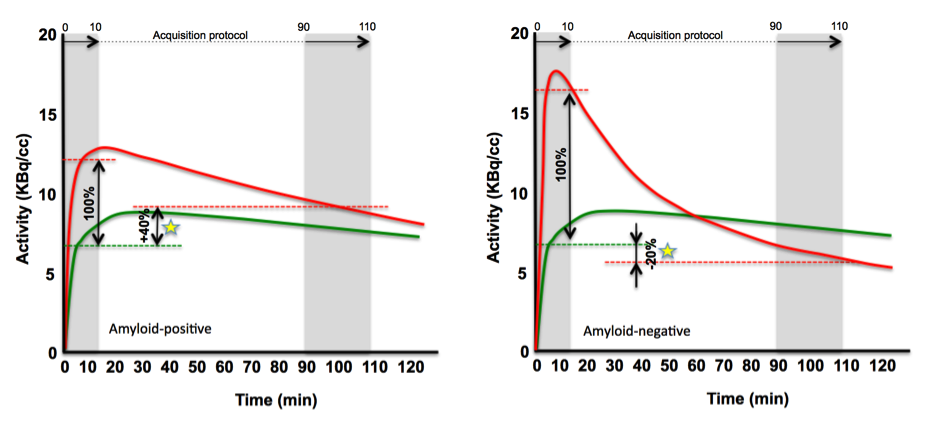
5. Amyloid PET/MRI in AD
86 cases (53 rated negatively and 33 positively by expert amyloid readers) of 18F-Fluorbetaben PET/MRI.
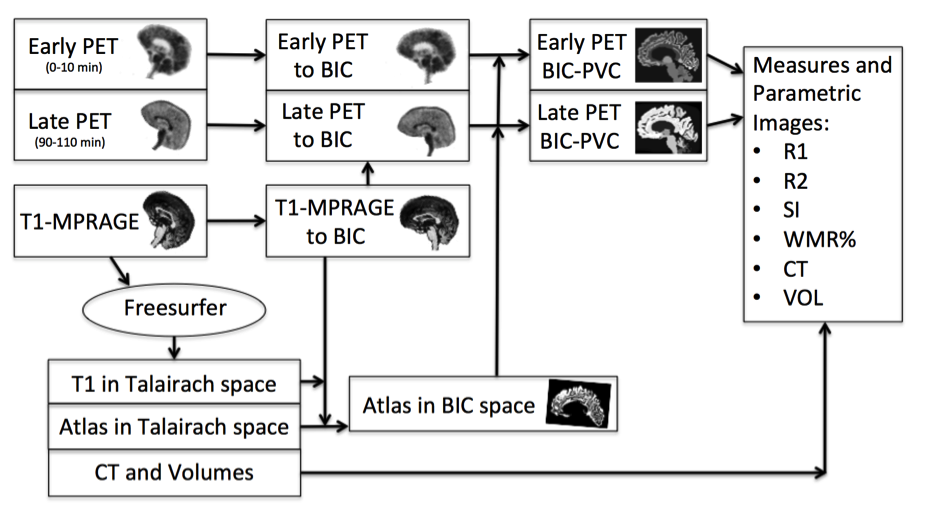
\begin{array}{c}
R_1=\frac{PET_1}{PET_1(Cerebcortex)}\\
\\
R_2=\frac{PET_2}{PET_2(Cerebcortex)}\\
\\
SI = R_2- R_1\\
\\
WMR = 100 \frac{PET_2-PET_2(WM)}{PET_1-PET_1(WM)}
\end{array}
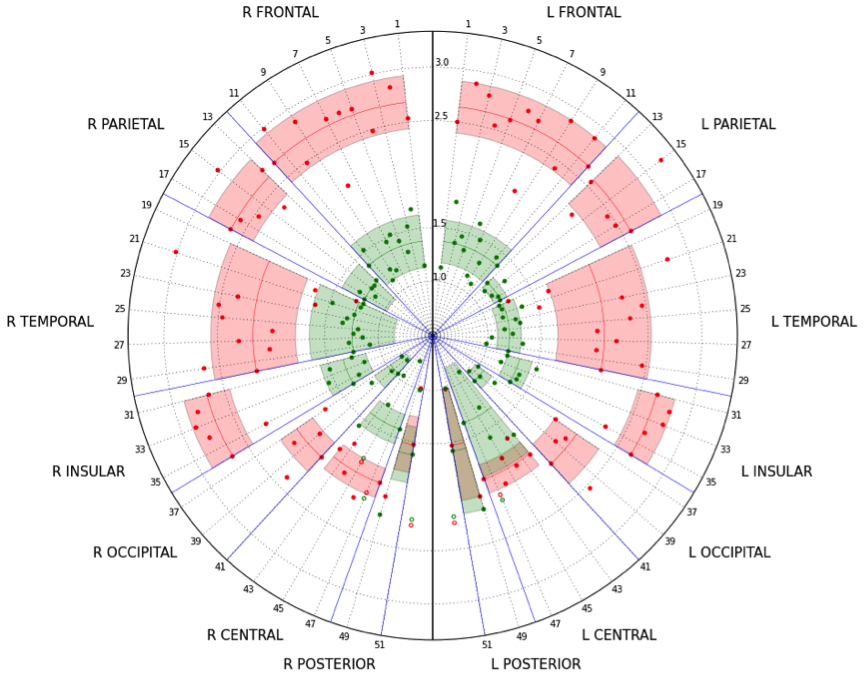
R2
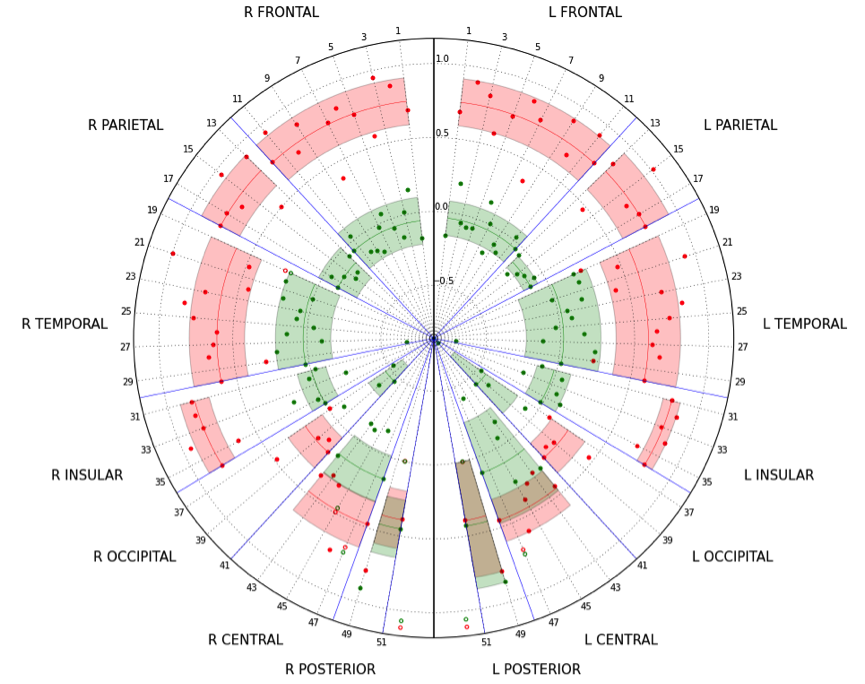
SI
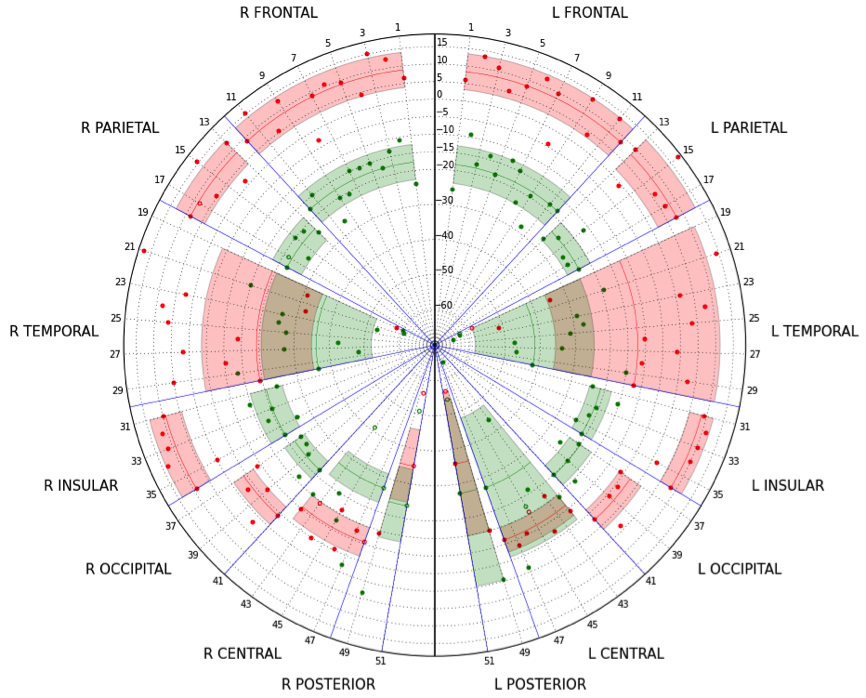
WMR
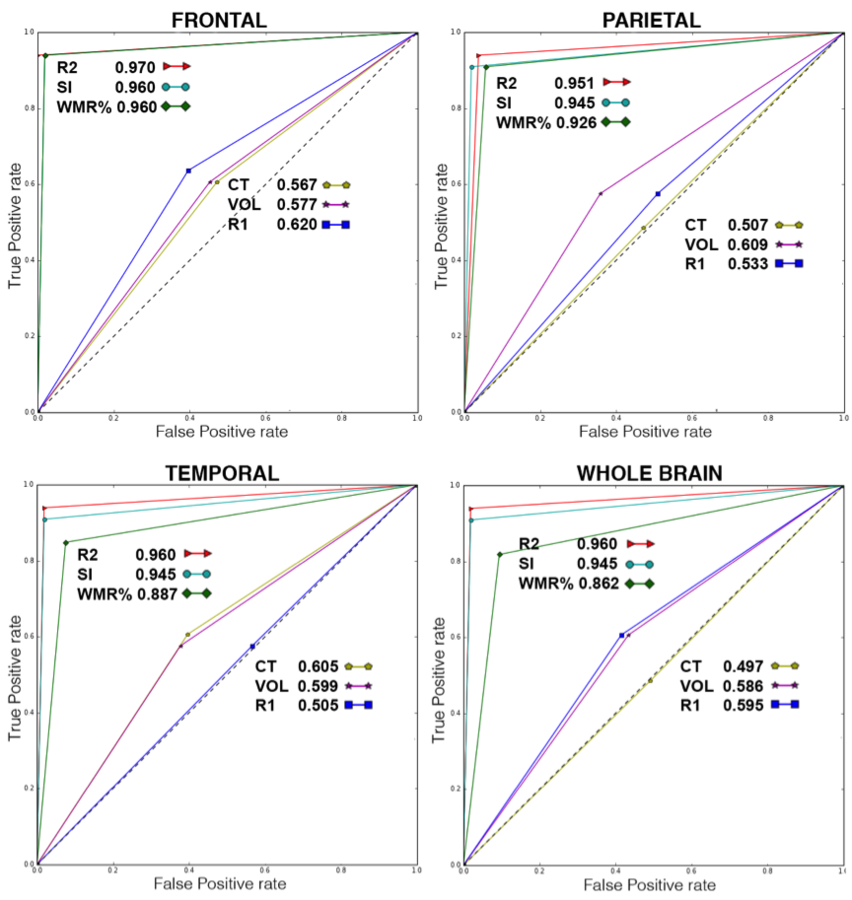
ROC (Receiver Operator Charateristic) curves
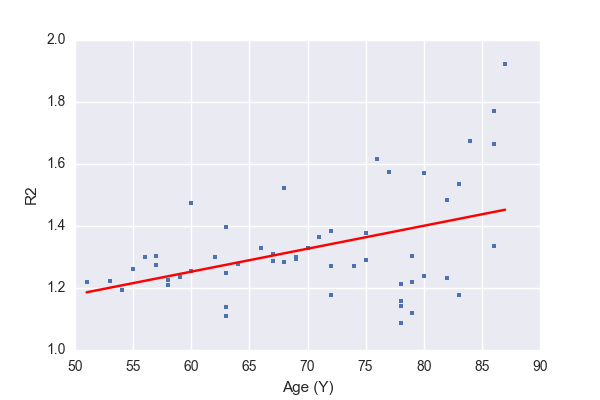
Normalization
z-score
Thanks to....
MS Centre Padova
Nuclear Medicine Padova
(special thanks to Diego Cecchin)
Neurology Padova
Neuroradiology Unit Padova
Nuclear Medicine Leipzig DE
all patients involved ...
... the audience for listening
Some References
- C Cobelli, D Foster, G Toffolo,Tracer kinetics in biomedical research, Springer, 2001.
-
SR Das, BB Avants, M Grossman, JC Gee, Registration based cortical thickness measurement, Neuroimage. 2009.
-
RS Desikan, F Sègonne, et. al, An automated labeling system for subdi- viding the human cerebral cortex on MRI scans into gyral based regions of interest, Neuroimage, 2006.
-
M Blinkenberg, HK Mathiesen, T Tscherning, et al., Cerebral metabolism, magnetic resonance spectroscopy and cognitive dysfunction in early multi- ple sclerosis: an exploratory study, Neurol Res, 2012.
-
TG Feeman, The mathematics of medical imaging: A beginners guide, Springer, 2010
-
CR Jack, etal., Amyloid-firstandneurodegeneration-firstprofilescharac- terize incident amyloid PET positivity, Neurology, 2013.
-
CS Patlak, RG Blasberg, Graphical evaluation of blood-to-brain transfer constants from multiple-time uptake data. Generalizations, Journal of Cerebral Blood Flow and Metabolism, 1985.
PhDefense
By davide poggiali
PhDefense
grinta


