D. Poggiali, postDoc

Padova, SPAN 2018
Davide Poggiali, Diego Cecchin, Paolo Gallo and Stefano De Marchi
Summary:
- Introduction
- Kinetics of the tracer in PET/MRI
- Choice of the error measure
- Results
1. Introduction
Kinetics of the tracer in PET/MRIA modern neurological study aims to relate several biomarkers from different sources in order to explain the illness evolution improve prognostic accuracy and optimize the treatment.
A modern research group can have at disposal:
- clinical,
- imaging,
- neuropsychological,
- liquor biomarkers
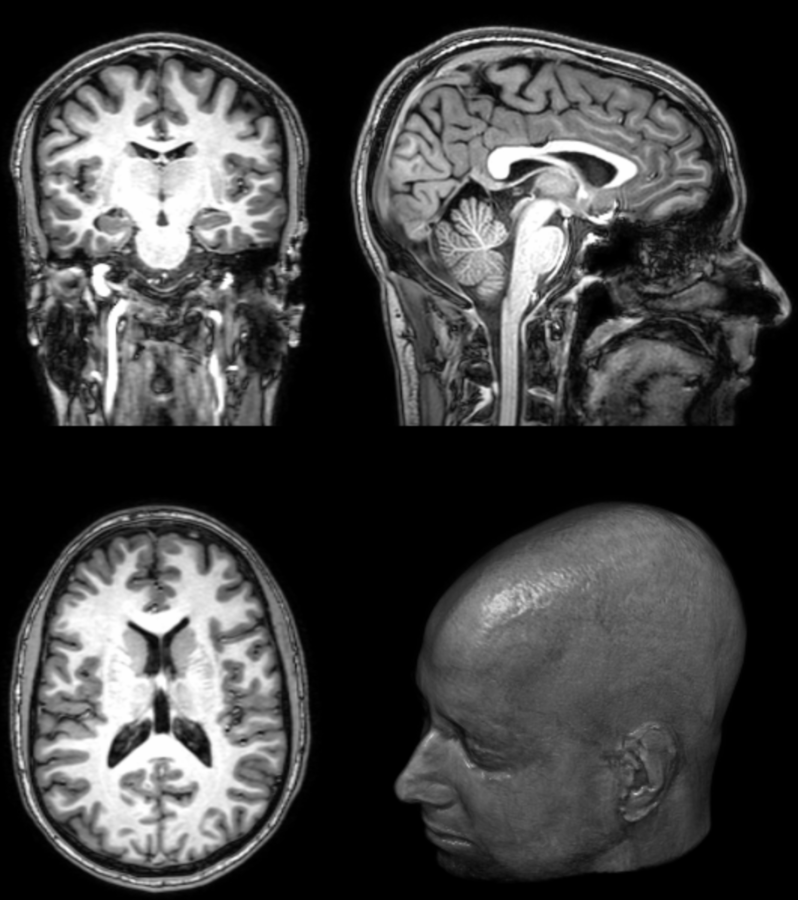

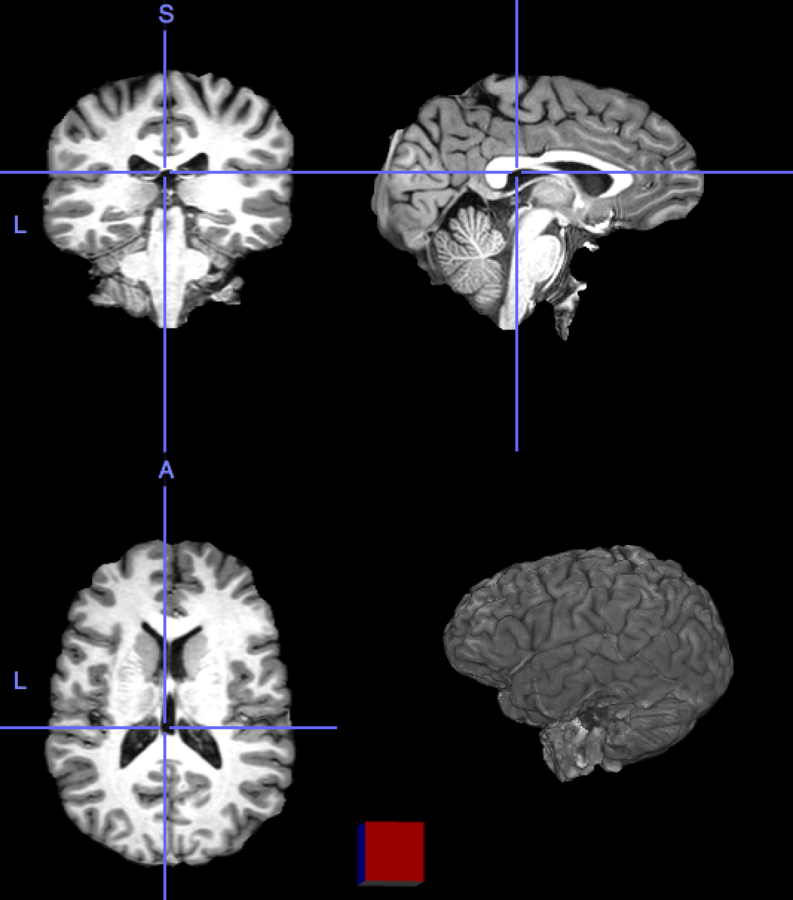
What is PET/MRI?

Correction
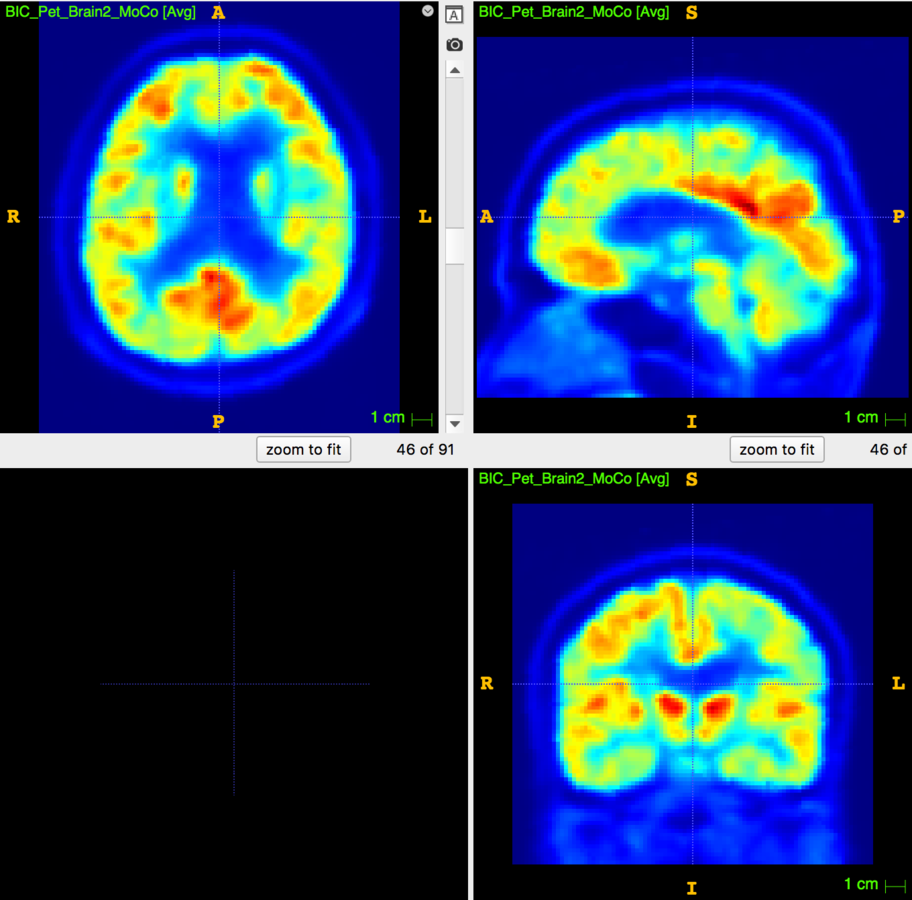
Motion Correction
Some tools
Correction
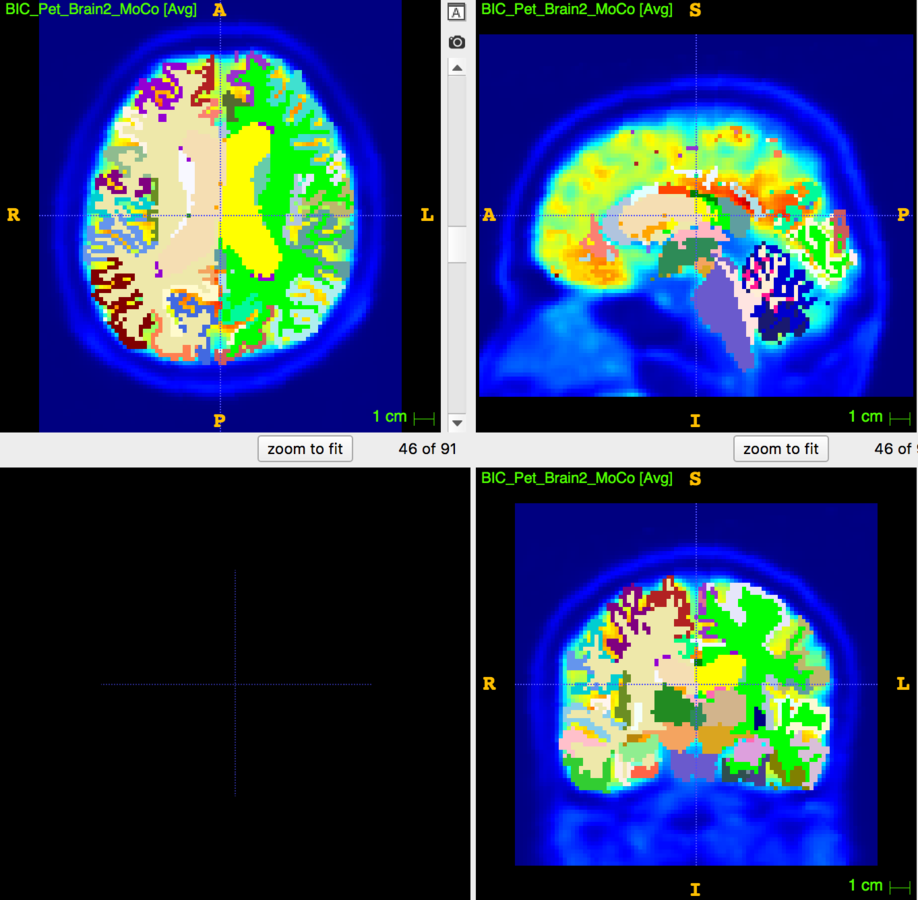
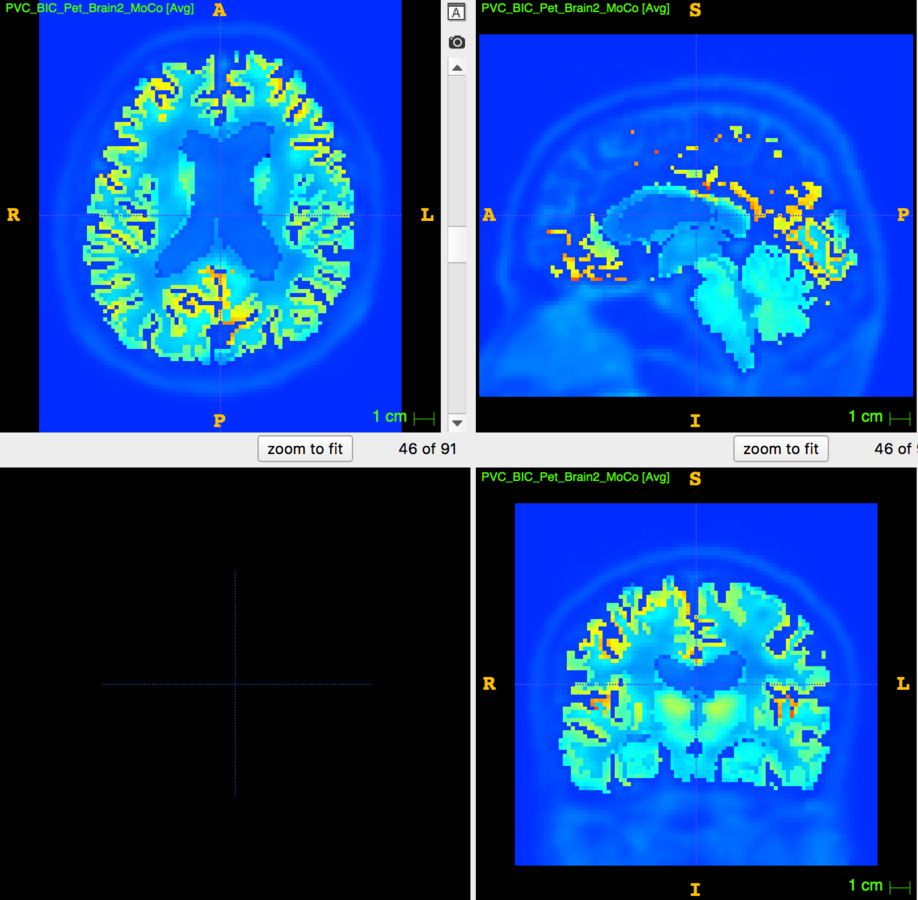
Partial Volume Correction
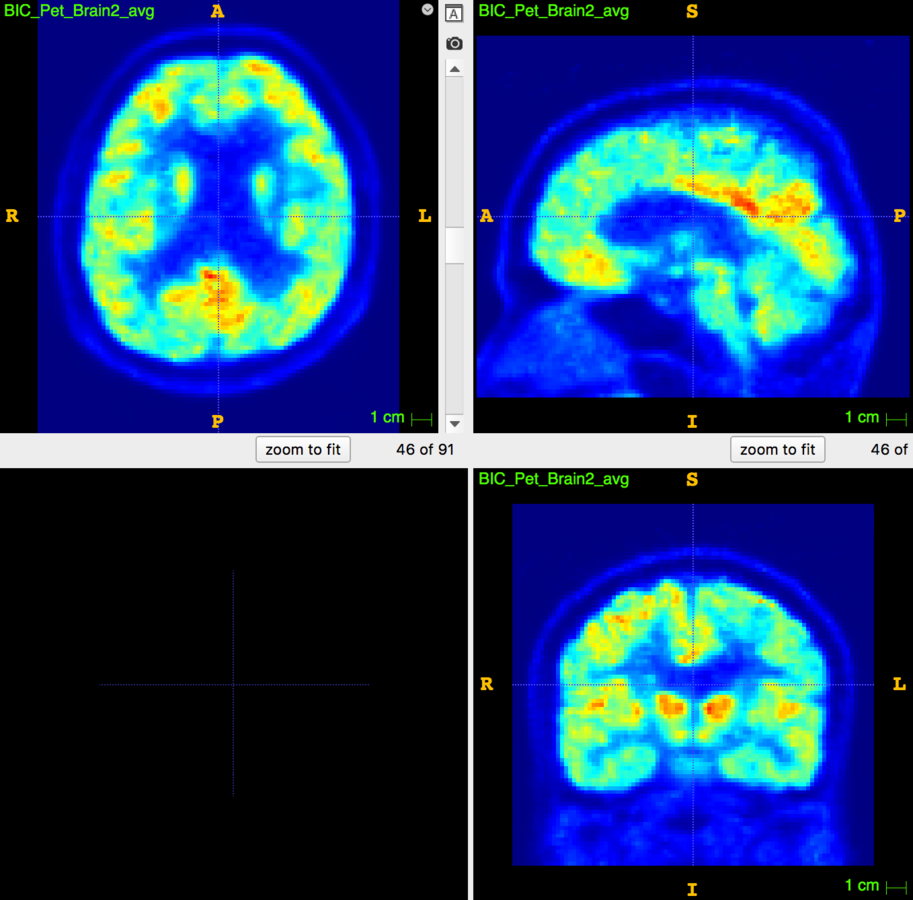
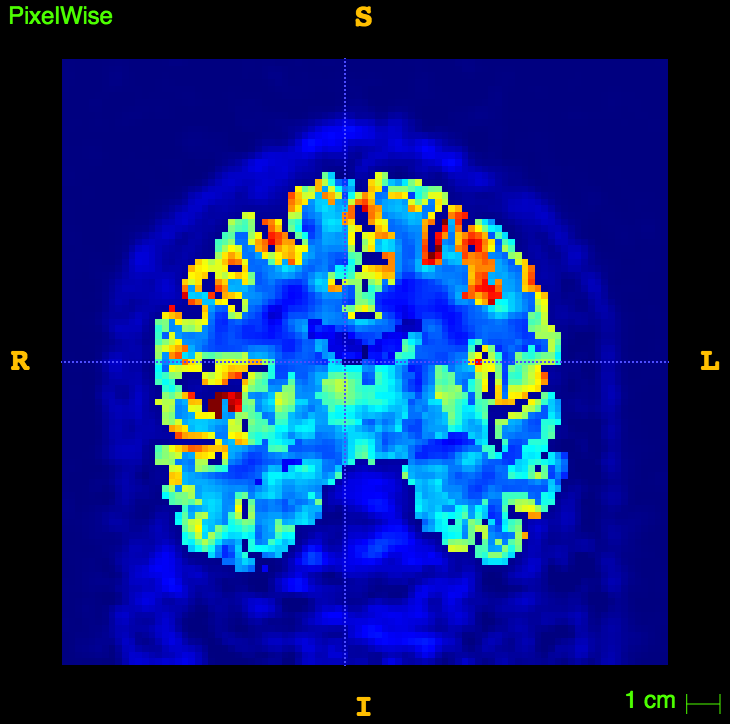
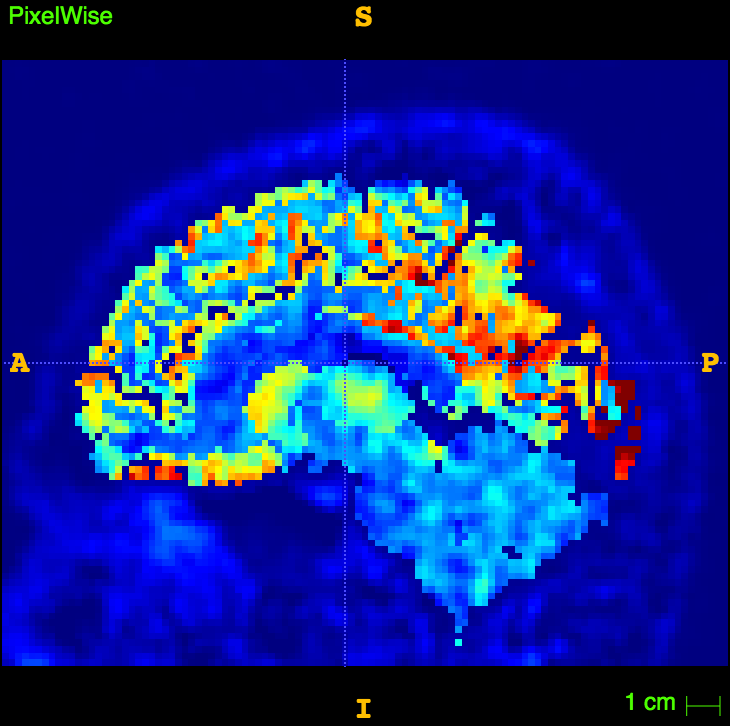
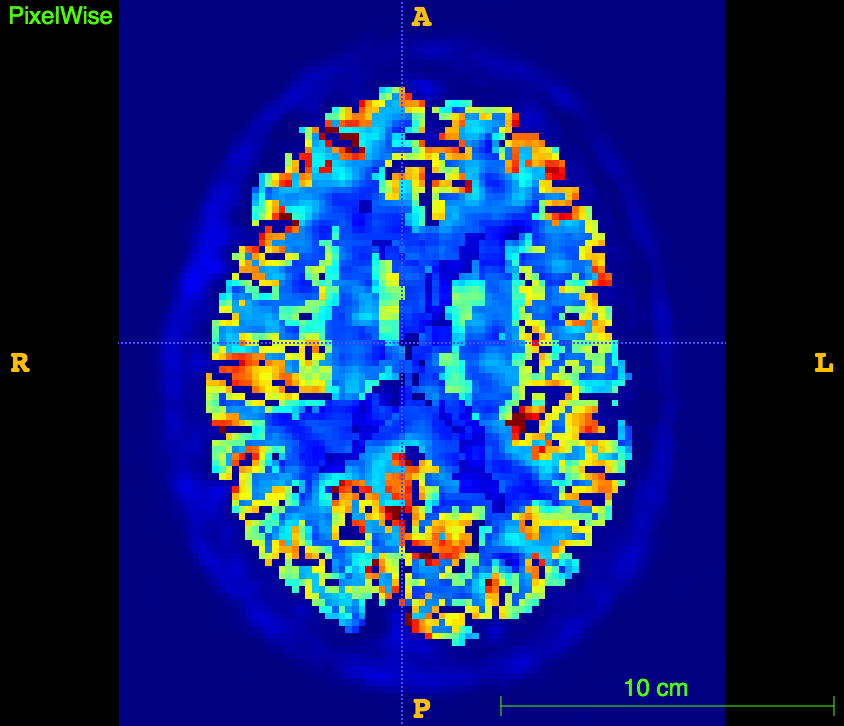
Glucose PET/MRI in MS
29 patients, 14 CIS/eRRMS and 15 RRMS underwent a PET/MRI with:
- MRI sequences: 3D T1, 3D FLAIR, 3D DIR
- 18F-Fdg PET in list-mode
The aim is to study the relationship between:
- Cortical Thickness
- WM/GM lesion number/volume
- aMRGlu
2. Kinetics of the tracer in PET/MRI

\left\lbrace {\begin{array}{cc}
\dot{x} = &Ax + B u\\
y = &Cu
\end{array} } \right.
K=\frac{k_1k_3}{k_1+k_2}
A= \left[ {\begin{array}{cc}
-k_1 & k_2 & 0\\
k_1 & -(k_2+k_3) & 0\\
0 & k_3&0
\end{array} } \right]
B= \left[ {\begin{array}{cc}
1 & 0 & 0
\end{array} } \right]
C= \left[ {\begin{array}{cc}
V_b & 1-V_b & 1-V_b
\end{array} } \right]

Patlak plot method
\displaystyle \frac{C(t)}{C_p(t)} = K \frac{\int_{0}^{t}C_p(\tau)\;d\tau}{C_p(t)} + V_b
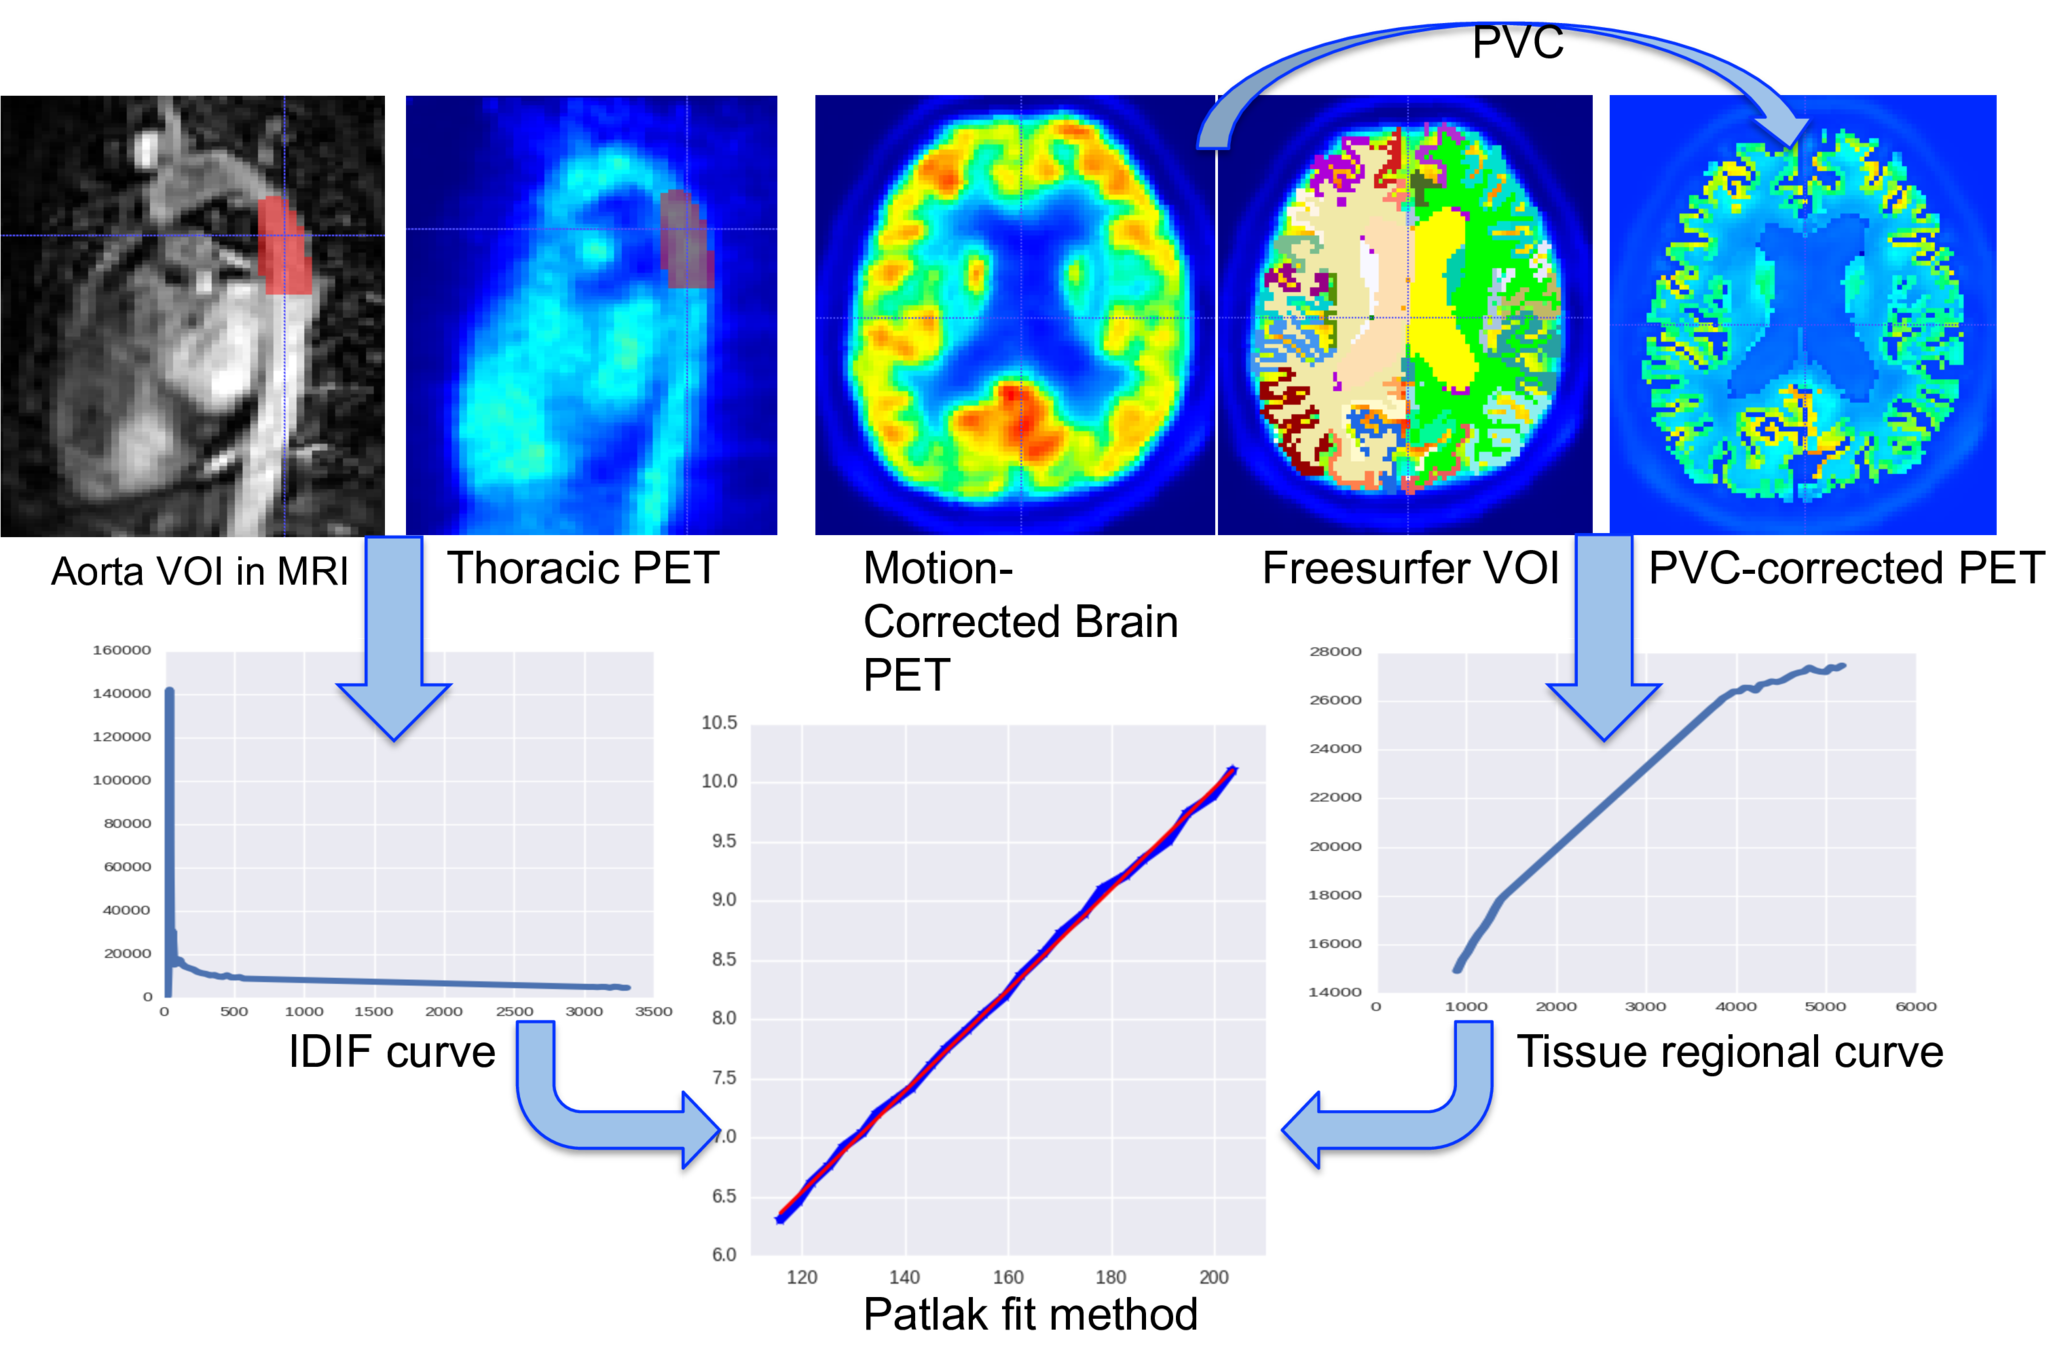
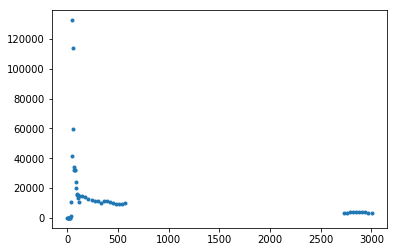
Interpolation of the IDIF is needed if the reference tissue (Aorta) is away from the target (Brain tissue)...
standard method:
\displaystyle P_f(x) = \sum_{i=0}^{3} a_i e^{-\frac{x}{l_i}}
3. Choice of the error measure
\displaystyle P_f(x) = \sum_{i=0}^{3} a_i e^{-\frac{x}{l_i}}
standard method:
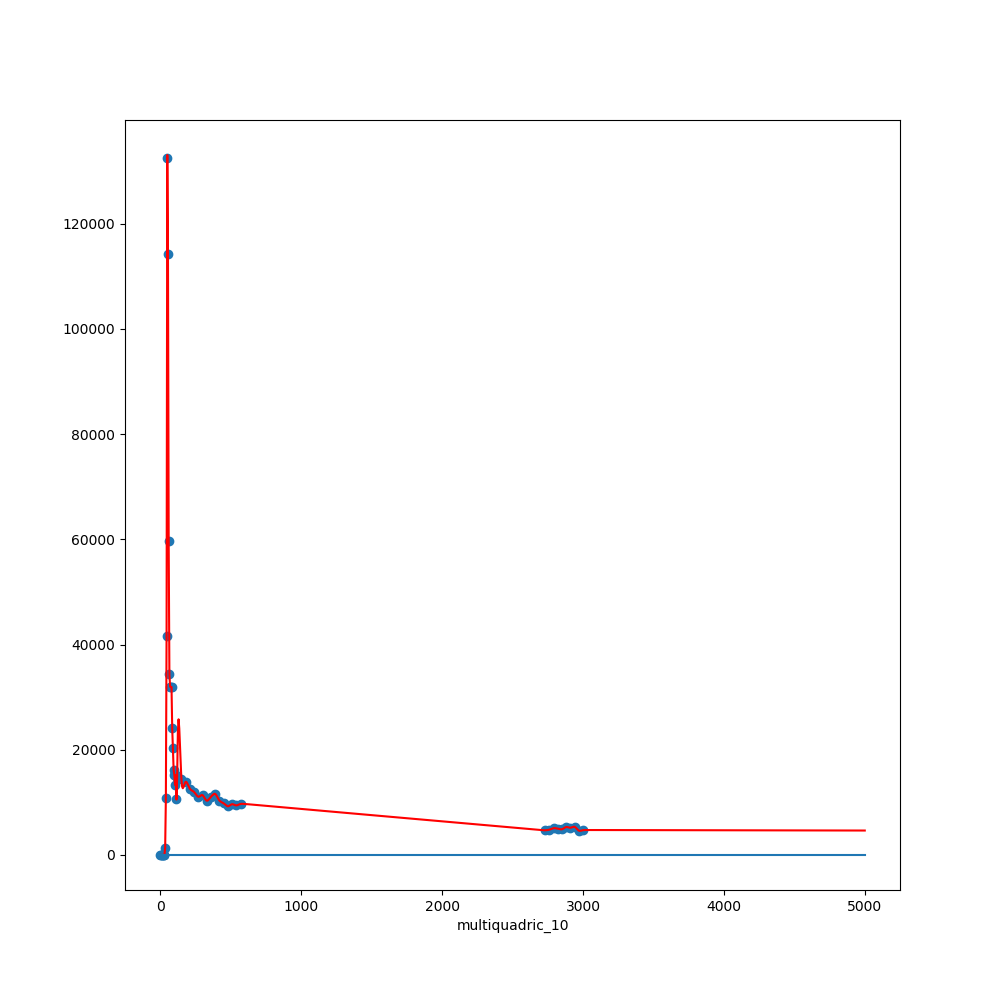
'multiquadric': sqrt((r/self.epsilon)**2 + 1)
'inverse': 1.0/sqrt((r/self.epsilon)**2 + 1)
'gaussian': exp(-(r/self.epsilon)**2)
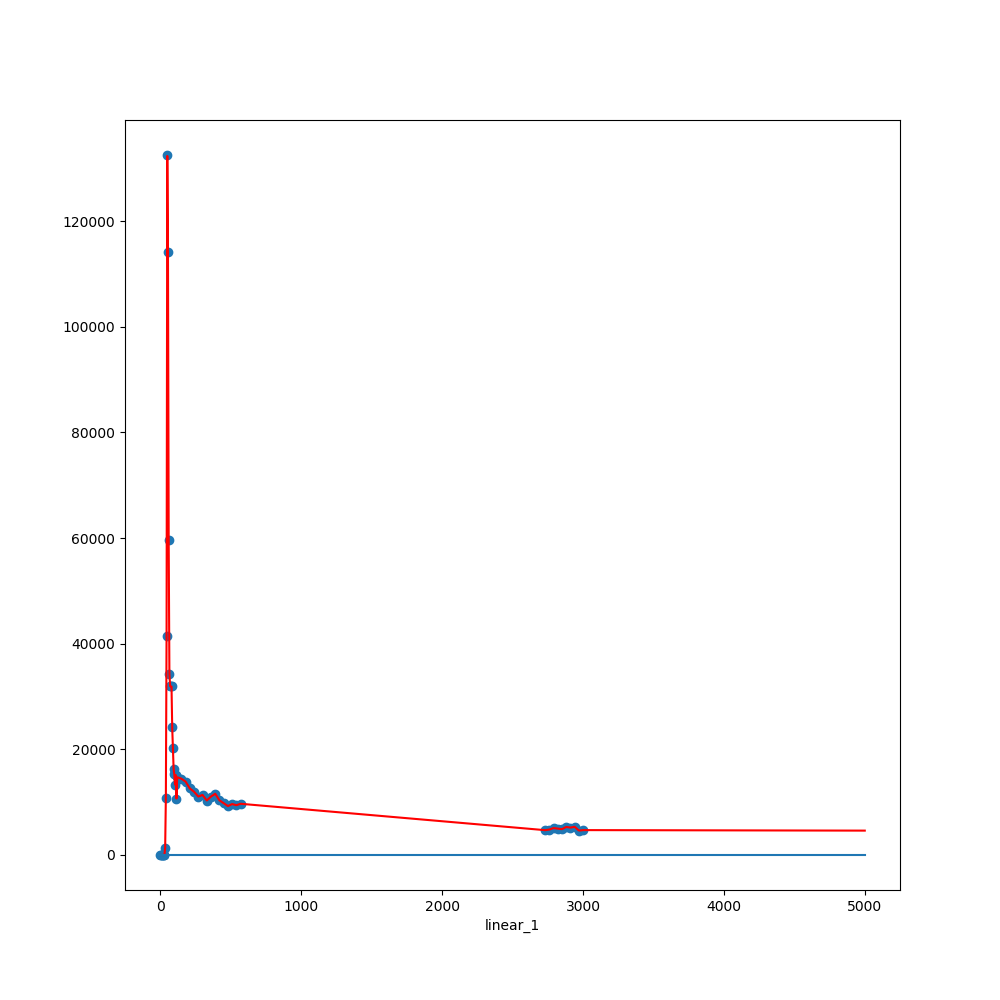
'linear': r
'cubic': r**3
'thin_plate': r**2 * log(r)Rbf method (in scipy):
Leave-one-out and Train-test split approaches are not suitable
The chosen error measure is the coefficient of determination R squared
(the larger the better)
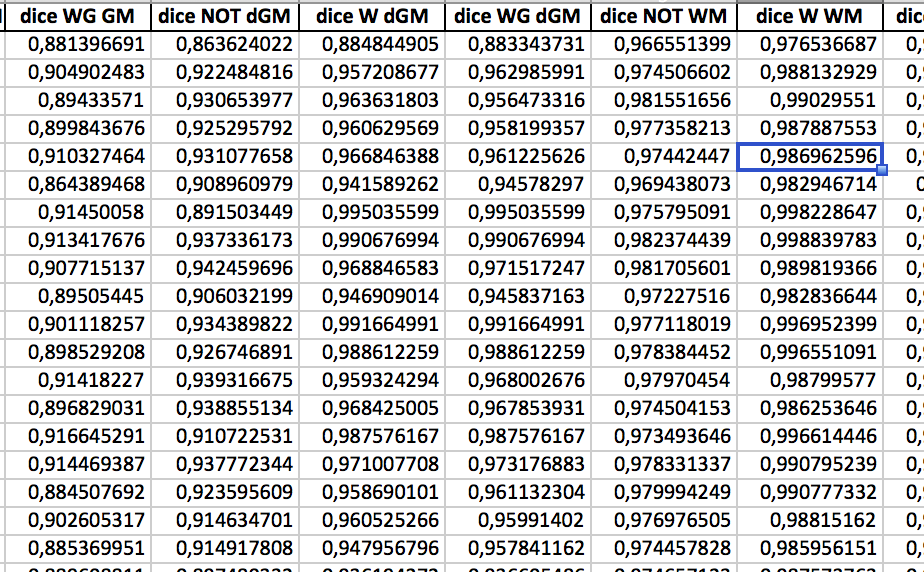
Results:
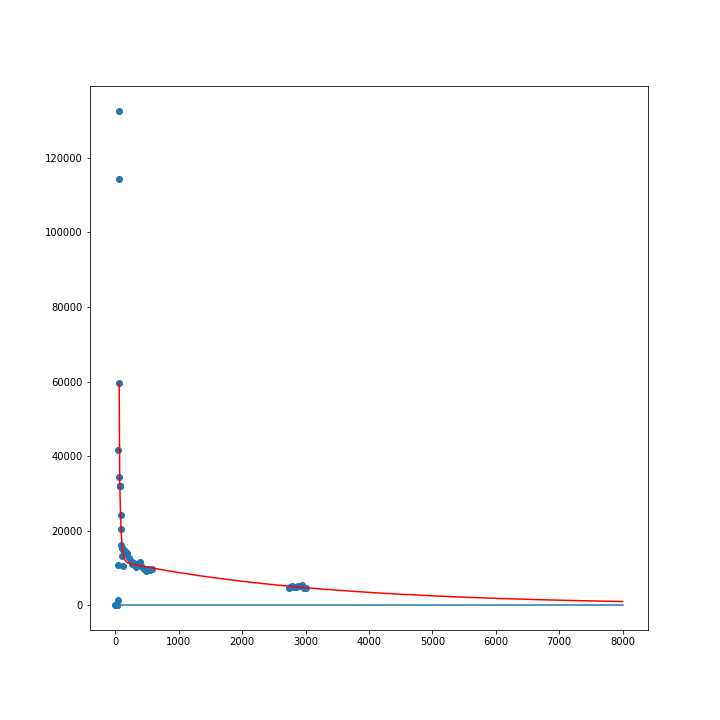
standard method:
Mean R-squared:
0.998
Results:
Linear:
Mean R-squared:
0.956
p-val:
1.e-15
Results:
Multiquadric:
Mean R-squared:
0.957
p-val:
1.e-15
4. Conclusions
-
Non-standard error measure estimation is needed (future work)
-
Physic-based model interpolation offers better results.
-
RBFs are probably not a good choice when dealing with huge gaps in datasets.
Thank you!
References
[1] L.-F. de Geus-Oei, E. P. Visser, P. F. M. Krabbe, B. A. van Hoorn, E. B. Koenders, A. T. Willemsen,
J. Pruim, F. H. M. Corstens, and W. J. G. Oyen, Comparison of image-derived and arterial input
functions for estimating the rate of glucose metabolism in therapy-monitoring 18F-FDG PET studies,
Journal of nuclear medicine : official publication, Society of Nuclear Medicine, 47 (2006), pp. 945–9.
[2] J. Logan, J. S. Fowler, N. D. Volkow, A. P. Wolf, S. L. Dewey, D. J. Schlyer, R. R. MacGregor,
R. Hitzemann, B. Bendriem, S. J. Gatley, and D. R. Christman, Graphical Analysis of Reversible
Radioligand Binding from TimeActivity Measurements Applied to N-11C-methyl-cocaine PET Studies in
Human Subjects, Journal of Cerebral Blood Flow & Metabolism, 10 (1990), pp. 740–747.
[3] C. S. Patlak, R. G. Blasberg, and J. D. Fenstermacher, Graphical Evaluation of Blood-to-Brain Transfer Constants from Multiple-Time Uptake Data, Journal of Cerebral Blood Flow & Metabolism, 3 (1983), pp. 1–7.
[4] P. Zanotti-Fregonara, K. Chen, J.-S. Liow, M. Fujita, and R. B. Innis, Image-derived input func-
tion for brain PET studies: many challenges and few opportunities, Journal of cerebral blood flow and
metabolism : official journal of the International Society of Cerebral Blood Flow and Metabolism, 31 (2011), pp. 1986–98.
[5] S. Zhou, K. Chen, E. M. Reiman, D.-m. Li, and B. Shan, A method for generating image-derived input
function in quantitative 18F-FDG PET study based on the monotonicity of the input and output function
curve, Nuclear medicine communications, 33 (2012), pp. 362–70.
Span18
By davide poggiali
Span18
grintagazzo


