Demystifying D3 with the help of Shakespeare
November 27th, 2017
@delainewendling
Delaine Wendling


Goals of this Talk
- Explain why data visualizations are powerful
- Compare different data libraries and their respective advantages and disadvantages
- Become more familiar with D3 syntax and patterns
- Help you feel more comfortable creating data visualizations with D3 or another visualization library
What is D3.js?
D3 (Data-Driven Documents or D3.js) is a JavaScript library for visualizing data

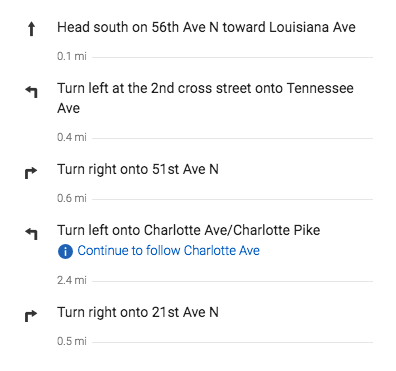
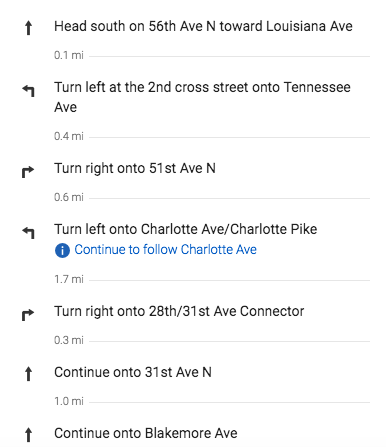

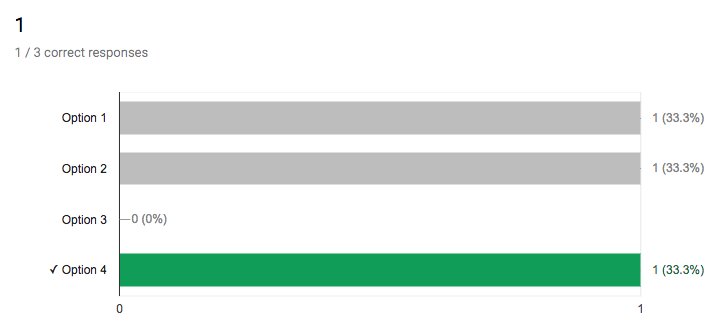
Google Forms
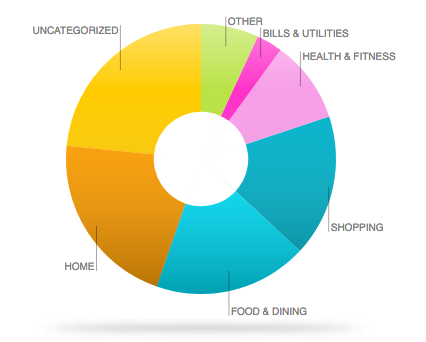
Mint.com

The government
What's out there?
ChartJs - supports 6 different chart styles.
Dygraphs - supports line charts and can handle a lot of data.
ZingChart - supports multiple charts, has very few customization options.
Google Charts - supports multiple chart options.
*High Charts and Fusion Charts are only free for non-commercial use
PROS
CONS
Highly customizable
Steep learning curve
Lightweight
Large community with a lot of examples for inspiration
IE 6-8 not supported
Many projects built on top of d3 (NVD3, crossfilter, DC)
Chart export
Label Management
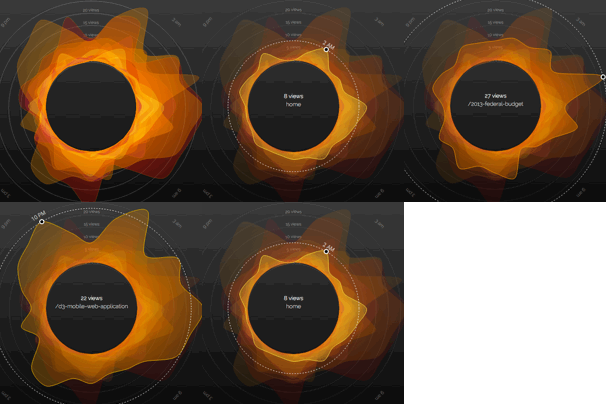
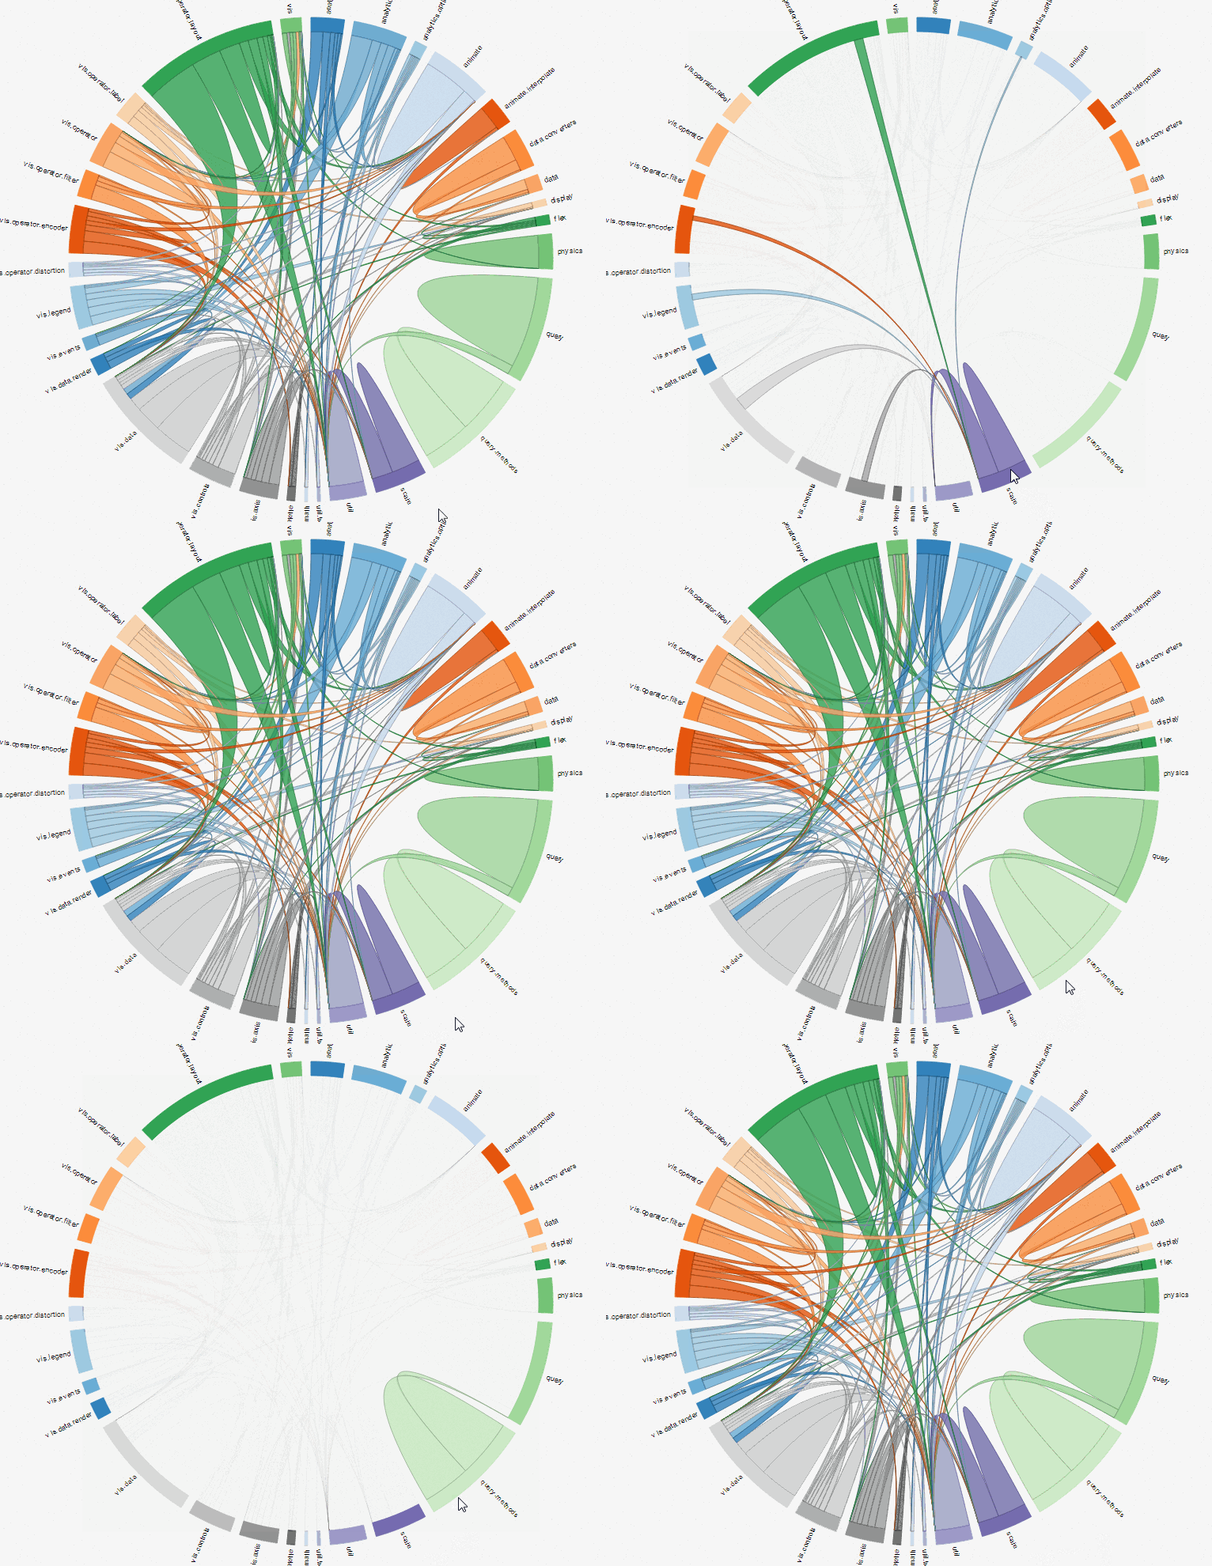
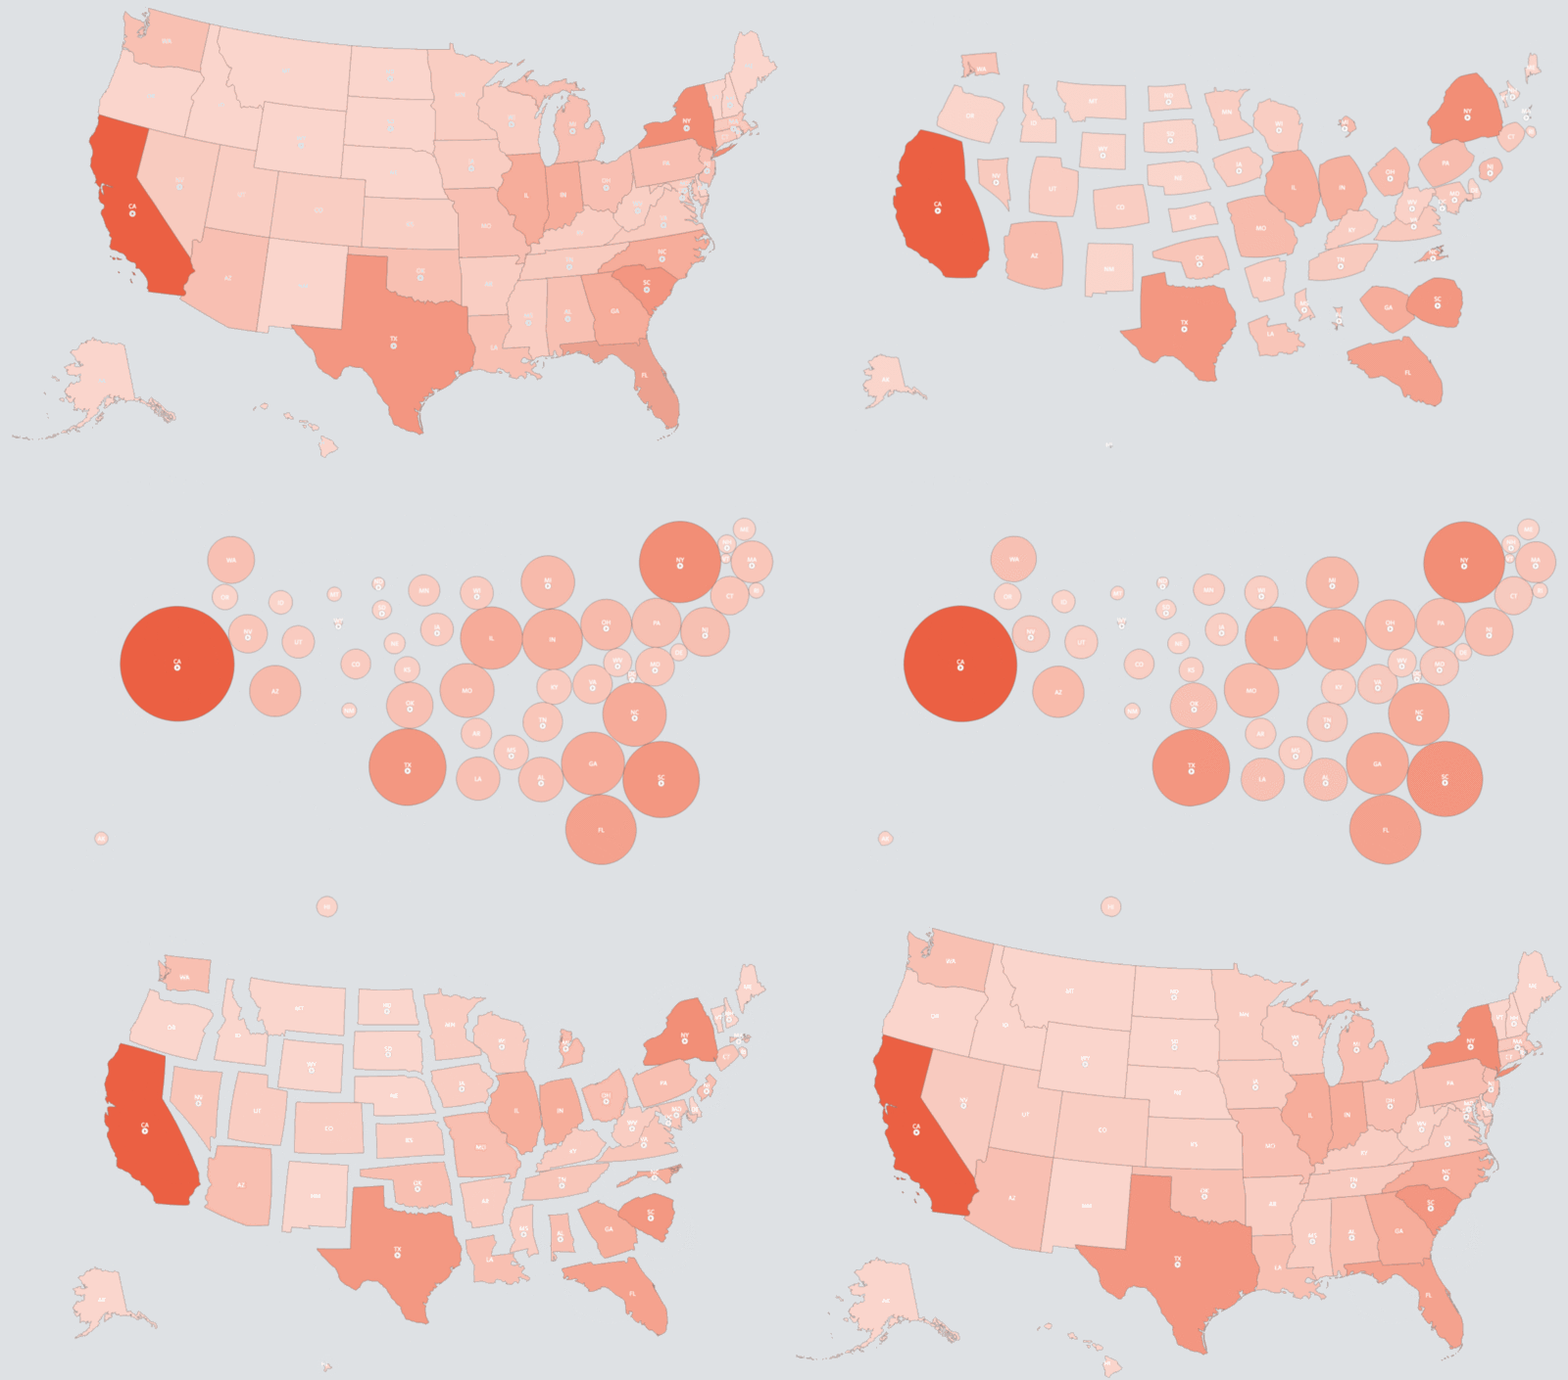
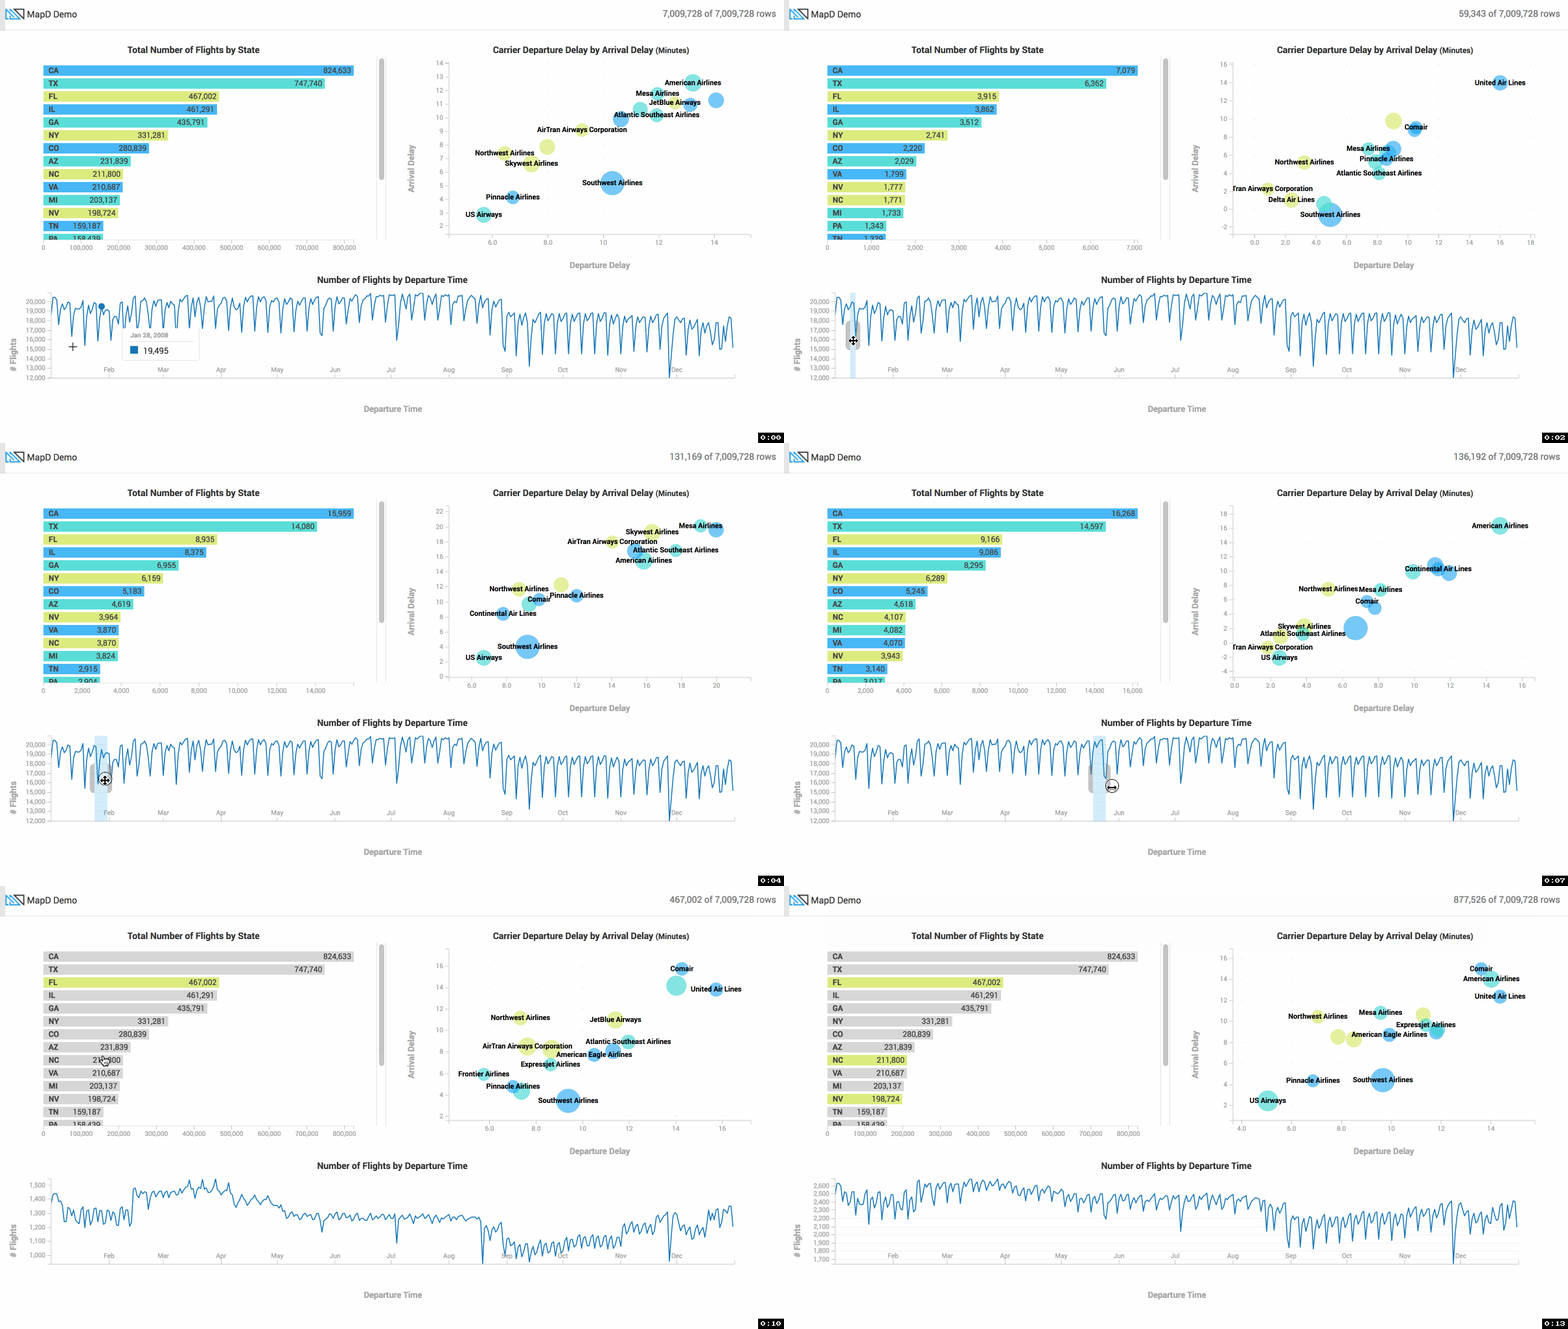
Why D3.js?
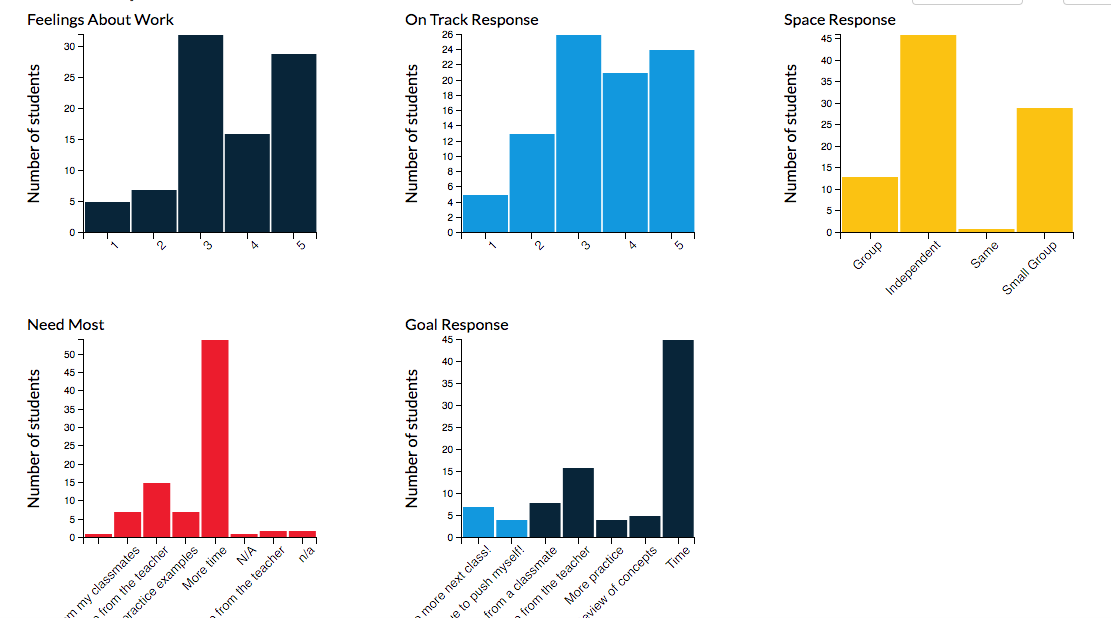

Why do we even need a visualization library?
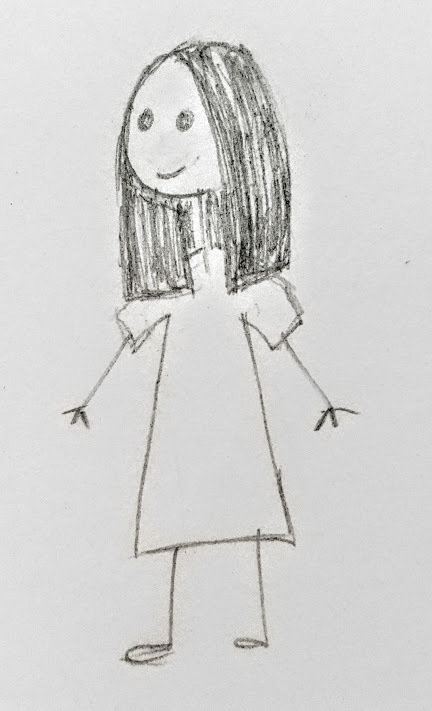
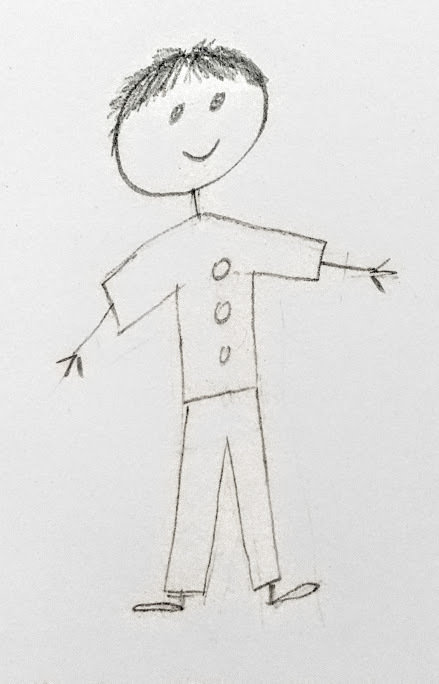


ENTER
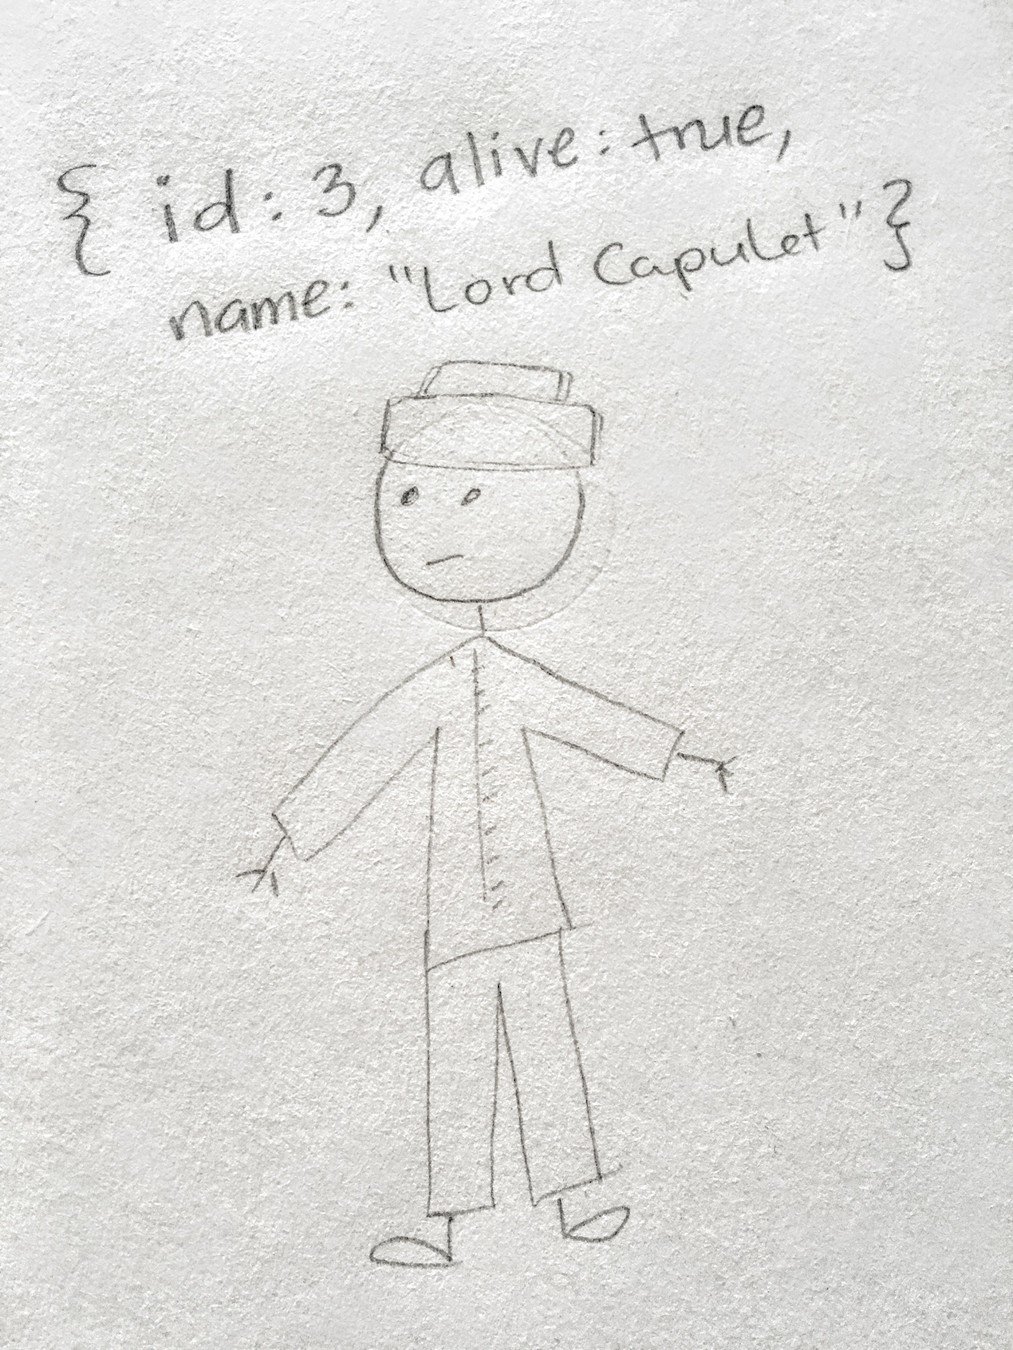
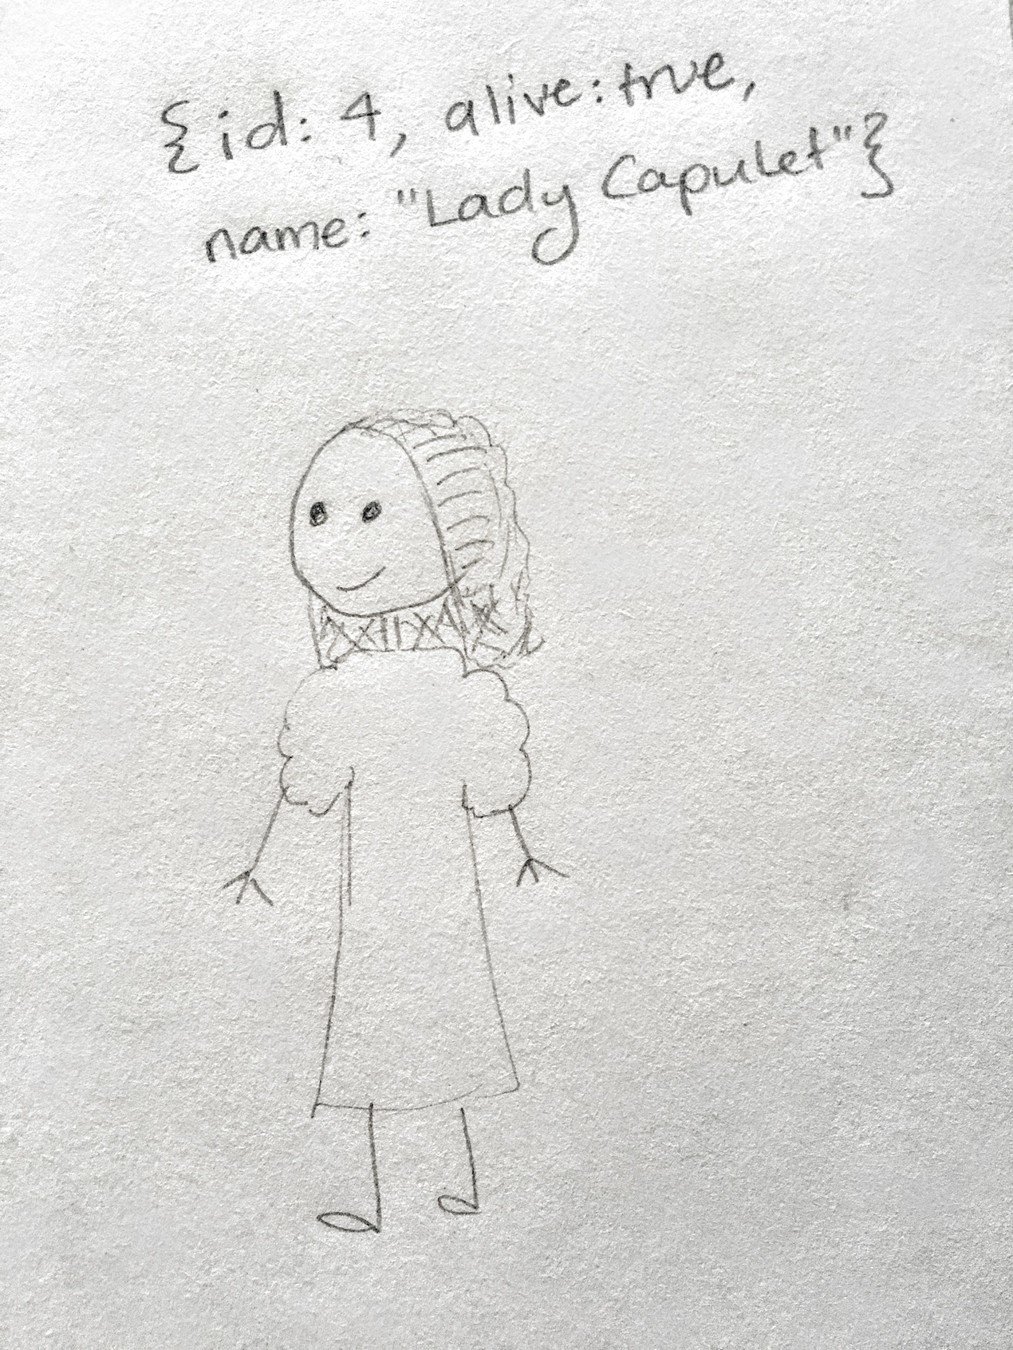


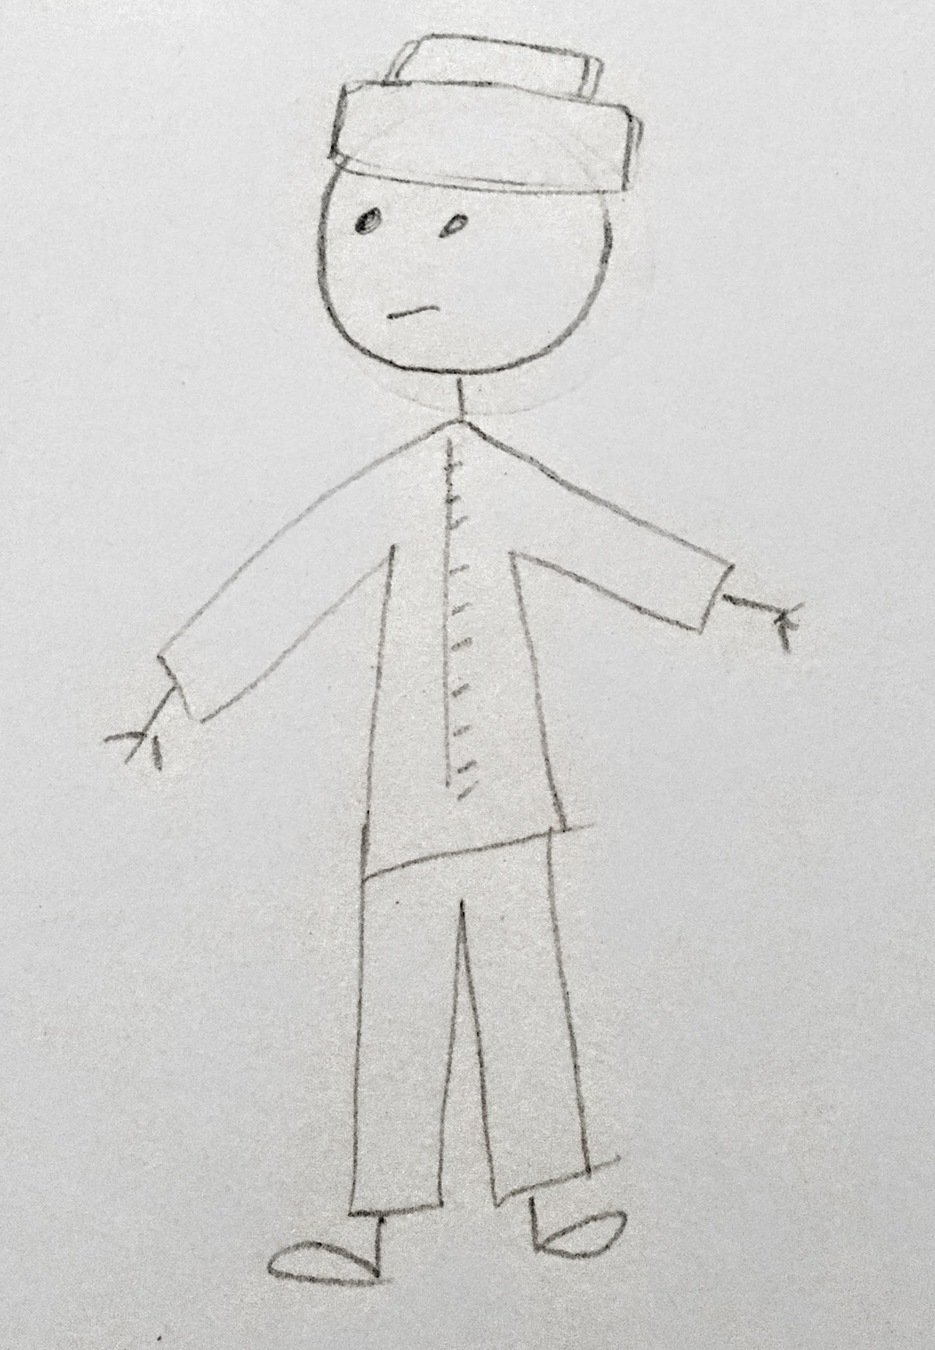
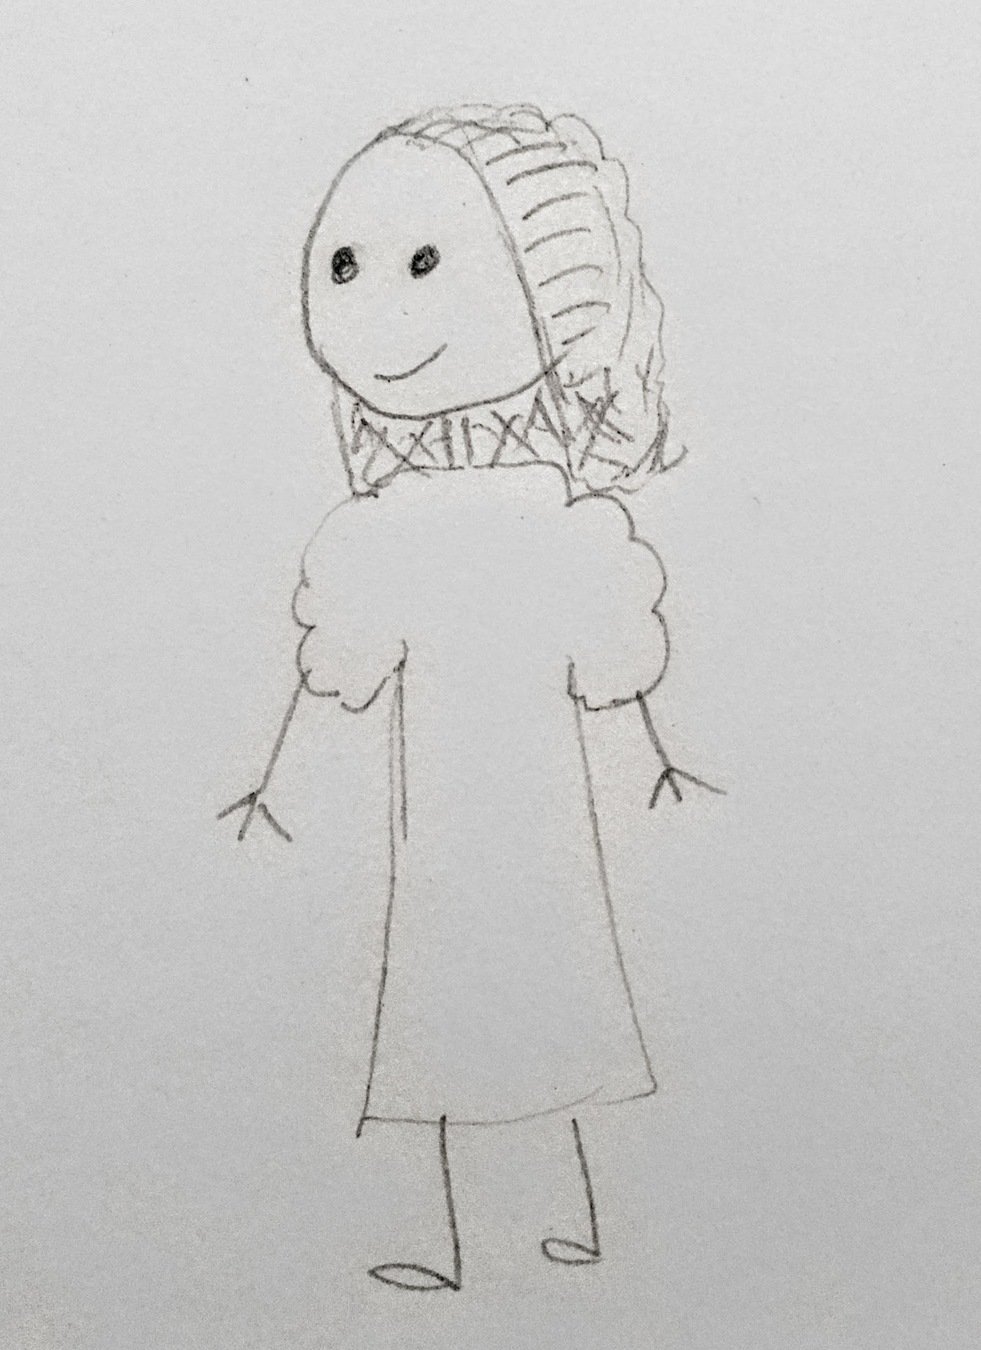
EXIT
EXIT

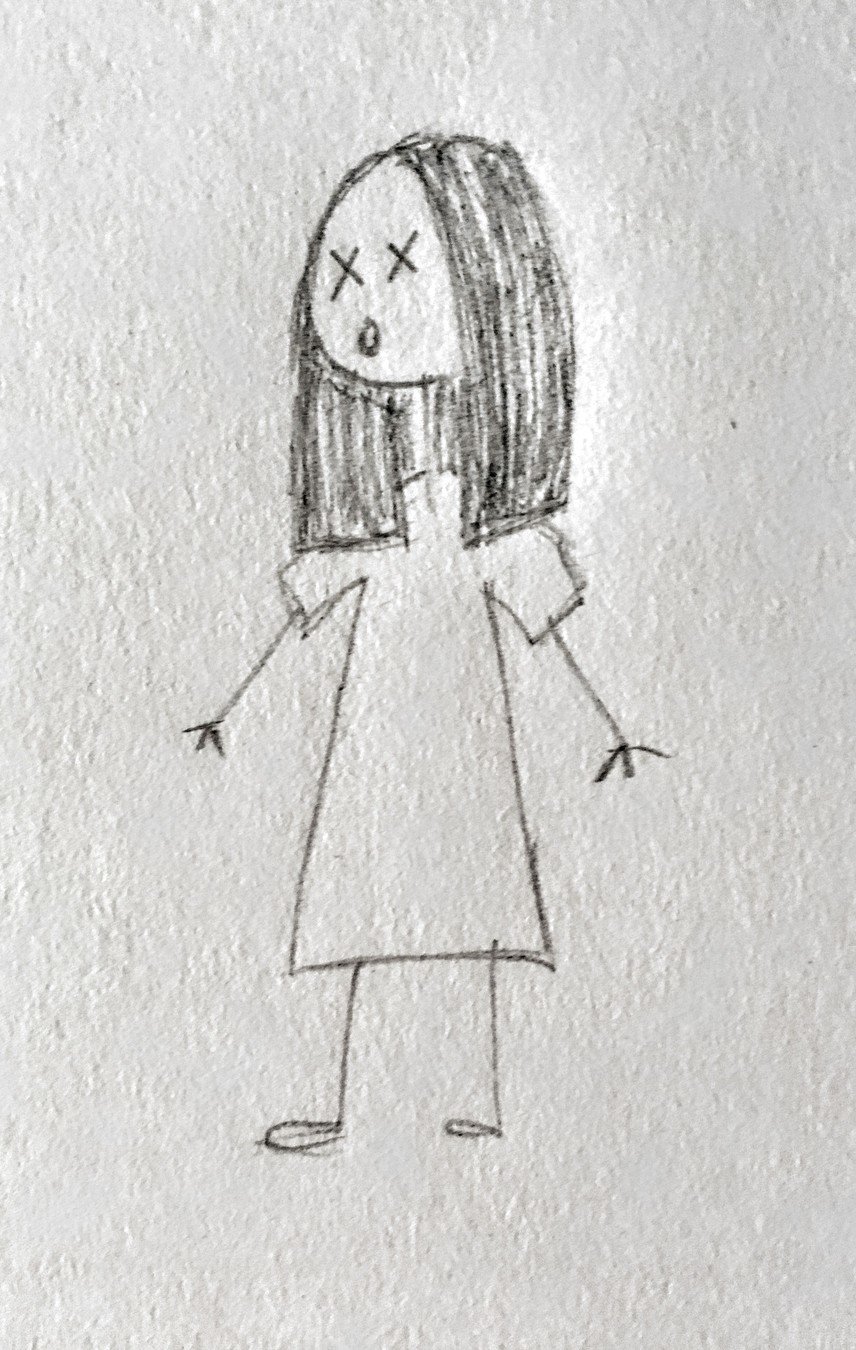
Update

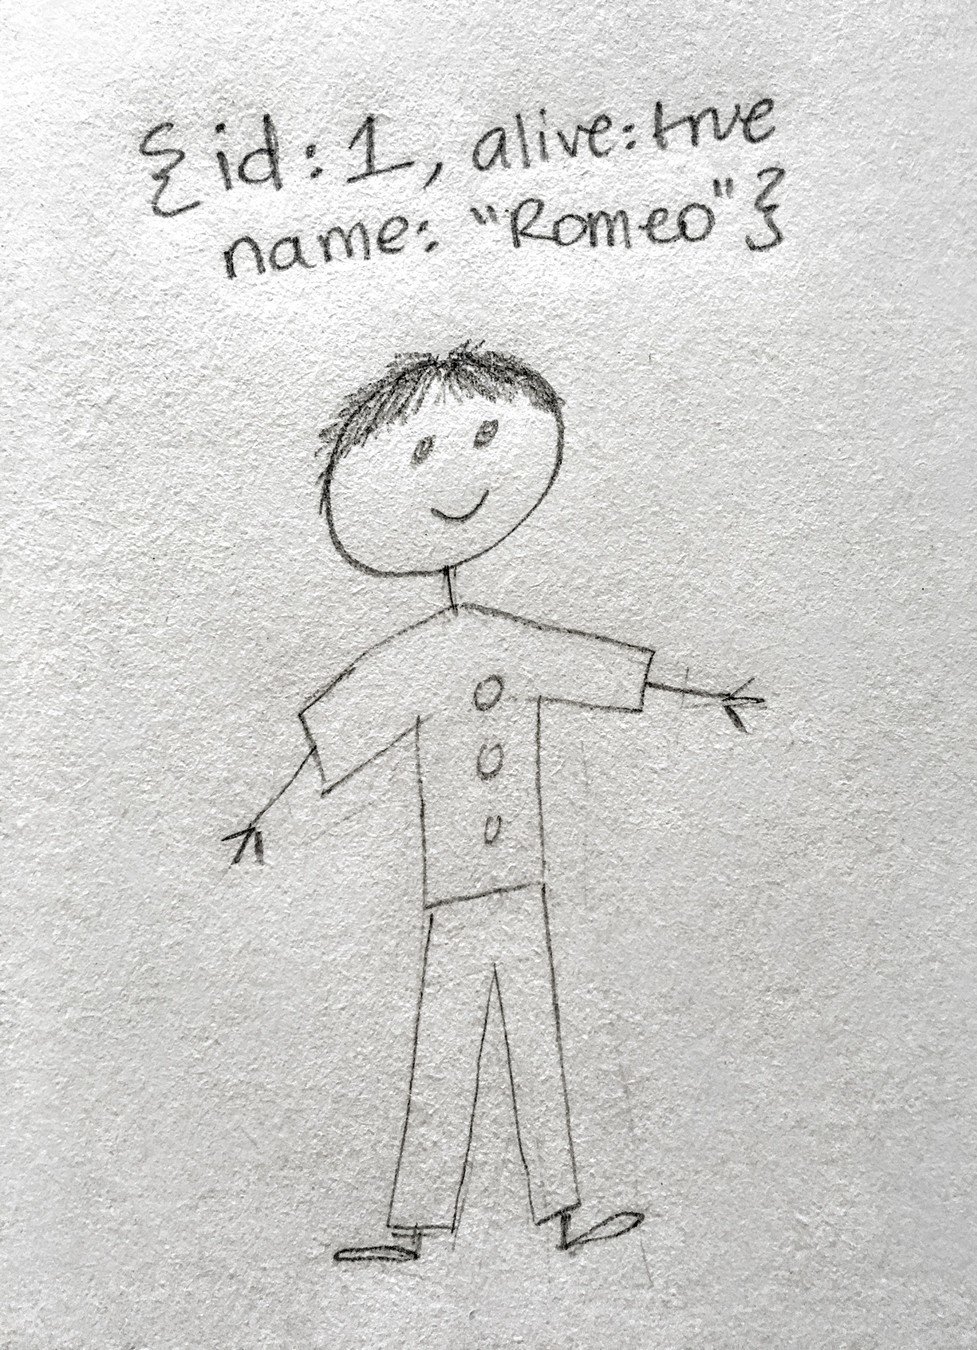
ENTER

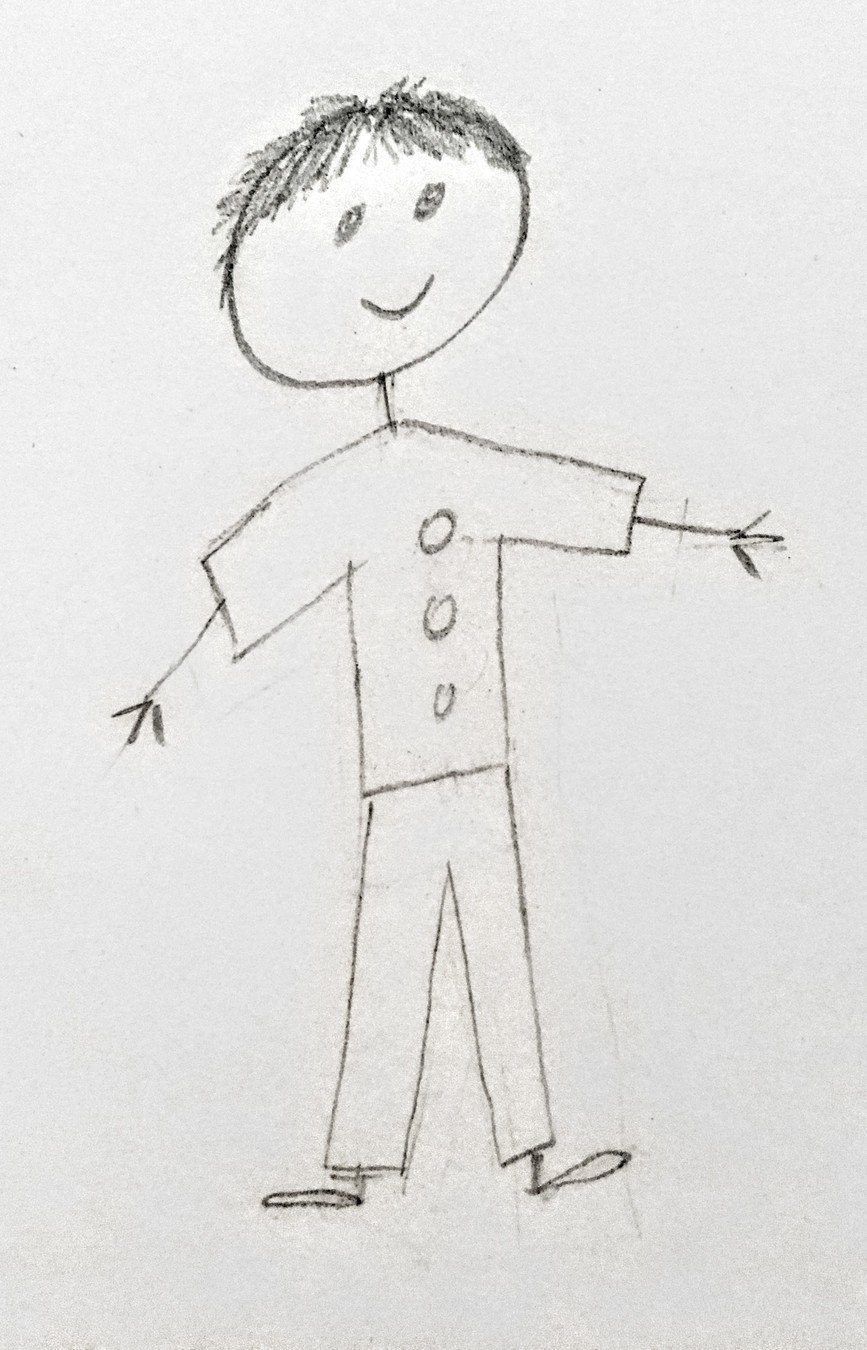
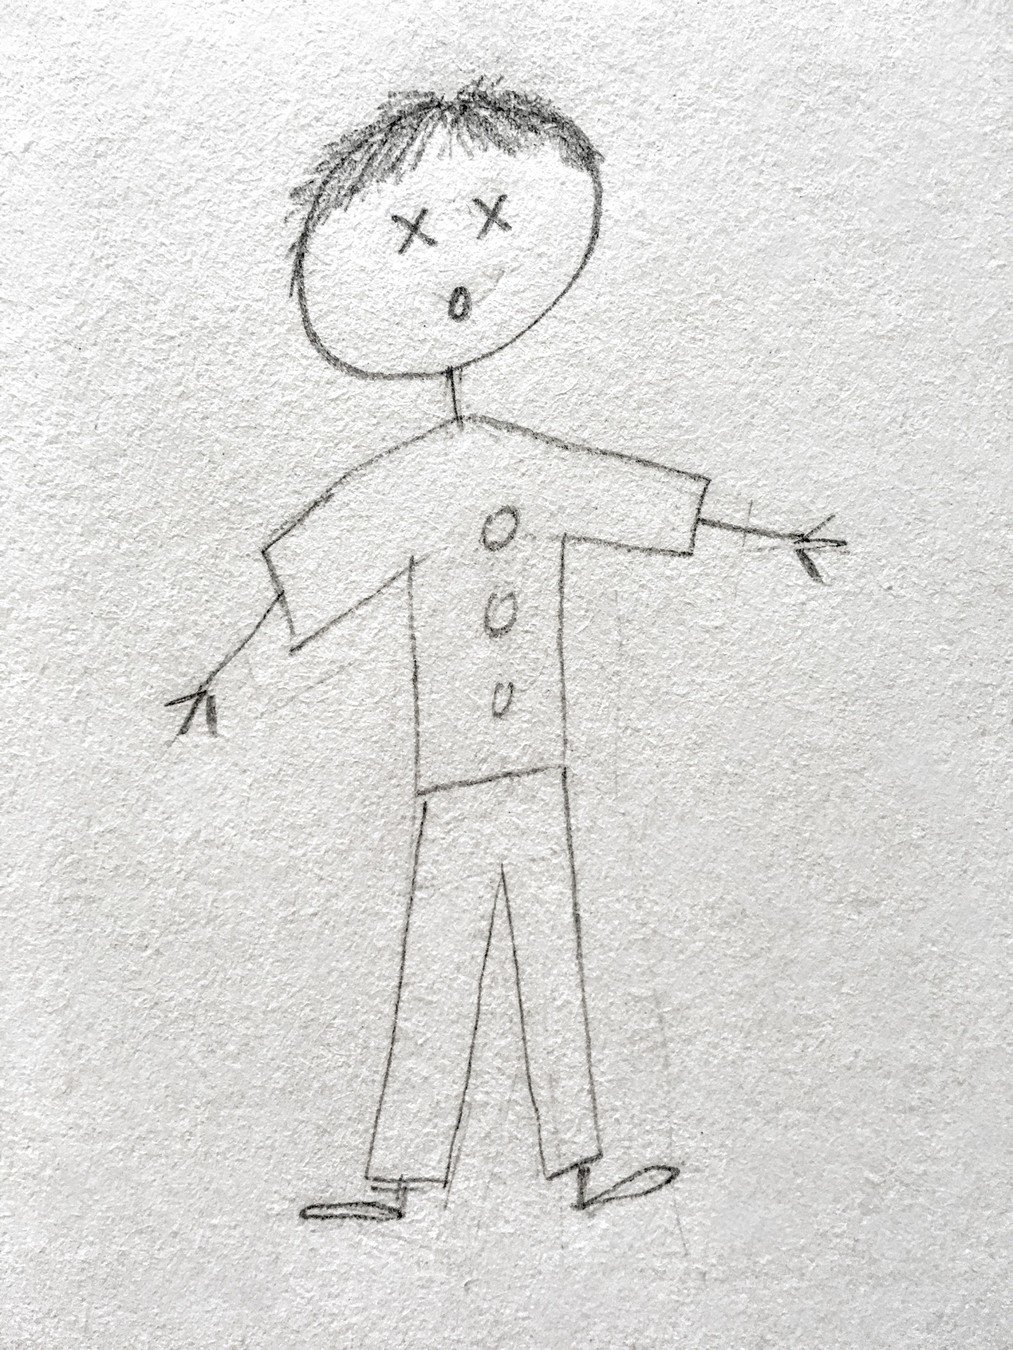
UPDATE


<div class="chart">
  <img>
  <img>
</div>
HTML
const dataArr = [
{id: 1, alive: true, img: "http://bit.ly/romeo_character"},
{id: 2, alive: true, img:"http://bit.ly/juliet_character"}];

let chart = d3.select(".chart");

let selection = chart.selectAll("img")
            .data(dataArr)
            .attr("src", d => d.img)
            .style({left: (d, i) => i*110 + "px"});
JavaScript


ENTER


<div class="chart">
  <img>
  <img>
</div>
HTML
let dataArr = [
{id: 1, alive: true, img: "http://bit.ly/romeo_character"},
{id: 2, alive: true, img:"http://bit.ly/juliet_character"}];

dataArr = [...dataArr,
{id: 3, alive: true, img: "http://bit.ly/lordcapulet_character"},
{id: 4, alive: true, img:"http://bit.ly/ladycapulet_character"}];

let chart = d3.select(".chart");

let selection = chart.selectAll("img")
            .data(dataArr)
selection.attr("src", d => d.img)
            .style({left: (d, i) => i*110 + "px"});
selection.enter().append("img")
            .attr("src", d => d.img)
            .style({left: (d, i) => i*110 + "px"});
JavaScript
<div class="chart"></div>HTML
const dataArr = [
{id: 1, alive: true, img: "http://bit.ly/romeo_character"},
{id: 2, alive: true, img:"http://bit.ly/juliet_character"}];

function createPlay(data){
  let chart = d3.select(".chart");

  let selection = chart.selectAll("img")
                       .data(data)
  selection.enter().append("img")
           .attr("src", d => d.img)
           .style({left: (d, i) => i*110 + "px"});
}

createPlay(dataArr);

const newData = [...dataArr,
{id: 3, alive: true, img: "http://bit.ly/lordcapulet_character"},
{id: 4, alive: true, img:"http://bit.ly/ladycapulet_character"}];

createPlay(newData);
JavaScript


EXIT
EXIT
const dataArr = [
{id: 1, alive: true, img: "http://bit.ly/romeo_character"},
{id: 2, alive: true, img:"http://bit.ly/juliet_character"},
{id: 3, alive: true, img: "http://bit.ly/lordcapulet_character"},
{id: 4, alive: true, img:"http://bit.ly/ladycapulet_character"}];

function createPlay(data){
  let chart = d3.select(".chart");

  let selection = chart.selectAll("img")
                       .data(data)
  selection.enter().append("img")
           .attr("src", d => d.img)
           .style({left: (d, i) => i*110 + "px"});
  selection.exit().remove();
}

createPlay(dataArr);

const newData = dataArr.filter(d => d.img ===
"http://bit.ly/juliet_character")
createPlay(newData);


Existing
New Data


const dataArr = [
{id: 1, alive: true, img: "http://bit.ly/romeo_character"},
{id: 2, alive: true, img:"http://bit.ly/juliet_character"},
{id: 3, alive: true, img: "http://bit.ly/lordcapulet_character"},
{id: 4, alive: true, img:"http://bit.ly/ladycapulet_character"}];

function createPlay(data){
  let chart = d3.select(".chart");

  let selection = chart.selectAll("img")
                       .data(data, d => d.img)
  selection.enter().append("img")
           .attr("src", d => d.img)
           .style({left: (d, i) => i*110 + "px"});
  selection.exit().remove();
}

createPlay(dataArr);

const newData = dataArr.filter(d => d.img ===
"http://bit.ly/juliet_character");

createPlay(newData);


Existing
New Data


Update
const dataArr = [
{id: 2, alive: true, img:"http://bit.ly/juliet_character"}];

function createPlay(data){
  let chart = d3.select(".chart");

  let selection = chart.selectAll("img")
                       .data(data, d => d.img)
  selection.enter().append("img")
           .attr("src", d => d.img)
           .style({left: (d, i) => i*110 + "px"});
  selection.exit().remove();
}

createPlay(dataArr);

const newData =  dataArr.map(character => {
  return {...character,
img: "http://bit.ly/julietdead_character"}
});

createPlay(newData);
Let's Review
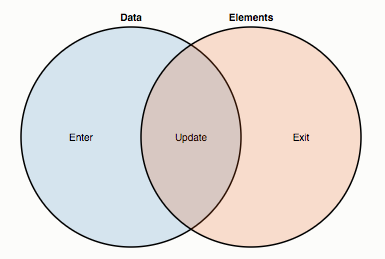
SVG
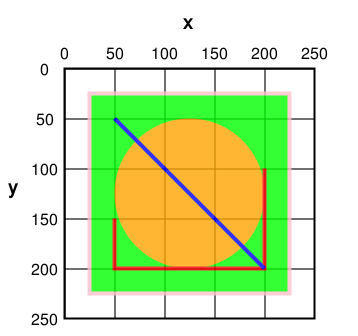
<svg>
  <rect x="25" y="25" width="200" height="200"
        fill="lime" stroke-width="4" stroke="pink" />
  <circle cx="125" cy="125" r="75" fill="orange" />
  <polyline points="50,150 50,200 200,200 200,100"
        stroke="red" stroke-width="4" fill="none" />
  <line x1="50" y1="50" x2="200" y2="200"
        stroke="blue" stroke-width="4" />
</svg>
SVG
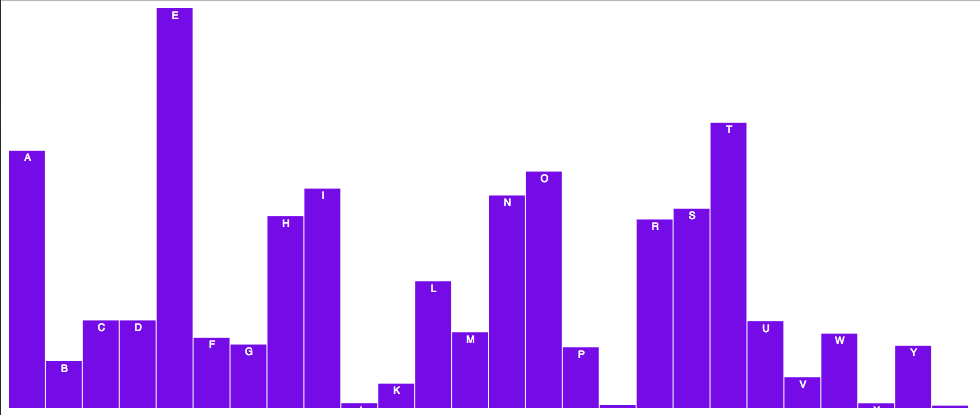
SVG
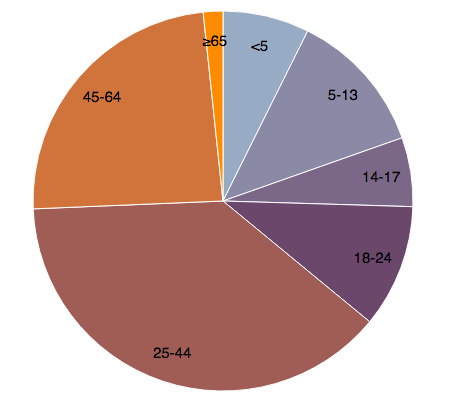
SVG
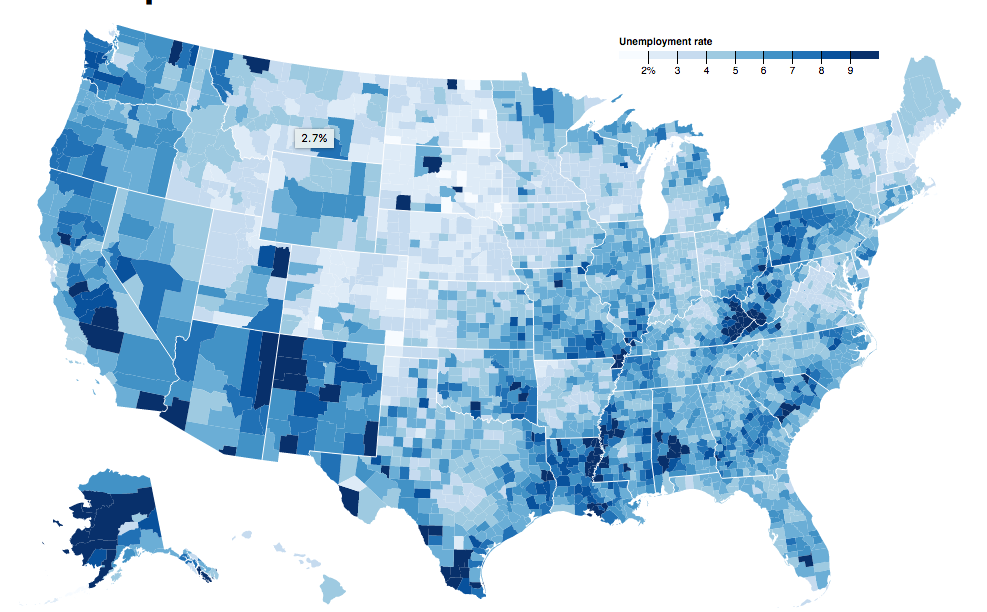
Conclusion
Choose the best tool for the job
Leverage the examples and community available to you
Resources
Make a bar Chart (3 parts): https://bost.ocks.org/mike/bar/
Thinking with Joins: https://bost.ocks.org/mike/join/
The General Update Pattern: https://bl.ocks.org/mbostock/3808218
Resources
More on the data join: https://medium.com/@c_behrens/enter-update-exit-6cafc6014c36
Comparing Libraries: https://www.sitepoint.com/javascript-charting-library-main-contenders/
Gallery of D3 examples: https://github.com/d3/d3/wiki/Gallery
Questions?
Nodevember
By Delaine Wendling
Nodevember
- 1,986


