How to choose your clustering method ?
Or
What should I do if I have a bunch of data in a n-dimensional space and somehow I need to separate it in different groups, but I'm completely lost in the sea of possibilities given by the different available algorithms ?
Felipe Delestro
delestro@biologie.ens.fr
MACHINE LEARNING JOURNAL CLUB
Tem hora que a gente se pergunta, por que é que não se junta tudo numa coisa só? Fernando Anitelli

Sometimes we ask ourselves, why don't we just group it all together? Fernando Anitelli
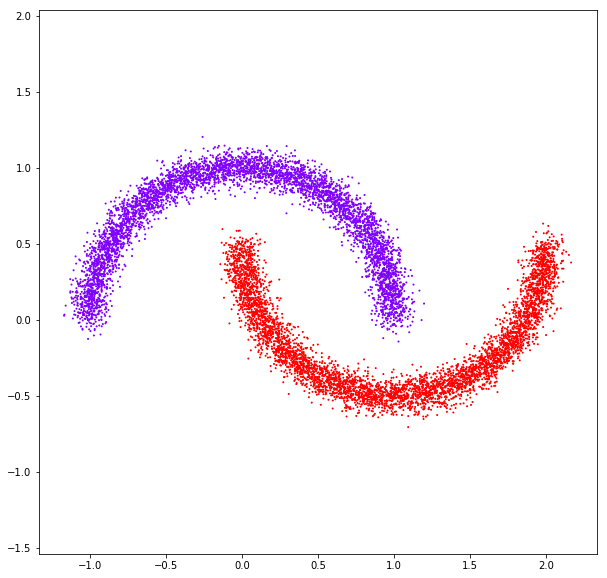
Linear separability
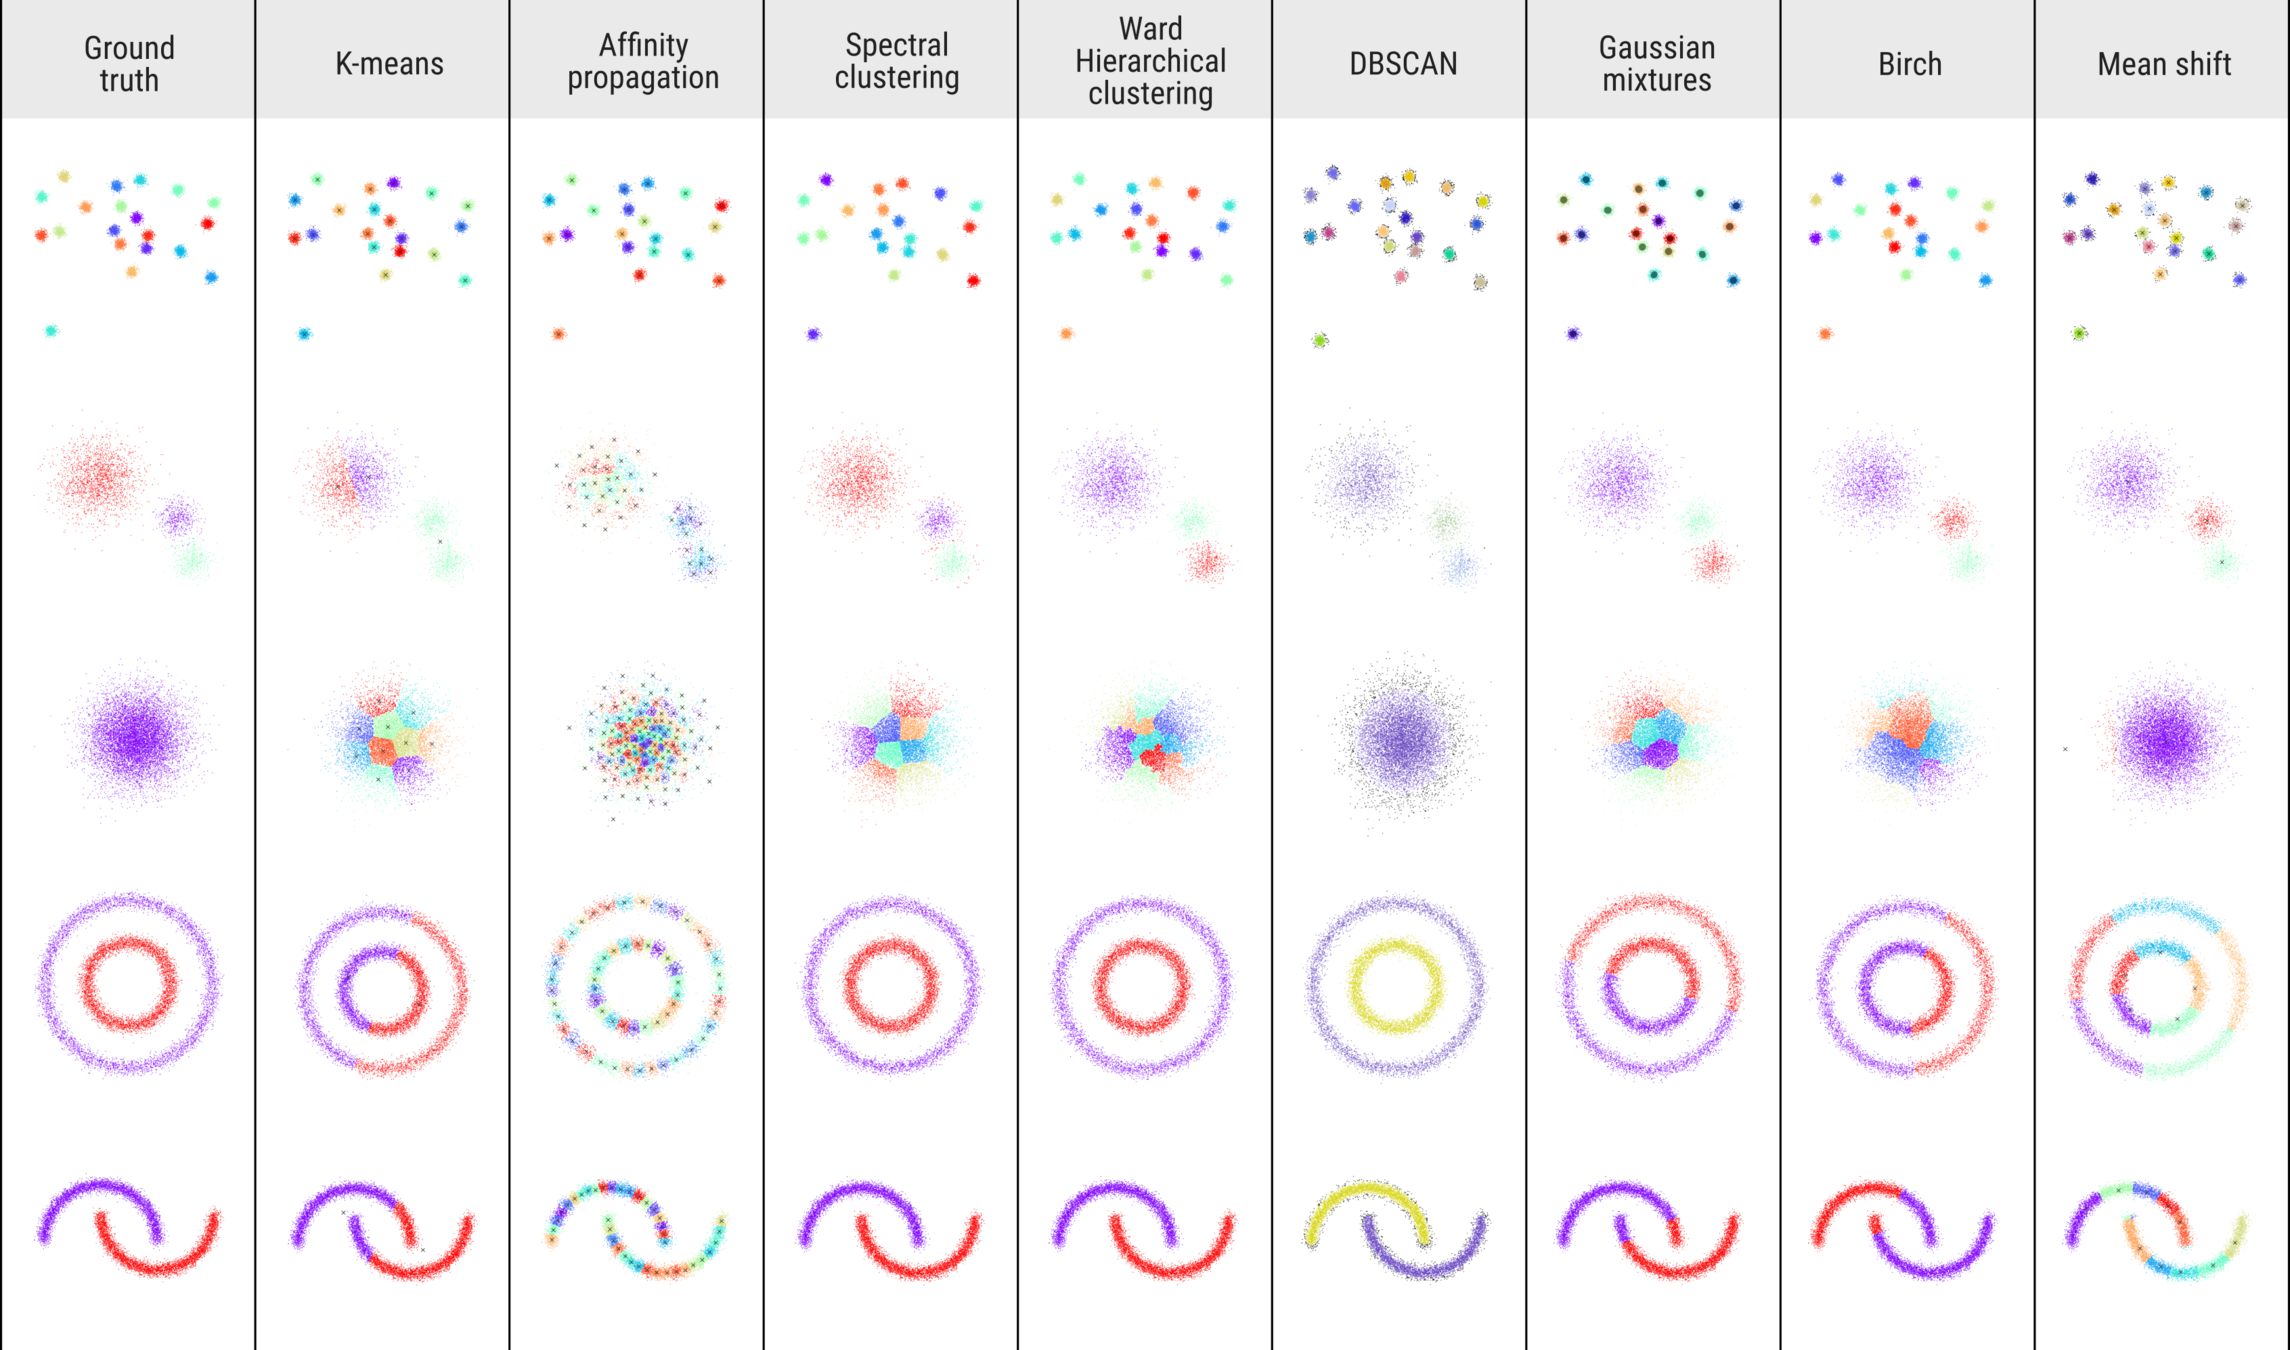
TOY DATA-SETS
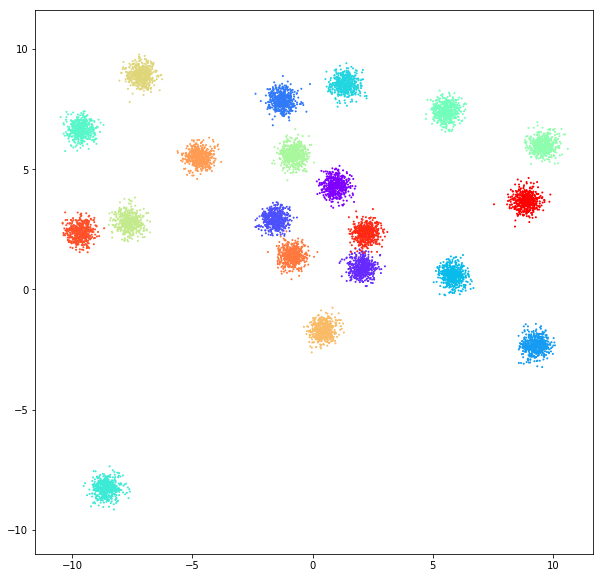
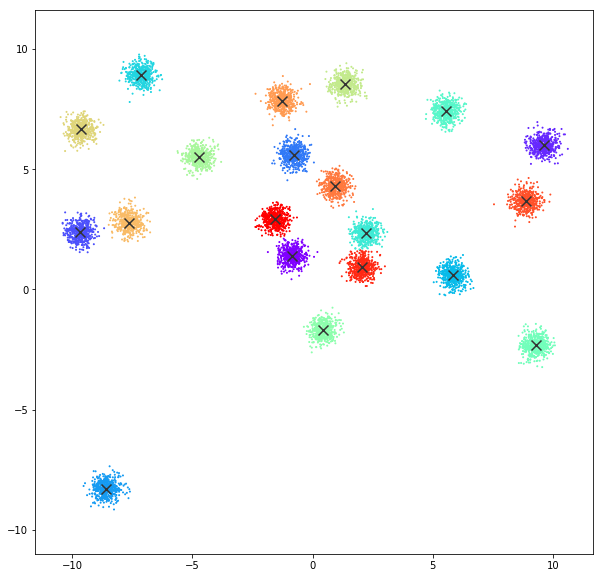
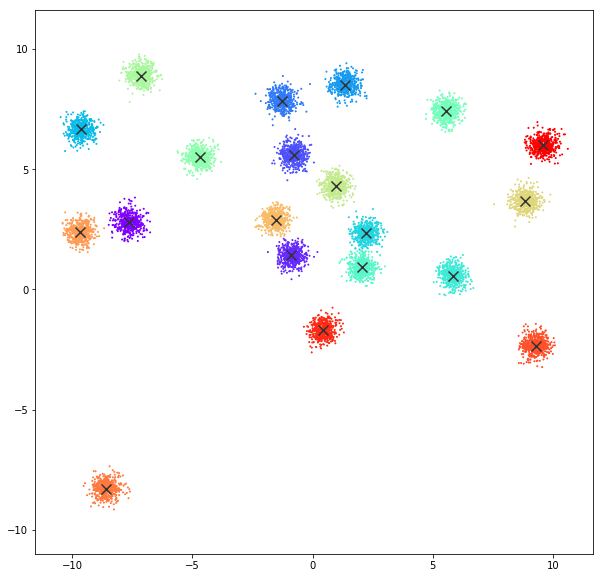
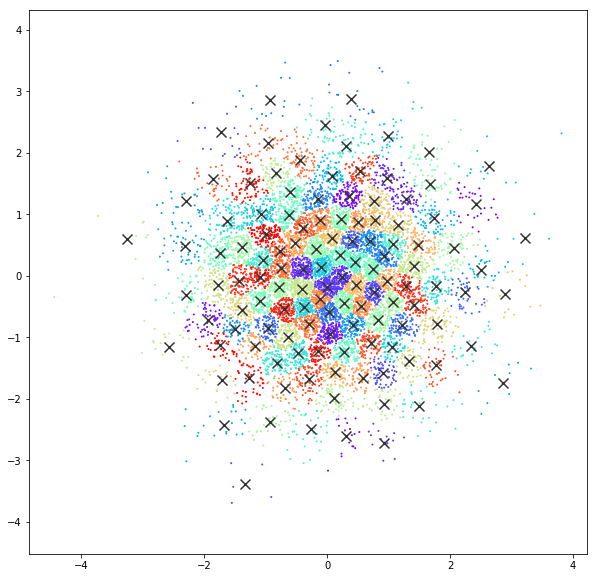
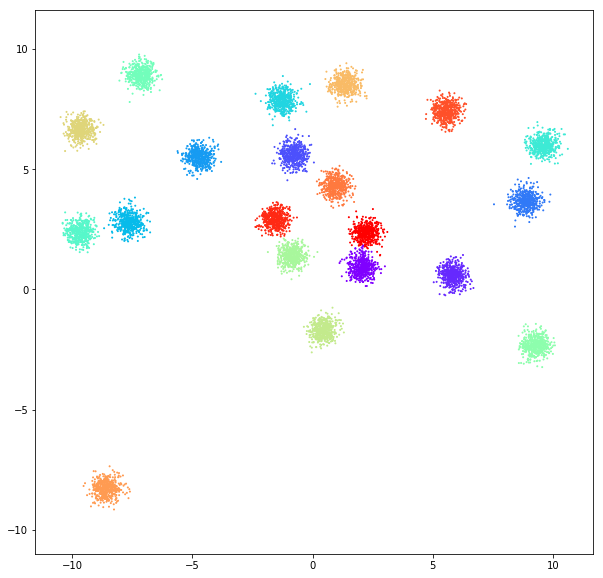
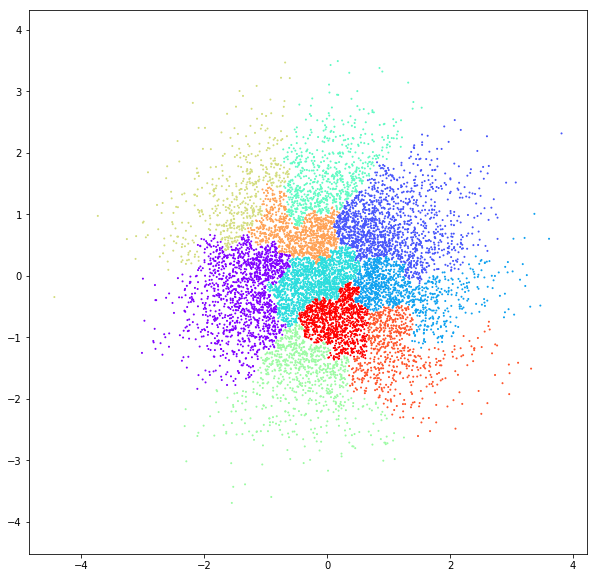
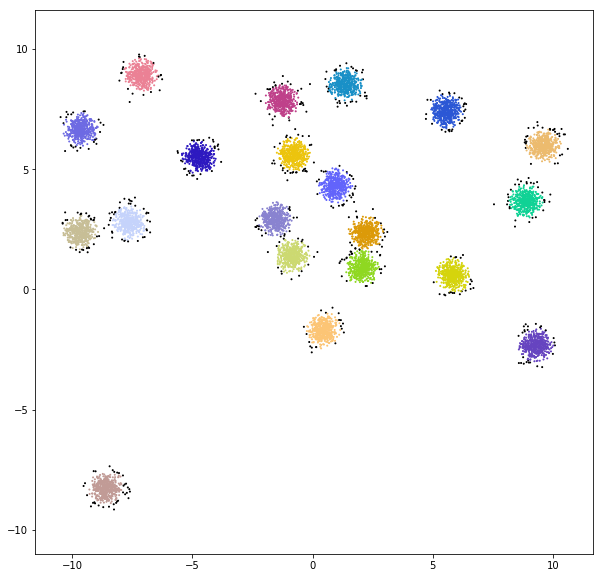
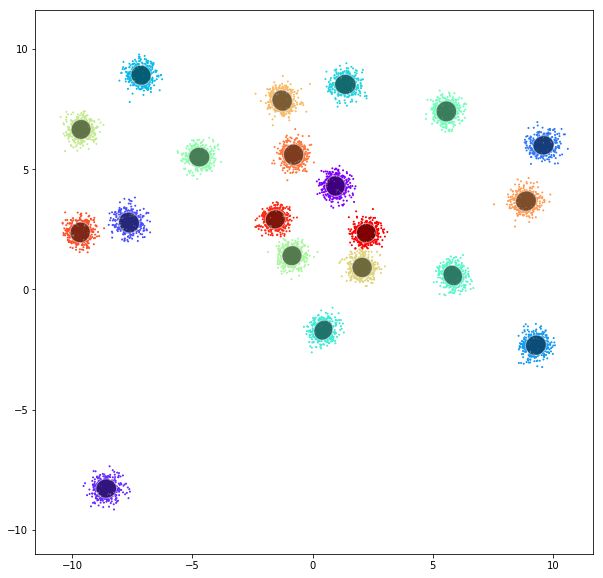
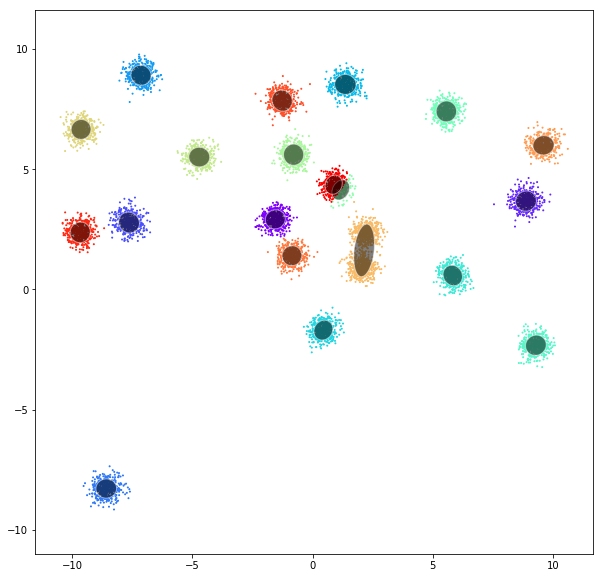
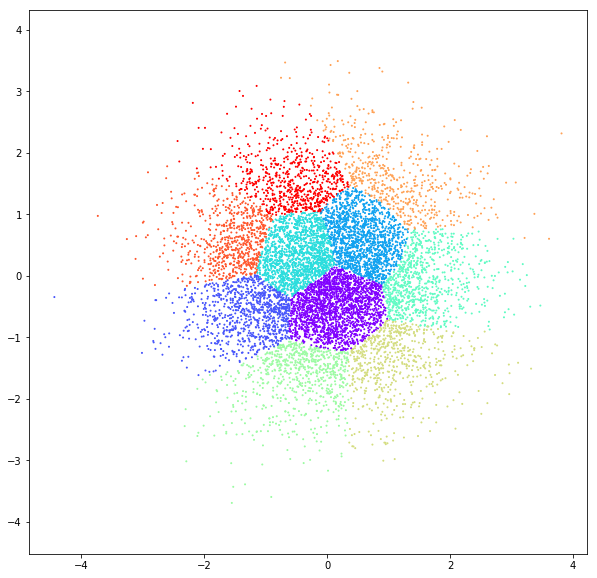
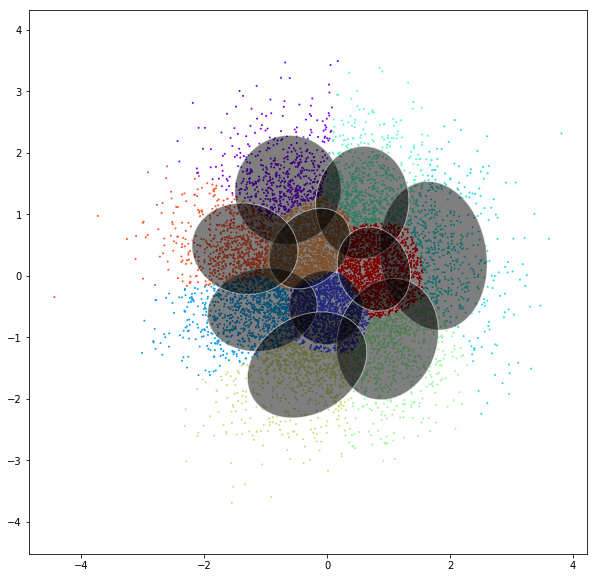
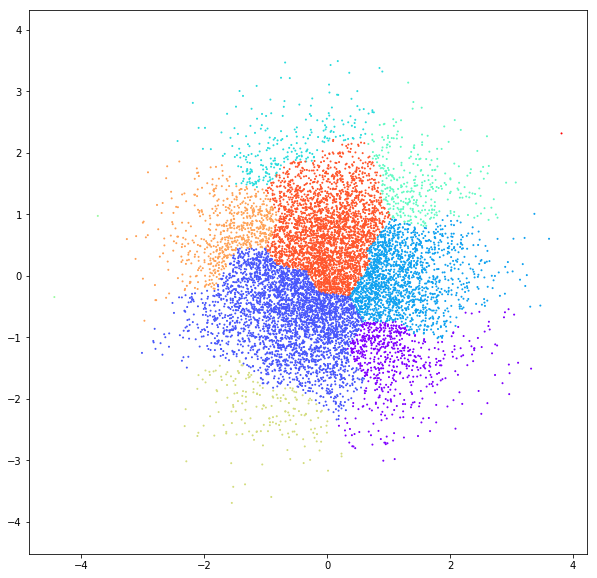
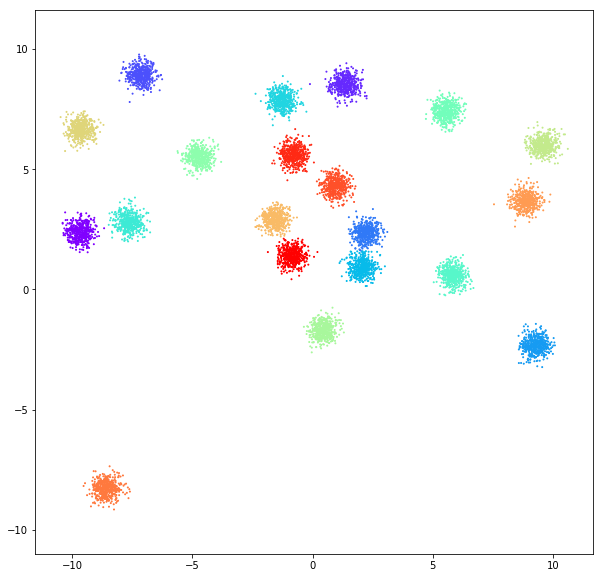
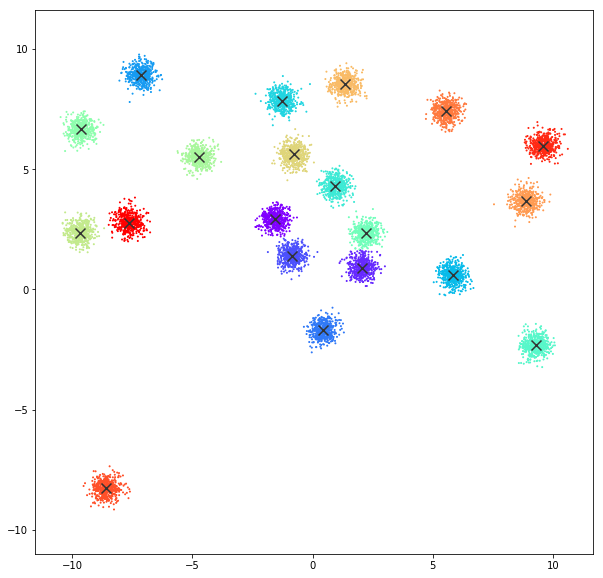
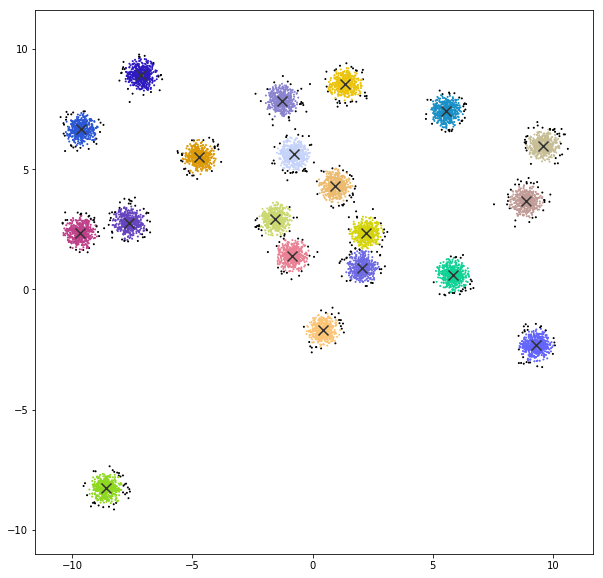
DATASET 01
  n: 10.000

std: 0.3

  k: 20

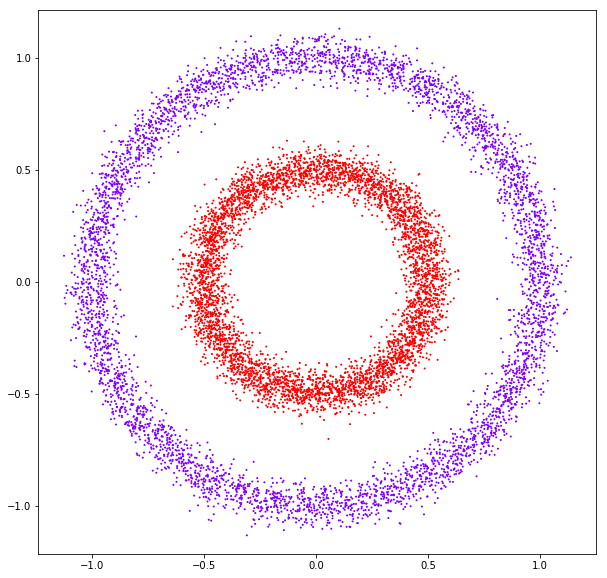
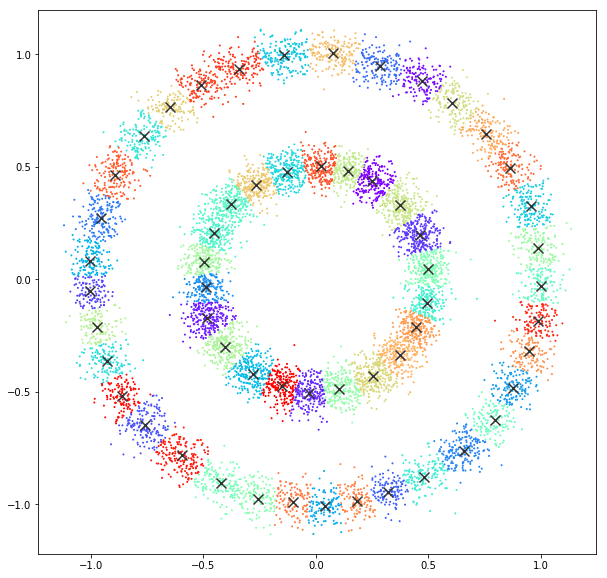
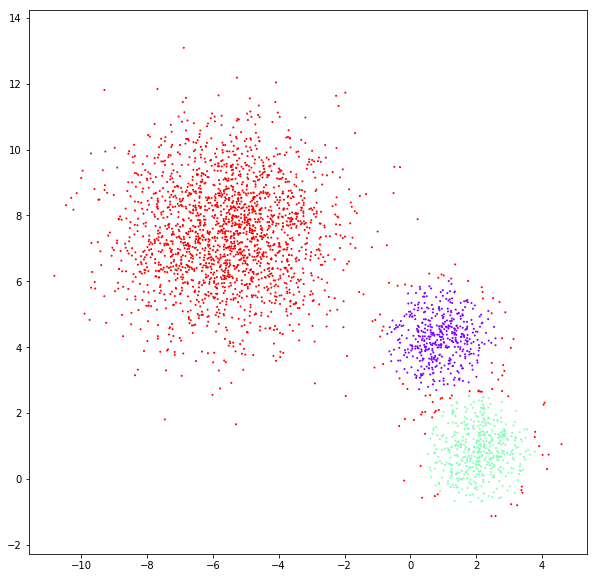
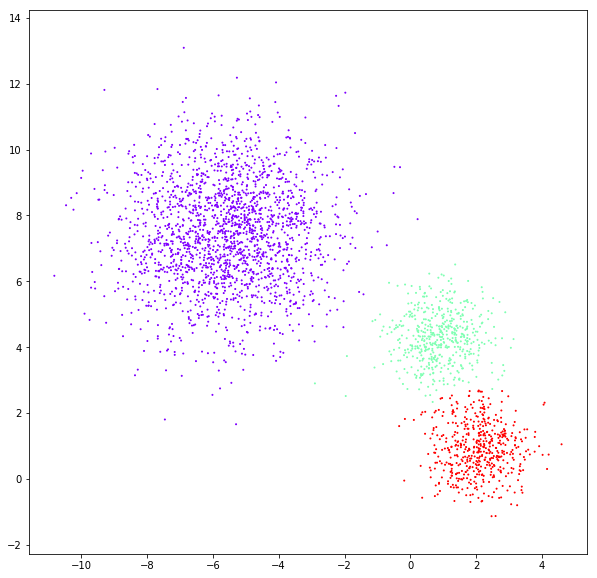
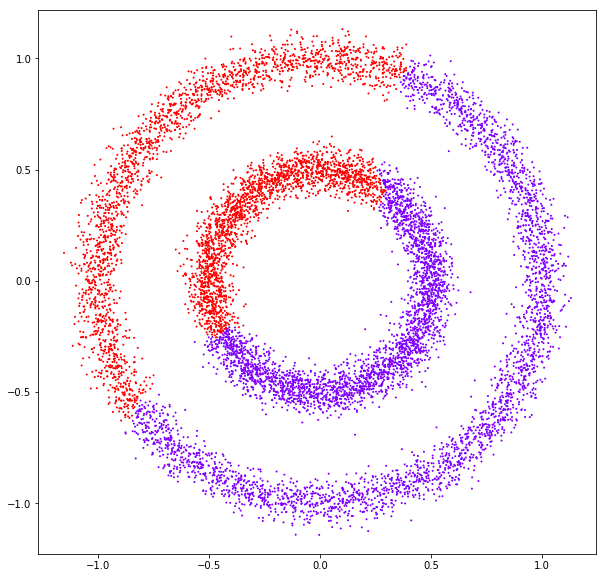
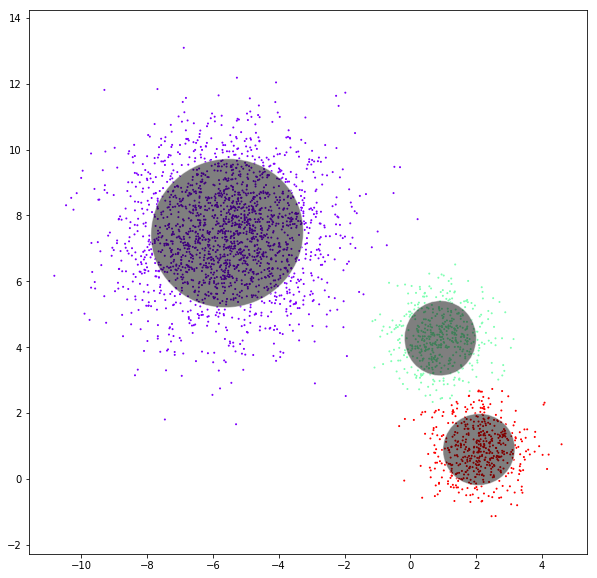
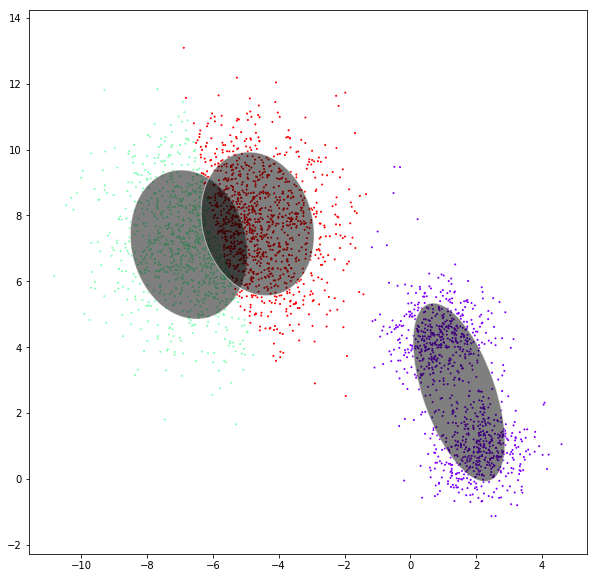
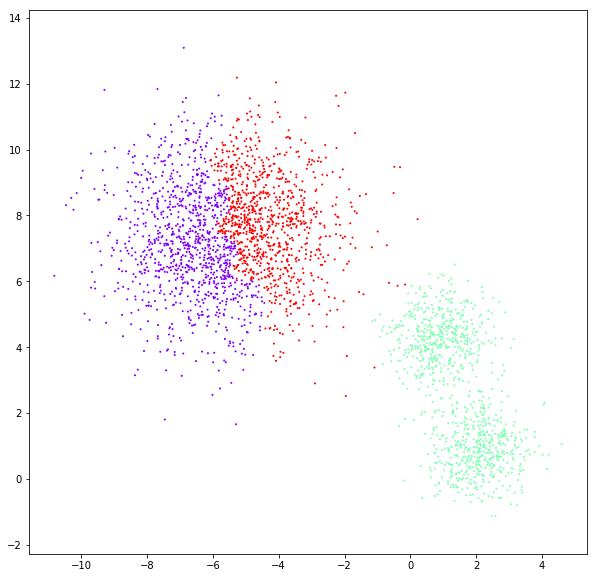
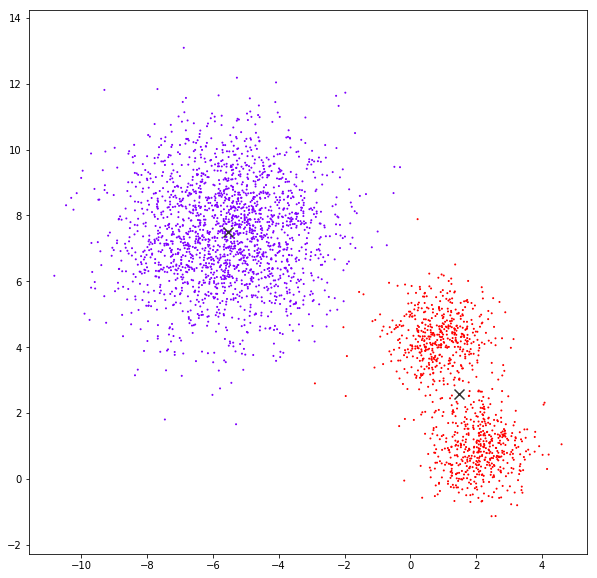
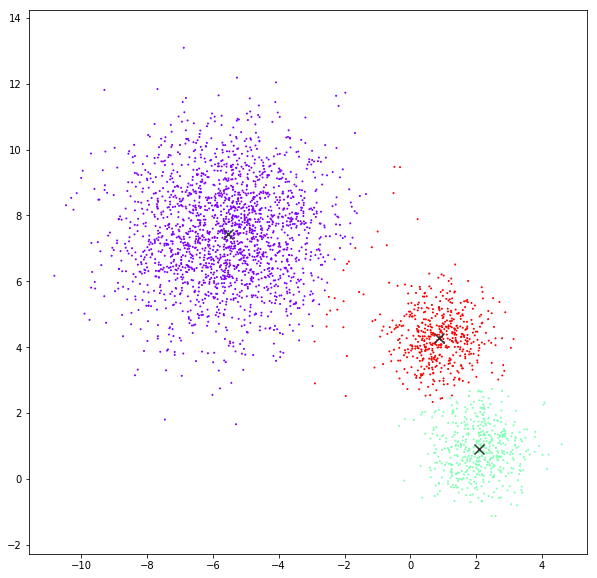
DATASET 02
  n: 10.000 & 20.000

std: 0.8 & 1.6

  k: 3
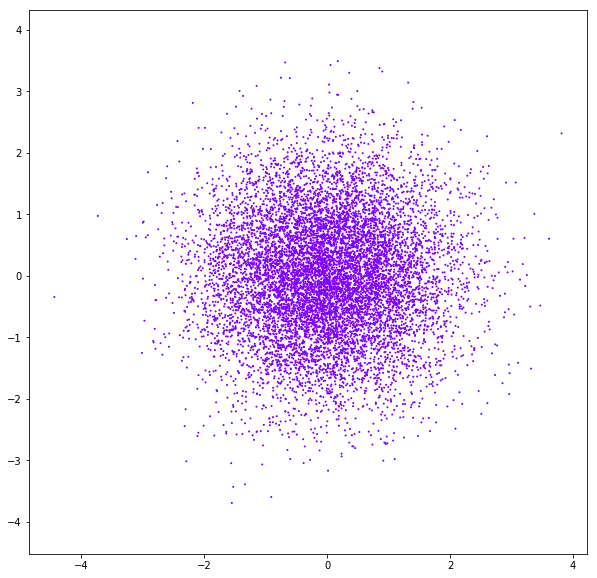
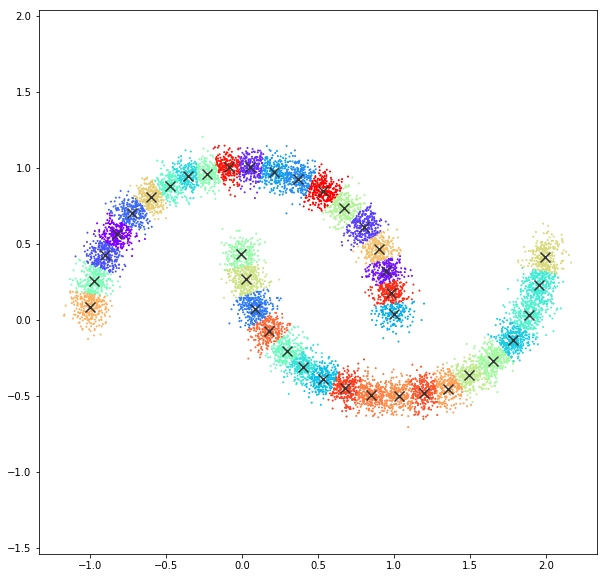
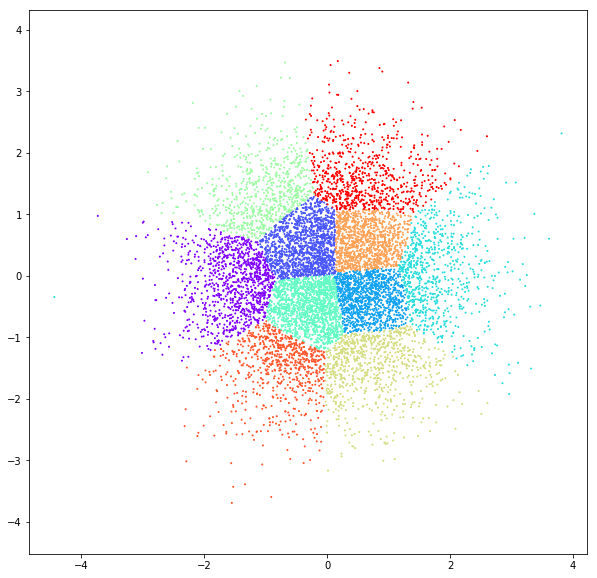
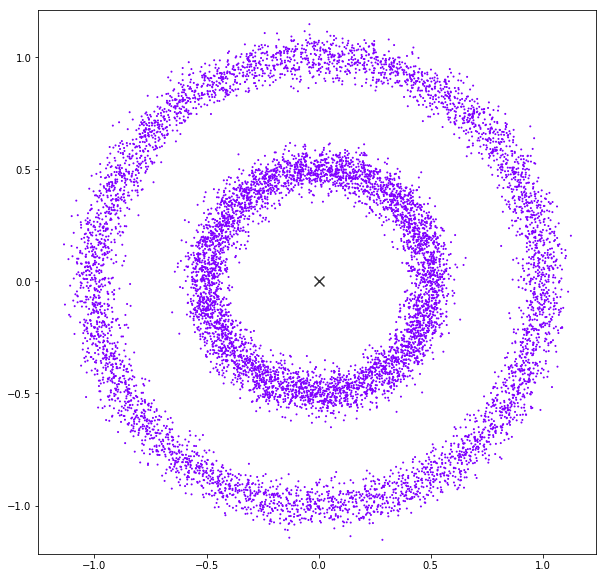
DATASET 03
  n: 10.000

std: 1.0

  k: 1
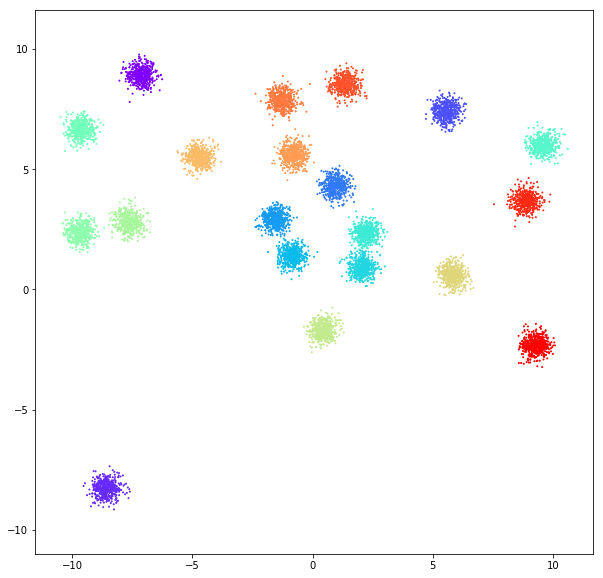
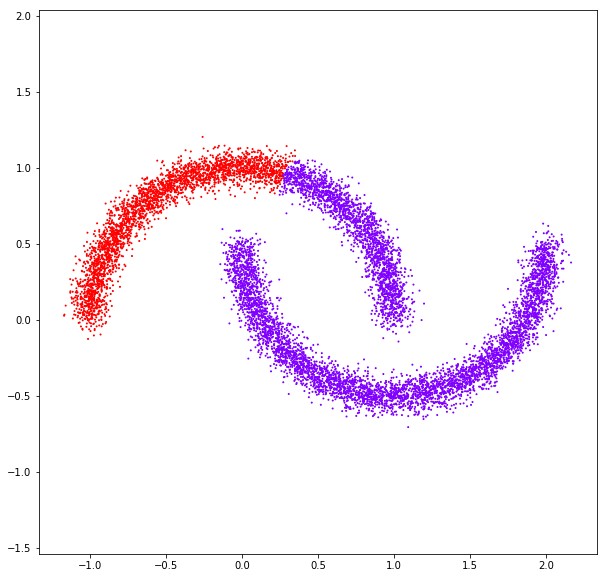
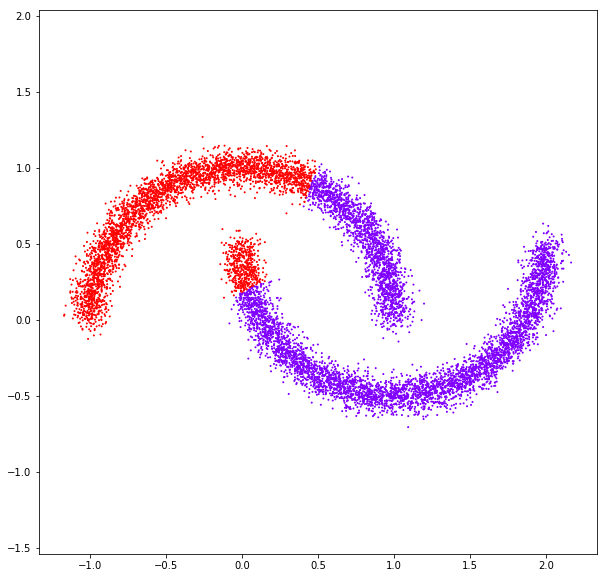
DATASET 04
  n: 10.000

  k: 2

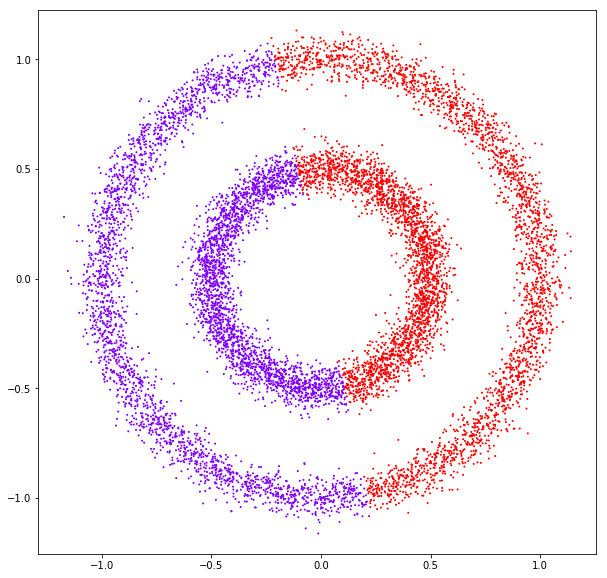
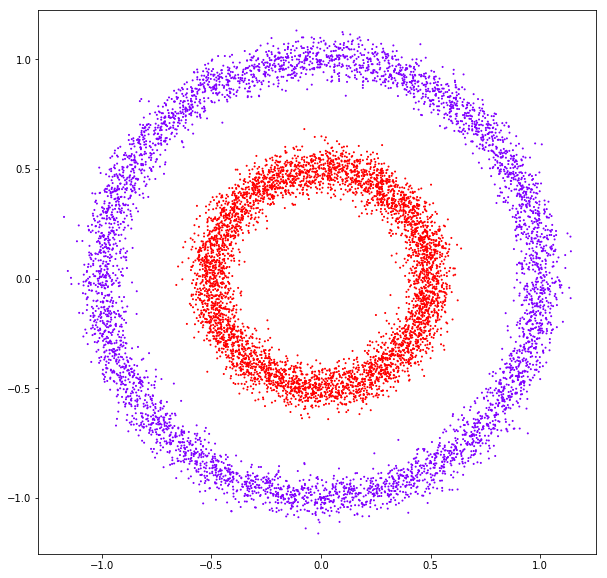
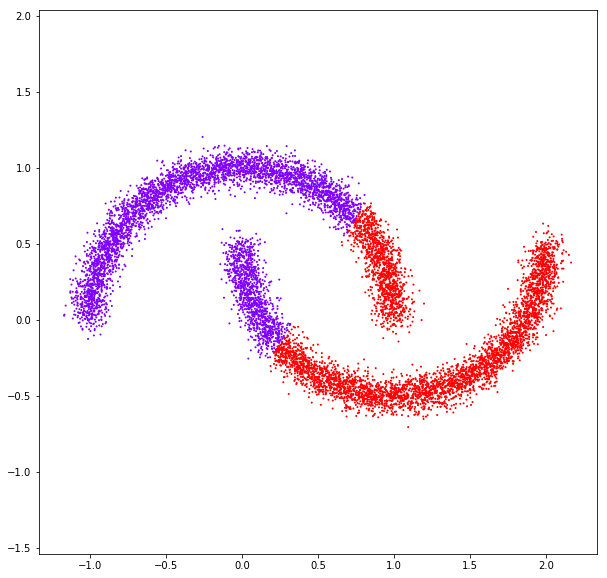
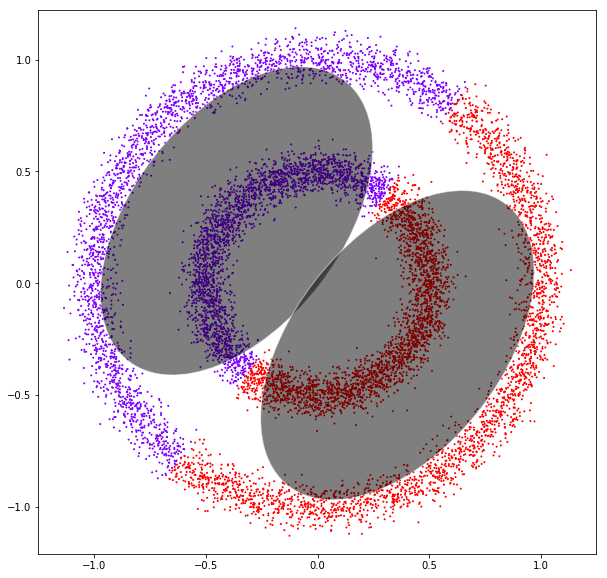
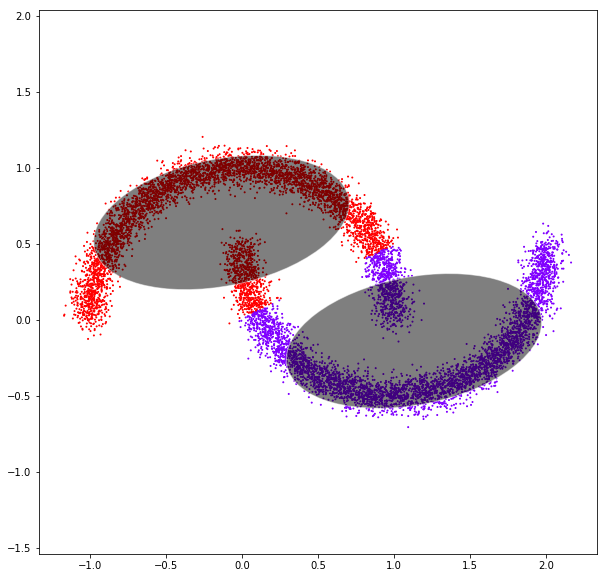
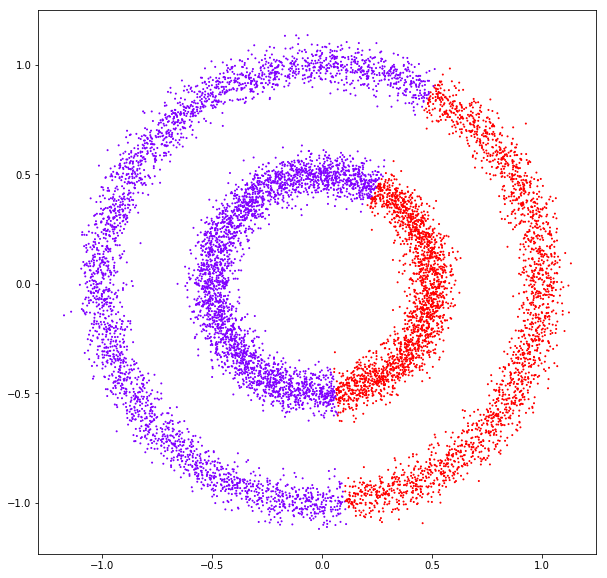
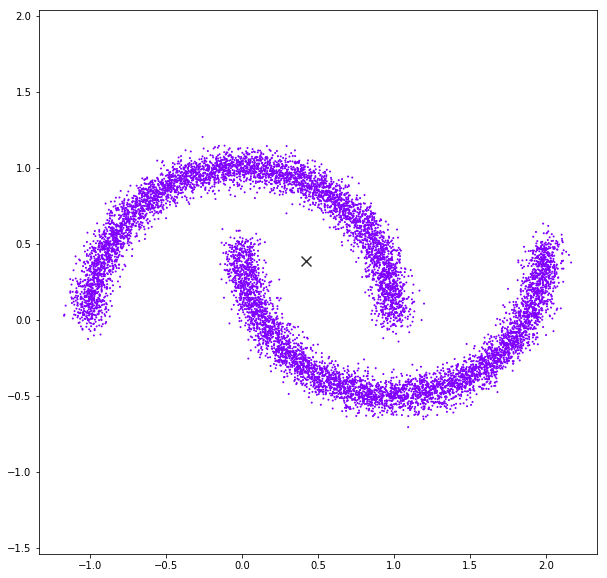
DATASET 05
  n: 10.000

  k: 2
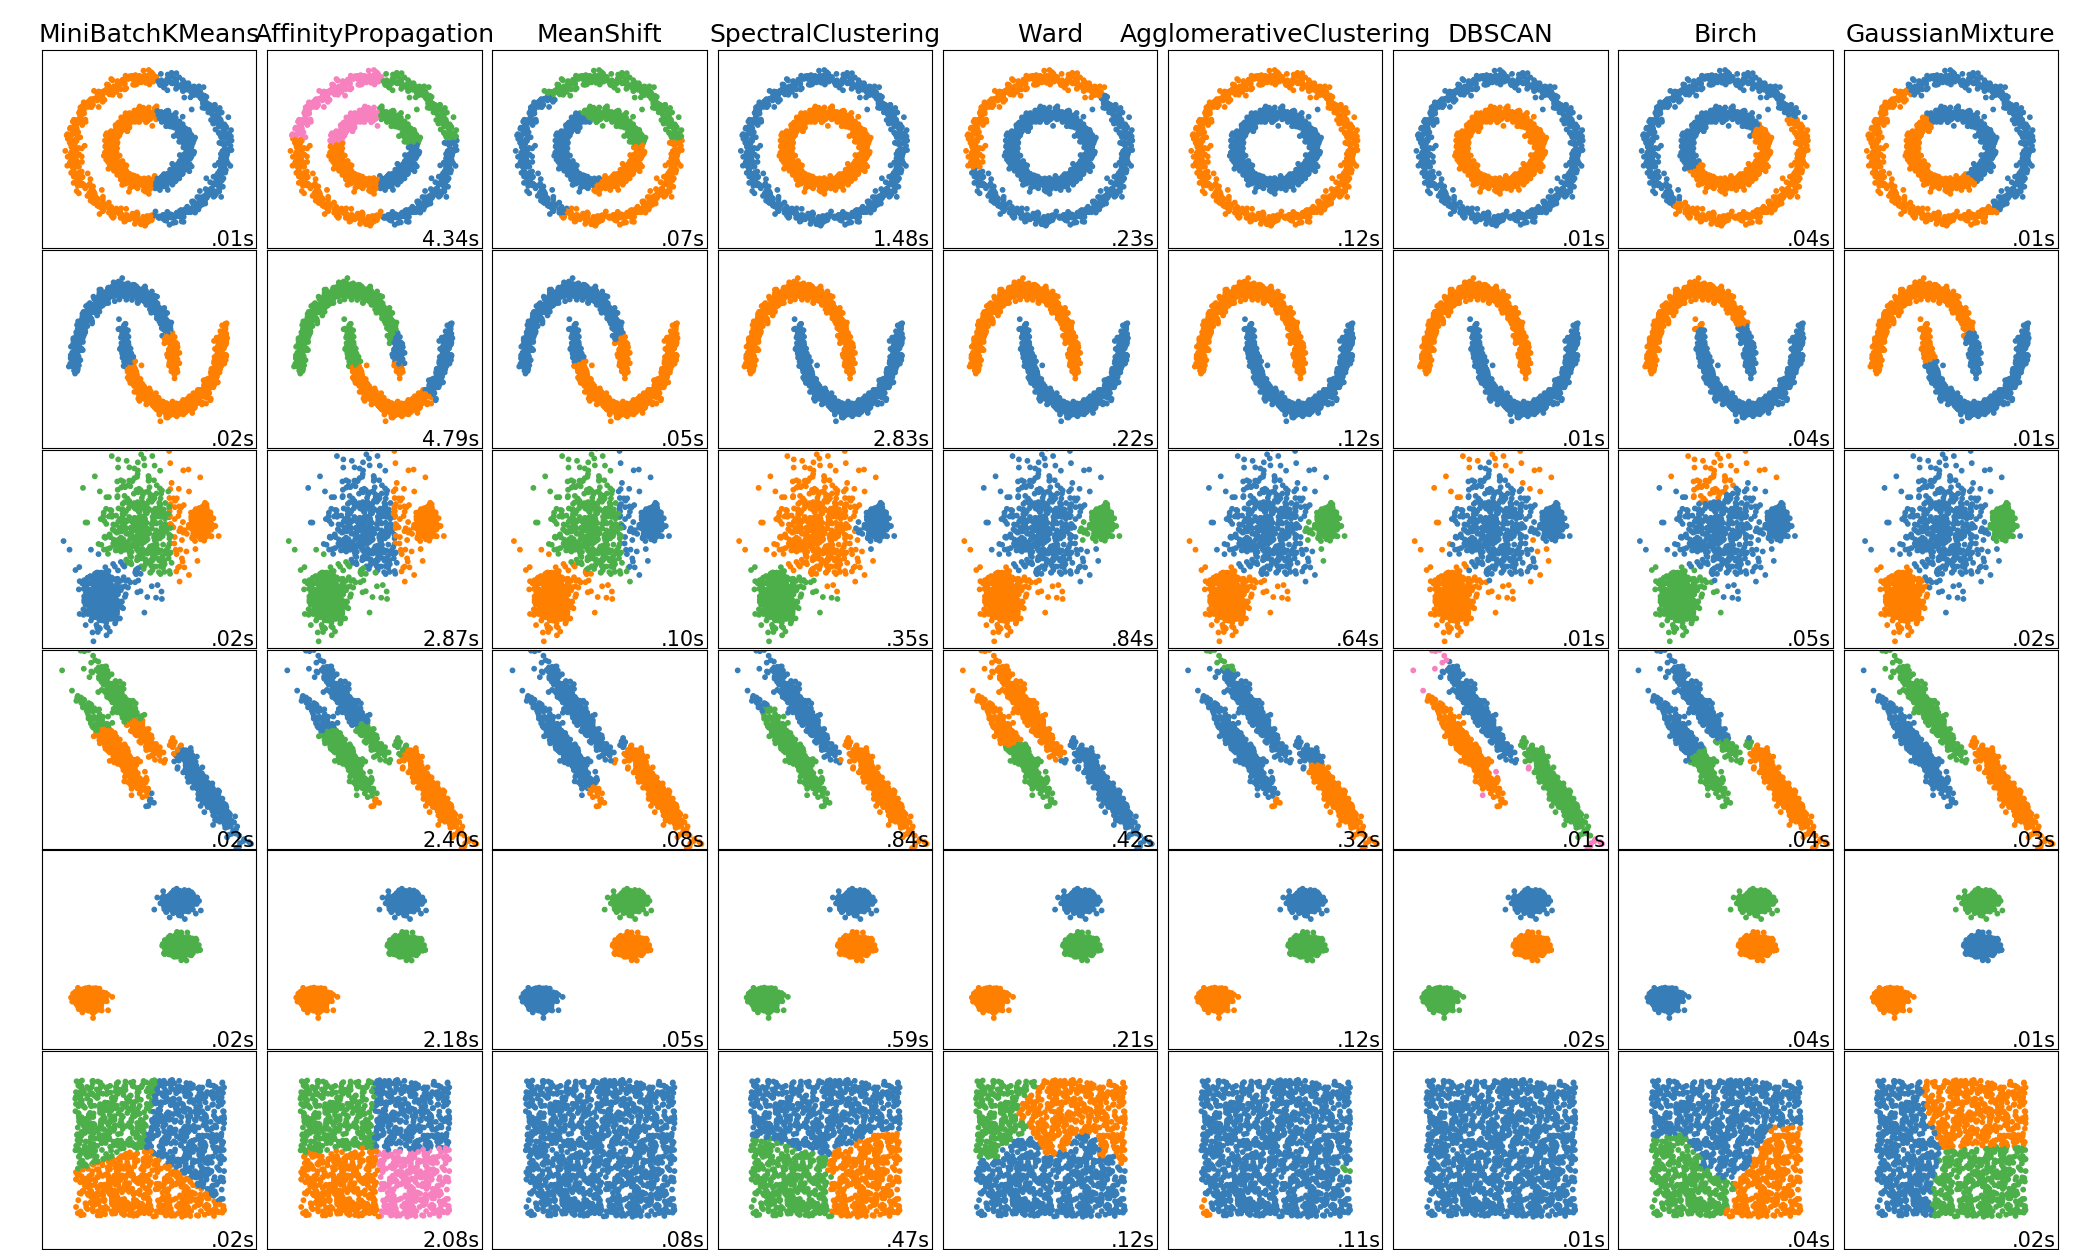
Clustering methods
Methods
- K-Means
- Affinity propagation
- Spectral clustering
- Ward hierarchical clustering
- DBSCAN
- Gaussian mixtures
- Birch
- Mean shift
K-Means
The KMeans algorithm clusters data by trying to separate samples in n groups of equal variance, minimizing a criterion known as the inertia or within-cluster sum-of-squares. This algorithm requires the number of clusters to be specified. It scales well to large number of samples and has been used across a large range of application areas in many different fields.
K-means
DATASET 01
K-means
K-means
K-means
random initialisation
K-means
k-means++
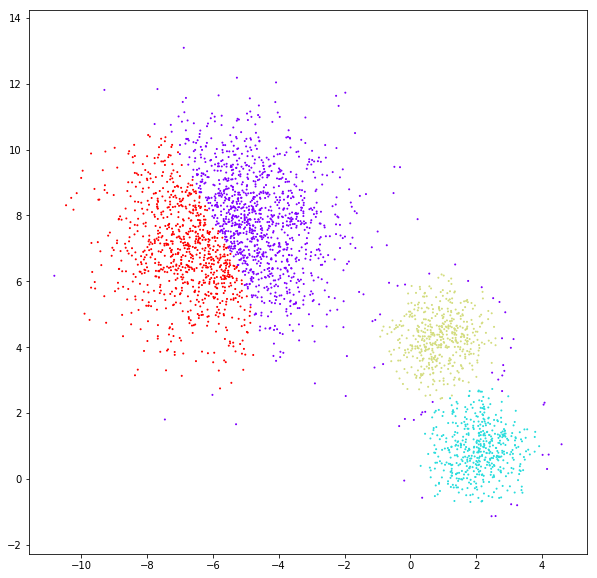
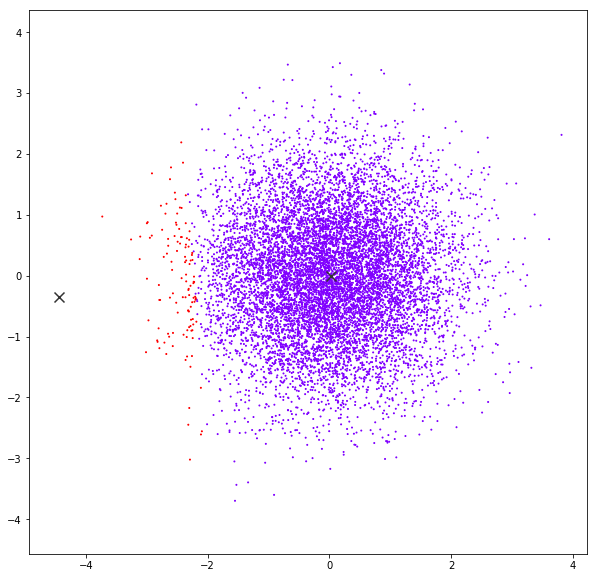
DATASET 02
K-means
K-means
K-means
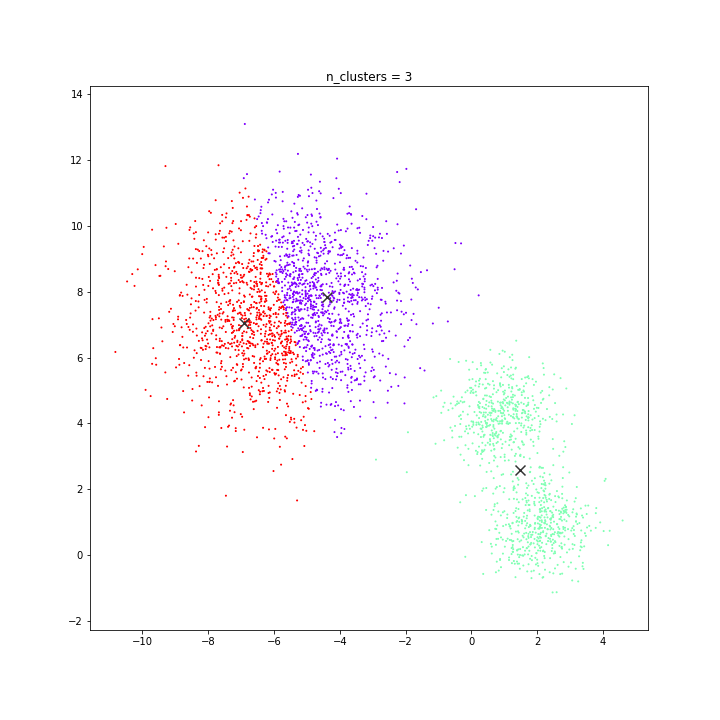
K-means
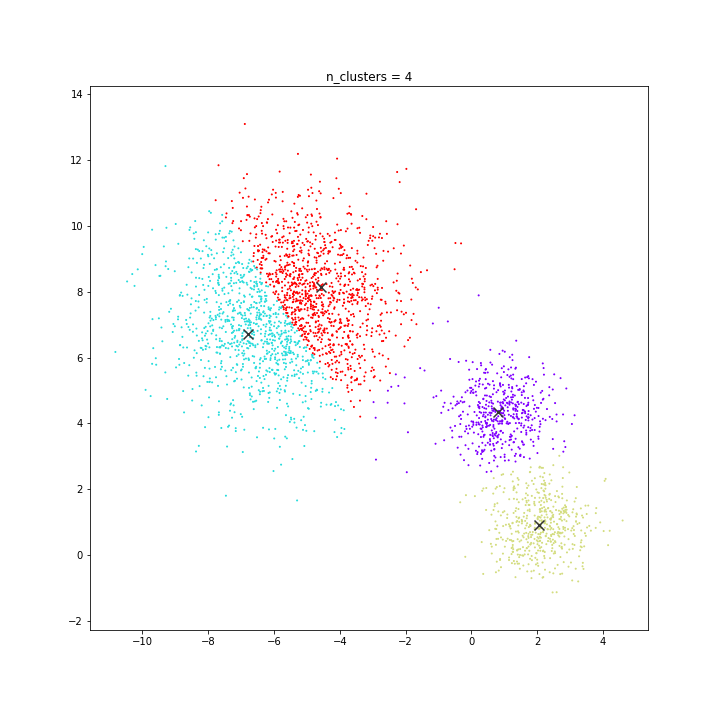
K-means
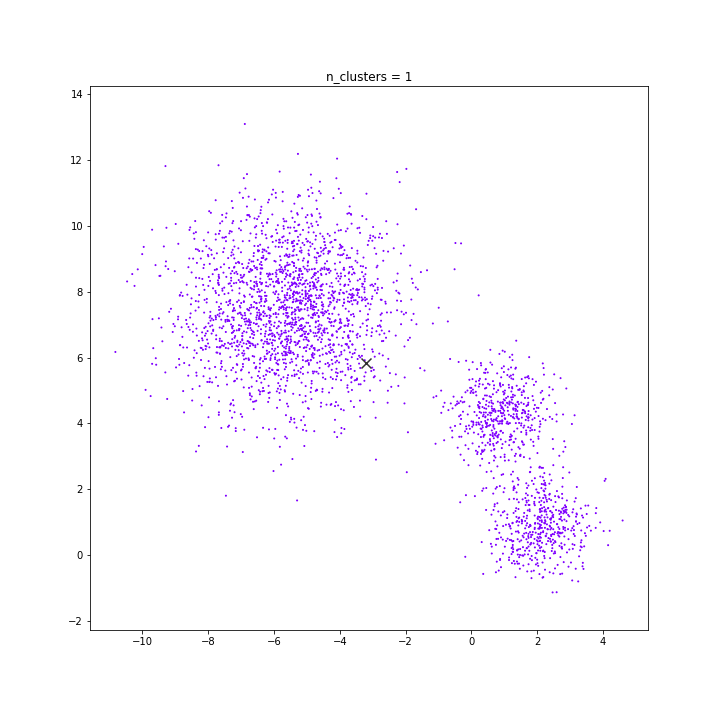
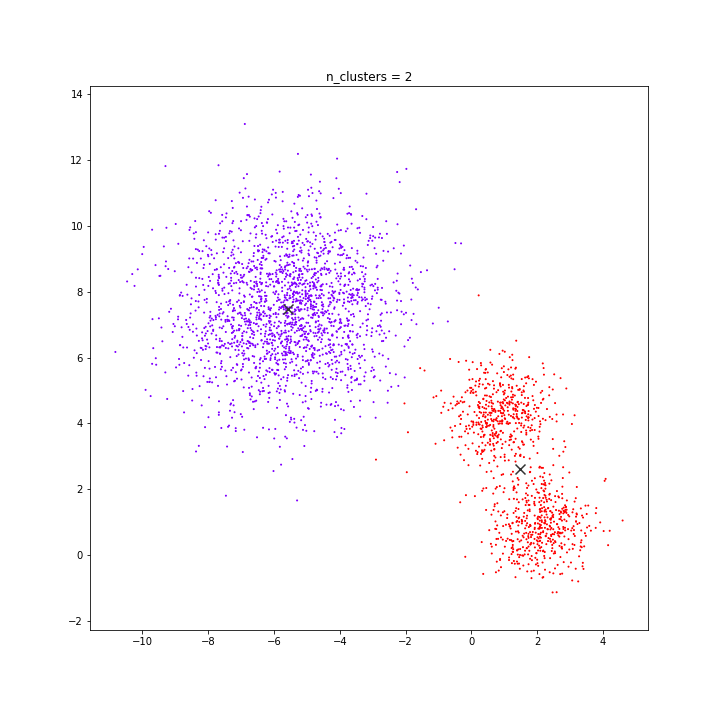
DATASET 03
K-means
K-means
K-means
DATASET 04
K-means
DATASET 05
K-means
K-means
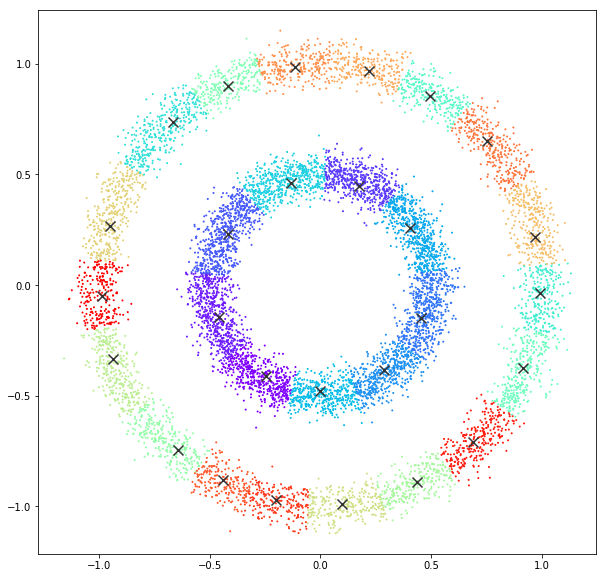
AFFINITY PROPAGATION
AffinityPropagation creates clusters by sending messages between pairs of samples until convergence. A dataset is then described using a small number of exemplars, which are identified as those most representative of other samples. The messages sent between pairs represent the suitability for one sample to be the exemplar of the other, which is updated in response to the values from other pairs. This updating happens iteratively until convergence, at which point the final exemplars are chosen, and hence the final clustering is given.
Affinity propagation
DATASET 01
Affinity propagation
damping = 0.9
Affinity propagation
damping = 0.9
Affinity propagation
DATASET 02
Affinity propagation
DATASET 03
Affinity propagation
DATASET 04
Affinity propagation
DATASET 05
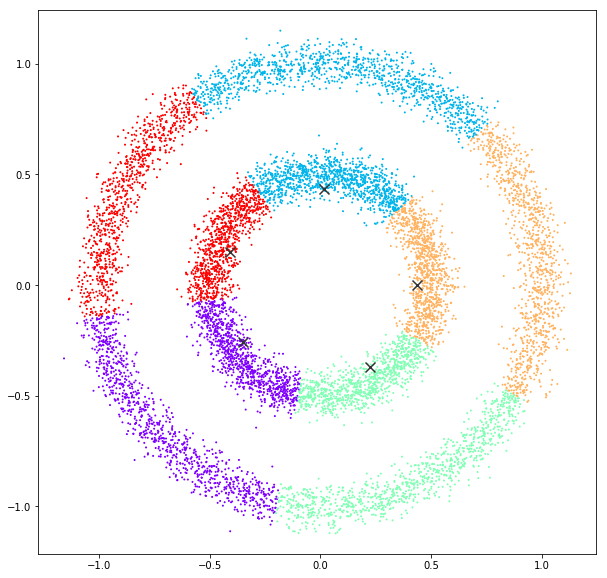
SPECTRAL CLUSTERING
It does a low-dimension embedding of the affinity matrix between samples, followed by a KMeans in the low dimensional space. It is especially efficient if the affinity matrix is sparse and the pyamg module is installed. SpectralClustering requires the number of clusters to be specified. It works well for a small number of clusters but is not advised when using many clusters.
Spectral clustering
DATASET 01
Spectral clustering
Spectral clustering
DATASET 02
Spectral clustering
Spectral clustering
DATASET 03
Spectral clustering
DATASET 04
affinity: rbf
affinity: nearest neighbors
Spectral clustering
Spectral clustering
DATASET 05
affinity: rbf
affinity: nearest neighbors

Spectral clustering
WARD
Hierarchical clustering is a general family of clustering algorithms that build nested clusters by merging or splitting them successively. This hierarchy of clusters is represented as a tree (or dendrogram). The root of the tree is the unique cluster that gathers all the samples, the leaves being the clusters with only one sample. Ward minimizes the sum of squared differences within all clusters. It is a variance-minimizing approach and in this sense is similar to the k-means objective function but tackled with an agglomerative hierarchical approach.
Ward Hierarchical
Ward Hierarchical
Ward Hierarchical
Ward Hierarchical
DATASET 04
Ward Hierarchical
Ward Hierarchical
# connectivity matrix for structured Ward
connectivity = kneighbors_graph(X, n_neighbors=10, include_self=False)
# make connectivity symmetric
connectivity = 0.5 * (connectivity + connectivity.T)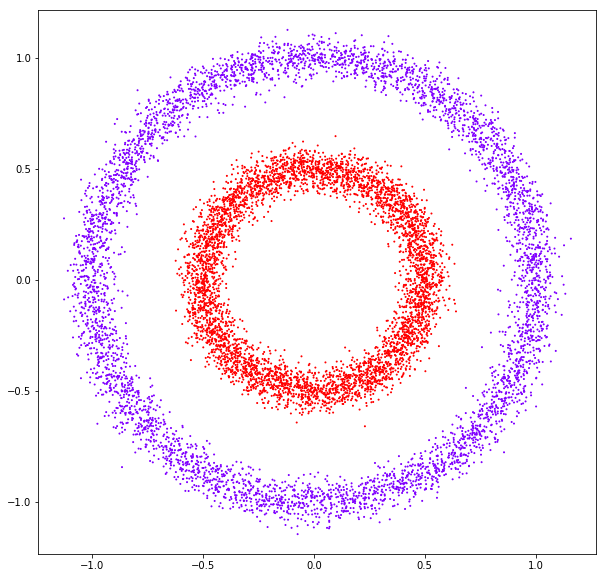
Ward Hierarchical
Ward Hierarchical
DATASET 05
Ward Hierarchical
Ward Hierarchical
DBSCAN
The DBSCAN algorithm views clusters as areas of high density separated by areas of low density. Due to this rather generic view, clusters found by DBSCAN can be any shape, as opposed to k-means which assumes that clusters are convex shaped. The central component to the DBSCAN is the concept of core samples, which are samples that are in areas of high density. A cluster is therefore a set of core samples, each close to each other (measured by some distance measure) and a set of non-core samples that are close to a core sample (but are not themselves core samples).
DBSCAN
DATASET 01
DBSCAN
DBSCAN
DBSCAN
DATASET 02
DBSCAN
DBSCAN
DATASET 03
DBSCAN
DBSCAN
DATASET 04
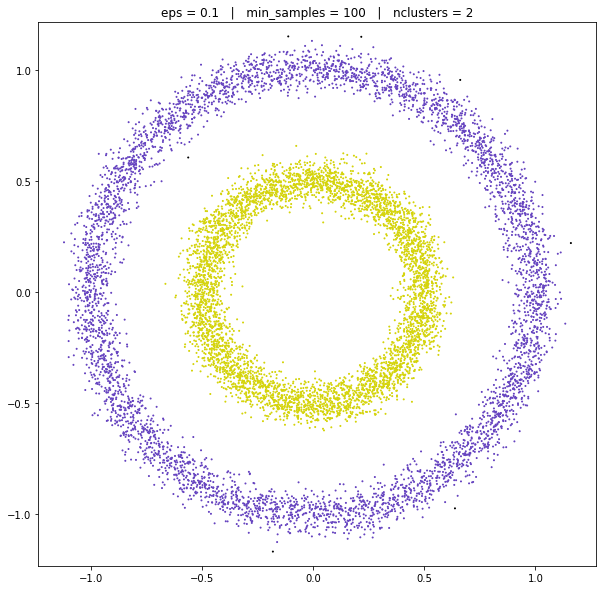
DBSCAN
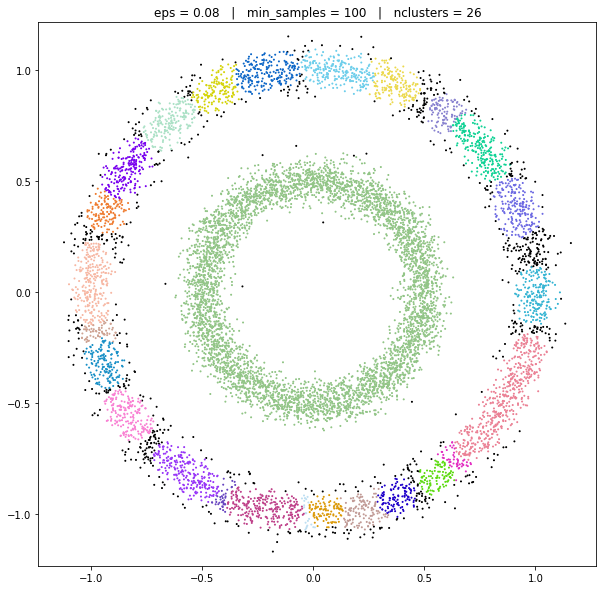
DBSCAN
DBSCAN
DATASET 05
DBSCAN
GAUSSIAN MIXTURES
A Gaussian mixture model is a probabilistic model that assumes all the data points are generated from a mixture of a finite number of Gaussian distributions with unknown parameters. One can think of mixture models as generalizing k-means clustering to incorporate information about the covariance structure of the data as well as the centers of the latent Gaussians.
Gaussian mixtures
DATASET 01
Gaussian mixtures
Gaussian mixtures
Gaussian mixtures
DATASET 02
Gaussian mixtures
Gaussian mixtures
Gaussian mixtures
DATASET 03
Gaussian mixtures
DATASET 04
Gaussian mixtures
DATASET 05
BIRCH
Balanced Iterative Reducing and Clustering using Hierarchies is an unsupervised data mining algorithm used to perform hierarchical clustering over particularly large data-sets. An advantage of BIRCH is its ability to incrementally and dynamically cluster incoming, multi-dimensional metric data points in an attempt to produce the best quality clustering for a given set of resources (memory and time constraints).
Birch
DATASET 01
Birch

Birch
DATASET 02
Birch

Birch
threshold = 0.10
Birch
Birch
DATASET 03
Birch
Birch
DATASET 04
Birch
Birch
DATASET 05
Birch
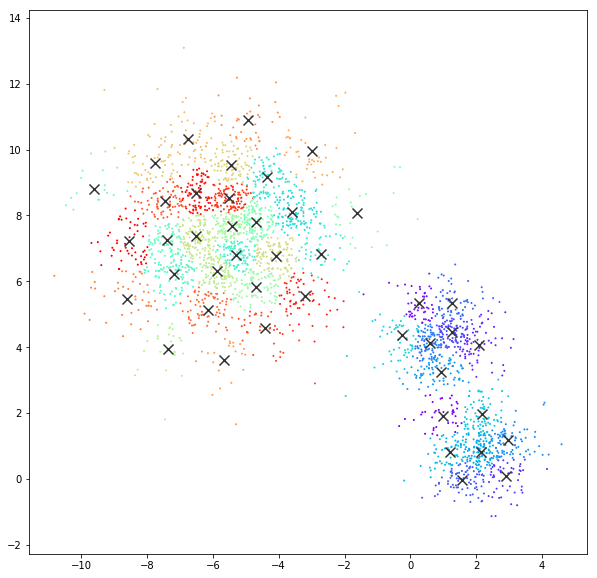
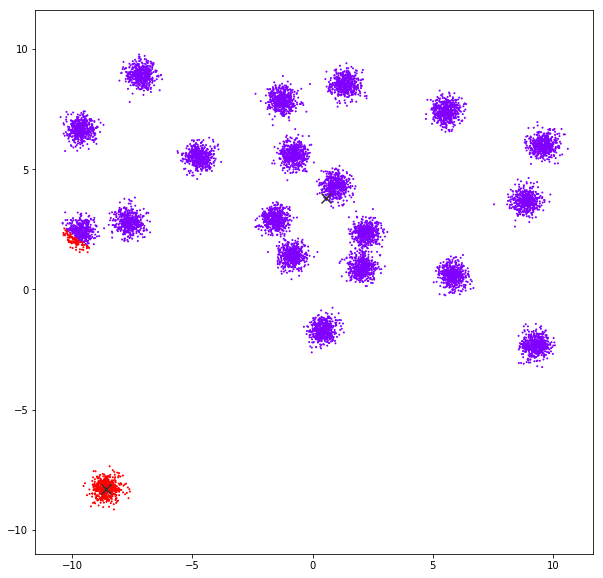
Mean Shift
Mean shift clustering aims to discover “blobs” in a smooth density of samples. It is a centroid-based algorithm, which works by updating candidates for centroids to be the mean of the points within a given region. These candidates are then filtered in a post-processing stage to eliminate near-duplicates to form the final set of centroids.
Mean shift
DATASET 01
Mean shift
bandwidth = estimate_bandwidth(X, quantile=0.04)Mean shift
Mean shift
bandwidth quantile = 0.04
Mean shift
bandwidth quantile = 0.04 | cluster_all=False
Mean Shift
DATASET 02
Mean Shift
Mean Shift
bandwidth quantile = 0.15
DATASET 03
Mean Shift
Mean Shift
DATASET 04
Mean Shift
Mean Shift
Mean Shift
bandwidth quantile = 0.10
Mean Shift
bandwidth quantile = 0.05
DATASET 05
Mean Shift
Mean Shift
Mean Shift
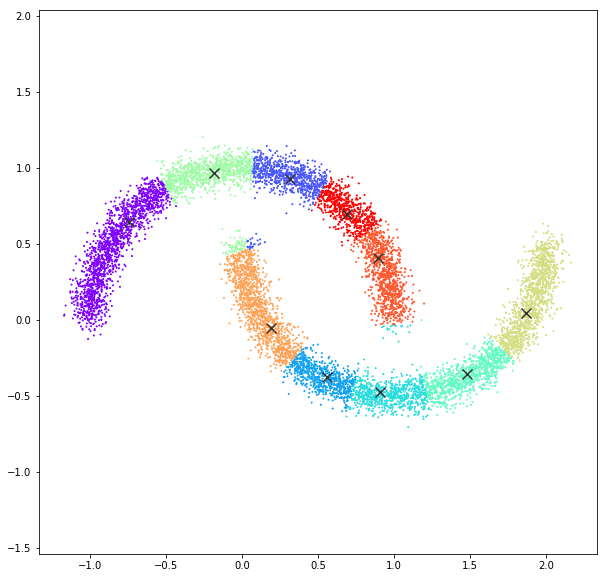
bandwidth quantile = 0.10
Summary
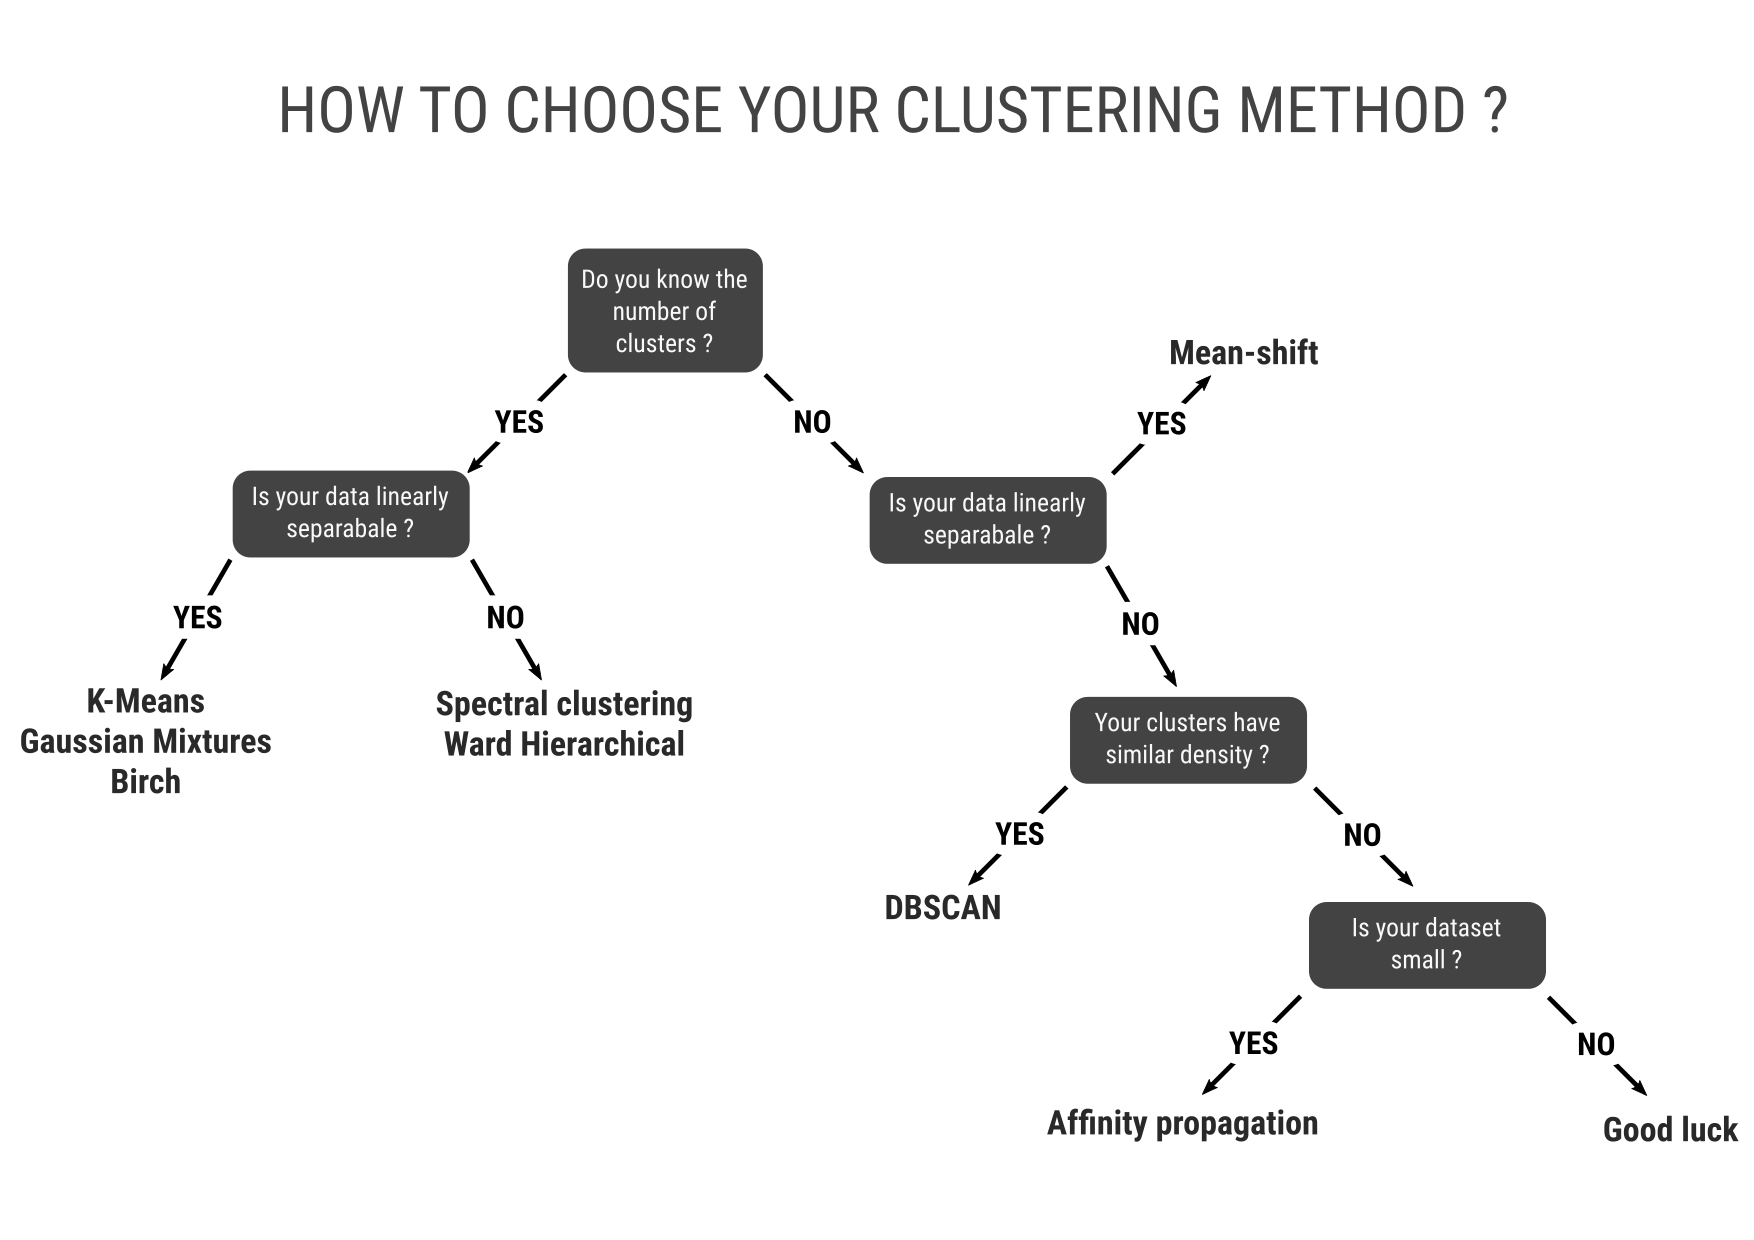
How to choose your clustering method?
By Felipe Delestro


