follow the slides live at
https://slides.com/delestro/phd-defense/live
A multiple cell tracking method dedicated to the analysis of memory formation in vivo
Felipe Delestro
25th October 2018
PhD defense
under the supervision of Auguste Genovesio







MELANIE PEDRAZZANI
LISA SCHEUNEMANN
Gènes et Dynamique des Systèmes de Mémoire
ESPCI

THOMAS
PREAT
Bio-Imagerie Computationnelle et Bioinformatique
IBENS


AUGUSTE
GENOVESIO
FELIPE
DELESTRO

If the brain were so simple we could understand it, we would be so simple we couldn't. Lyall Watson


Homo sapiens
5cm
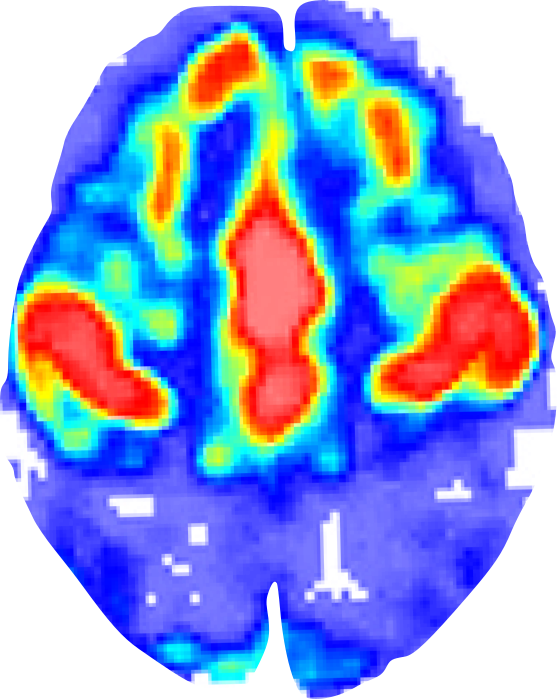
Bandettini PA,
Twenty years of functional MRI: The science and the stories.
Neuroimage. 62(2):575–588. (2012)

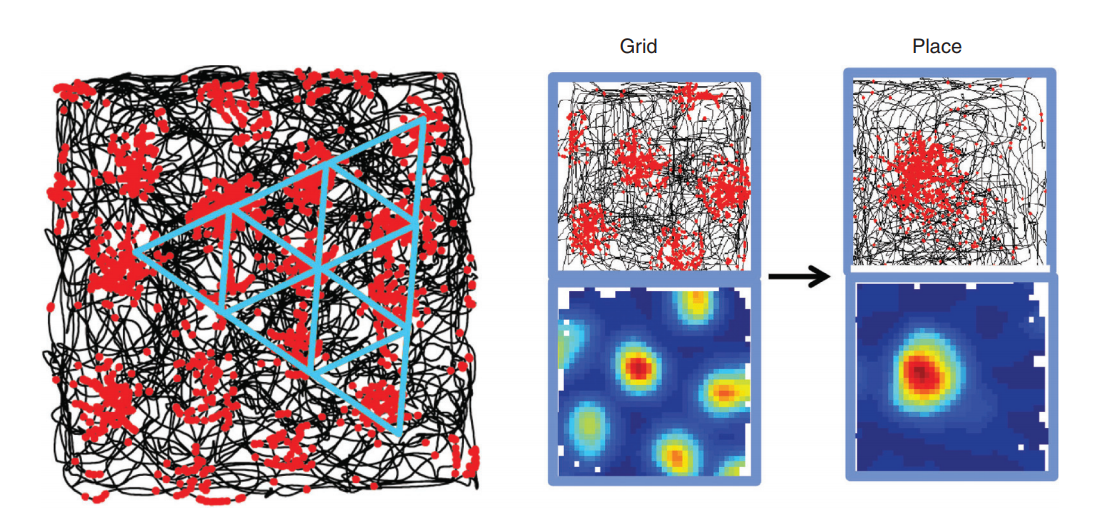
Mus musculus

Homo sapiens
5cm

Moser M-B, Rowland DC, Moser EI.
Place Cells, Grid Cells, and Memory.
Cold Spring Harbor Perspectives in Biology. (2015)
Drosophila
melanogaster
1 mm

ODOR

Octan-3-ol (OCT)

ODOR

A. Pascual, & T. Préat,
Localization of long-term memory within the Drosophila mushroom body.
Science 294, 1115–1117 (2001).

Octan-3-ol (OCT)
Dolan DNA Learning Center
Cold Spring Harbor Laboratory
www.dnalc.org
Yu, D., Keene, A. C., Srivatsan, A., Waddell, S. & Davis, R. L.
Drosophila DPM neurons form a delayed and branch-specific memory trace after olfactory classical conditioning.
Cell 123, 945–957 (2005).
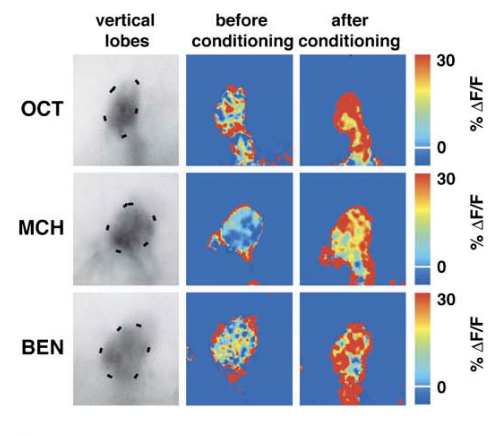


In quantitative terms, what are the changes in the brain after learning, at the single cell level ?


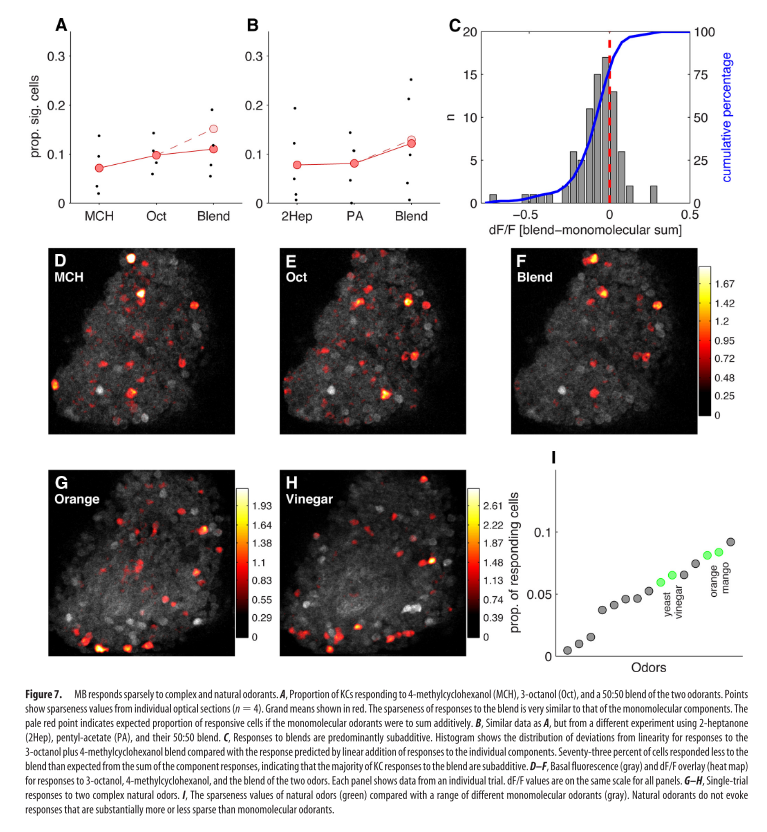
Honegger, K. S., Campbell, R. a a & Turner, G. C.
Cellular-resolution population imaging reveals robust sparse coding in the Drosophila mushroom body.
J. Neurosci. 31, 11772–85 (2011)
state of the art
- Analysis only for 2D slices
(incomplete view of the brain)
- Manual or assisted detection
(biased and low throughput)
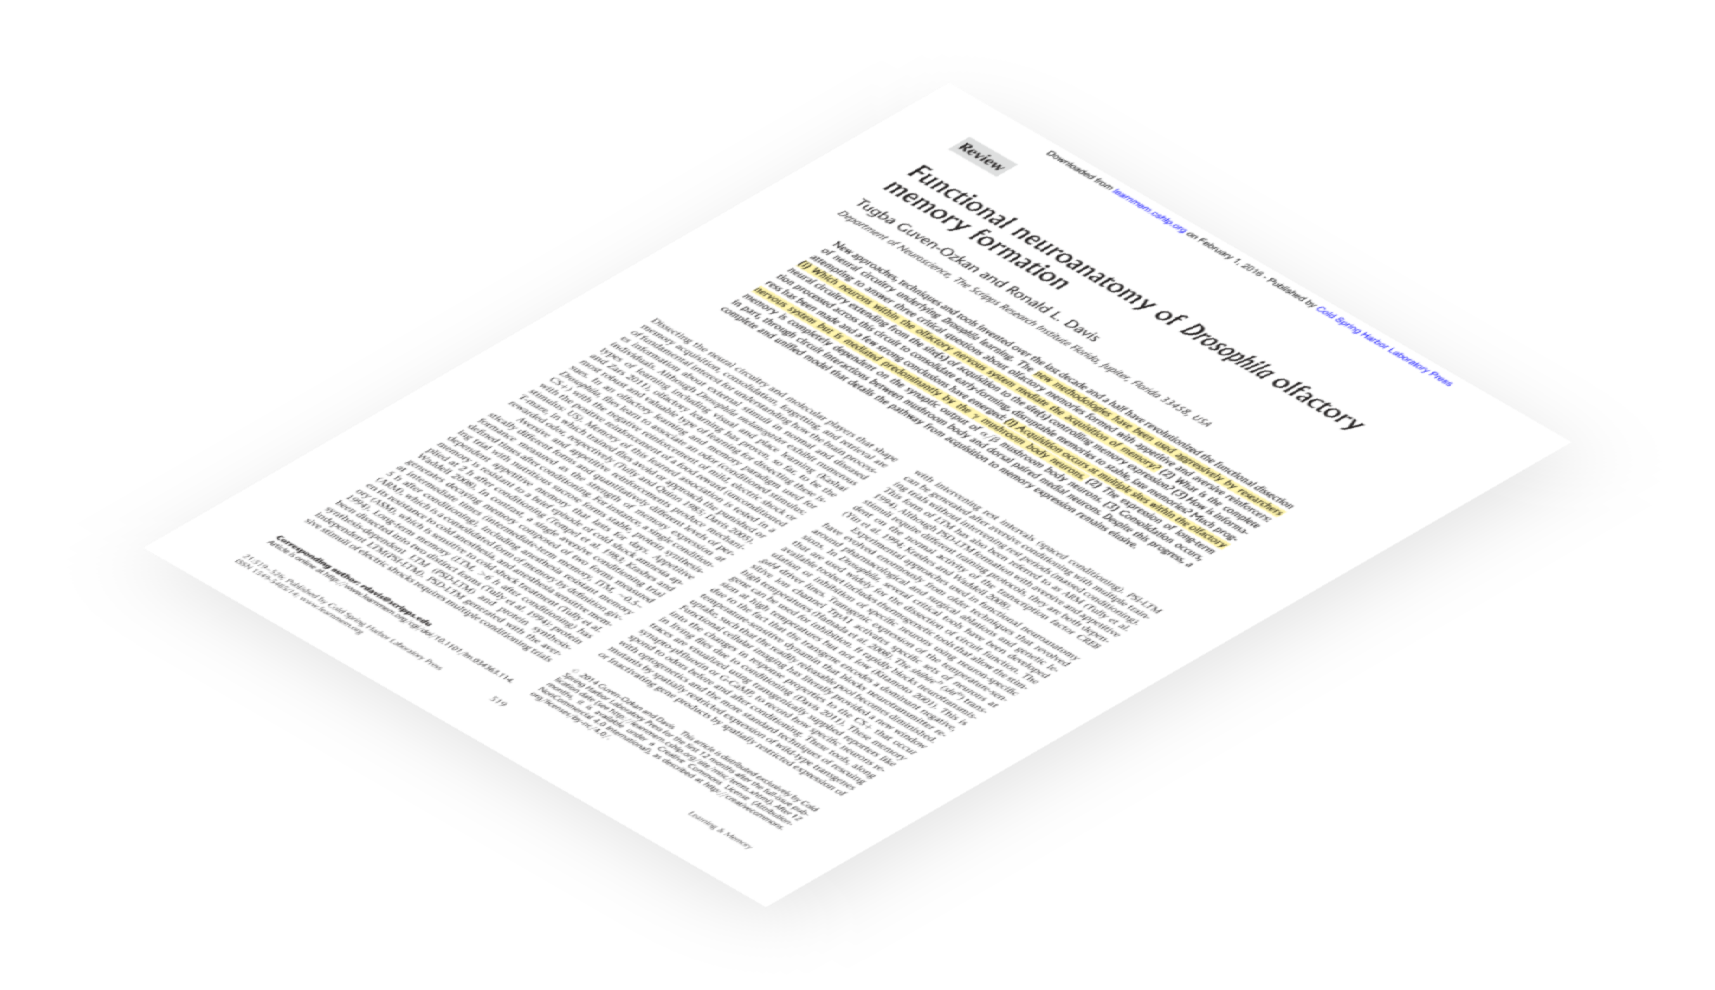


Tugba, G.-O., Davis, R. L., Guven-ozkan, T. & Davis, R. L. Functional neuroanatomy of Drosophila olfactory memory formation. Learn. Mem. 21, 519–526 (2014)
Campbell, R. a a et al. Imaging a population code for odor identity in the Drosophila mushroom body. J. Neurosci. 33, 10568–81 (2013)
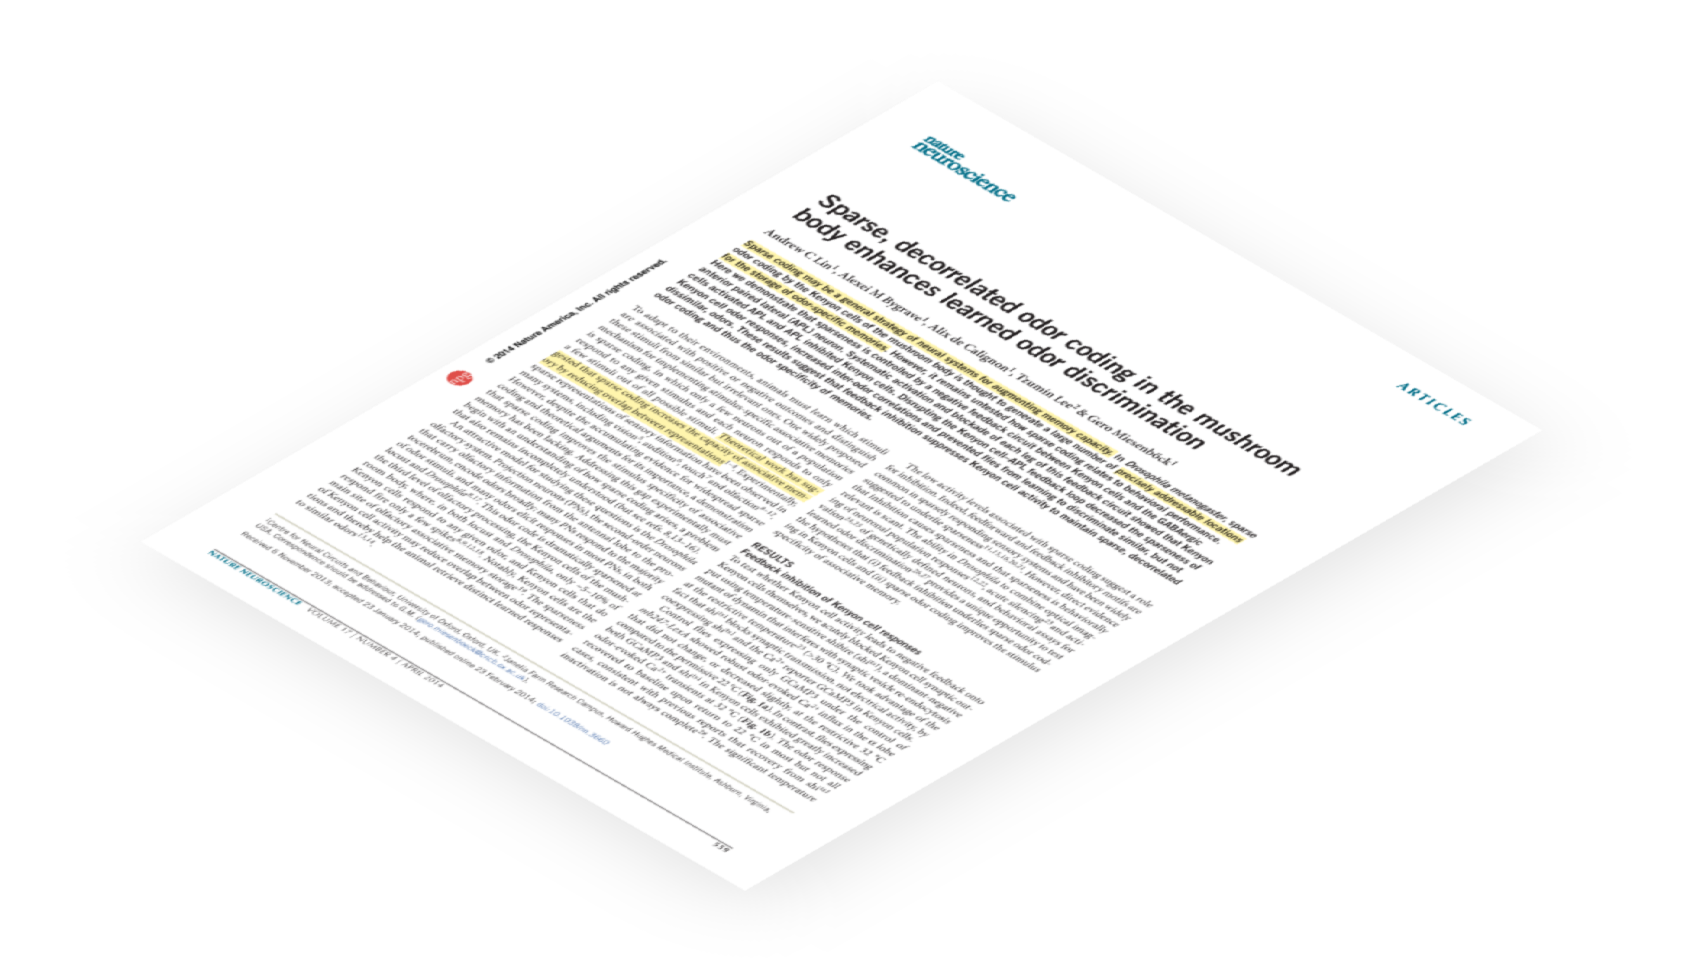
Lin, A. C., Bygrave, A. M., de Calignon, A., Lee, T. & Miesenböck, G. Sparse, decorrelated odor coding in the mushroom body enhances learned odor discrimination. Nat. Neurosci. 17, 559–68 (2014)
Aso, Y. et al. The neuronal architecture of the mushroom body provides a logic for associative learning. Elife 3, e04577 (2014)
Strategy
-
Record the full extent of the Mushroom body in 3D
By using of a confocal spinning disk we'll be able to perform fast and complete acquisitions
-
Automatically detect the neurons in 3D
An automated procedure guarantees an unbiased analysis
-
Analyse the difference between groups
A quantitative approach will allow us to infer how the memory trace is represented in the brain
mCherry & GCaMP
with a VT30559-GAL4 promoter
Expression is restricted to the kenyon cells (mushroom body neurons)


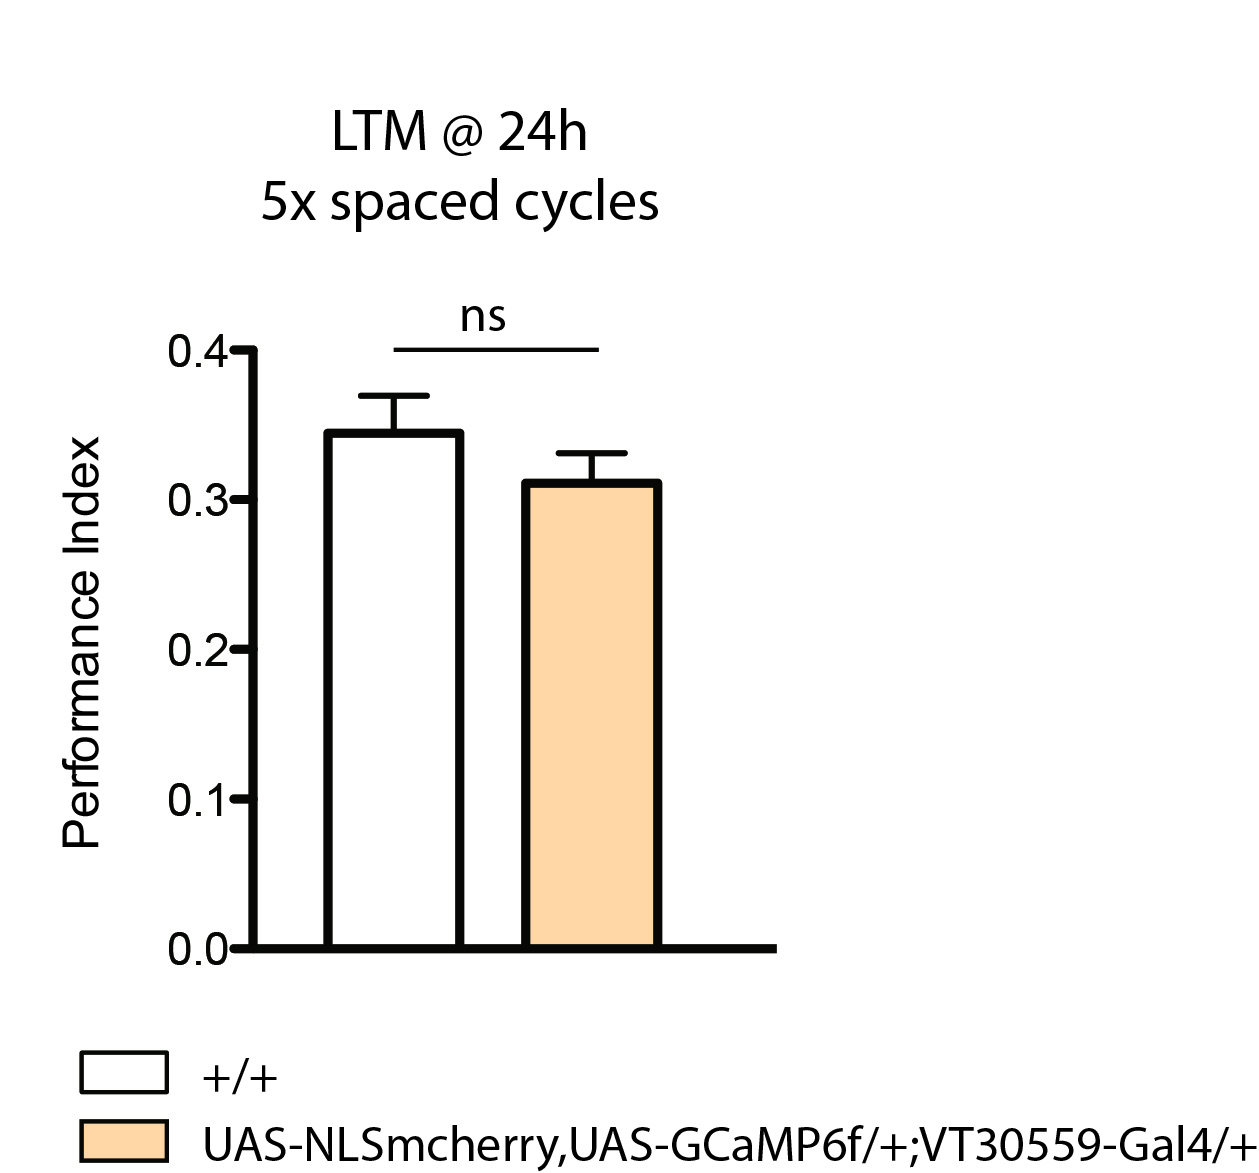
mCherry & GCaMP
with a VT30559-GAL4 promoter
Expression is restricted to the kenyon cells (mushroom body neurons)


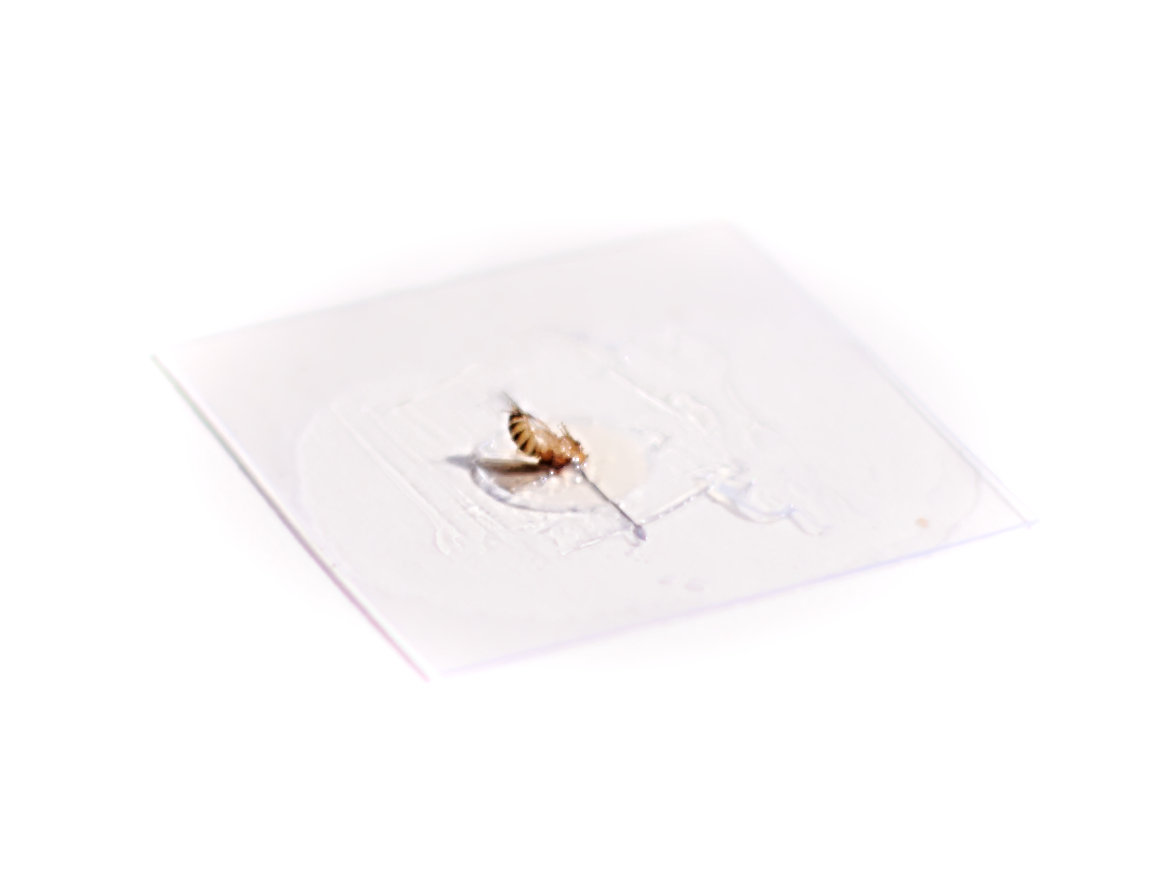


MELANIE PEDRAZZANI
LISA SCHEUNEMANN

Dimensions
X: 256 pixels (41.28µm)
Y: 512 pixels (82.56µm)
Z: 45 slices (67.50µm)
Acquisition time
20ms per slice
0.9 s per stack
135 s per acquisition
mCherry
GCaMP


Dimensions
X: 256 pixels (41.28µm)
Y: 512 pixels (82.56µm)
Z: 45 slices (67.50µm)
Acquisition time
20ms per slice
0.9 s per stack
135 s per acquisition
mCherry
GCaMP

About 200 recordings of unique flies where made for the standardisation of the protocol
Aditional 122 flies were used for the final analysis
(more than any other work)
This corresponds to about 4.6 hours of recorded signal, stored in more than 800 thousands of image slices
Data challenges
XY
YZ
Nuclei (mCherry) | Max projections

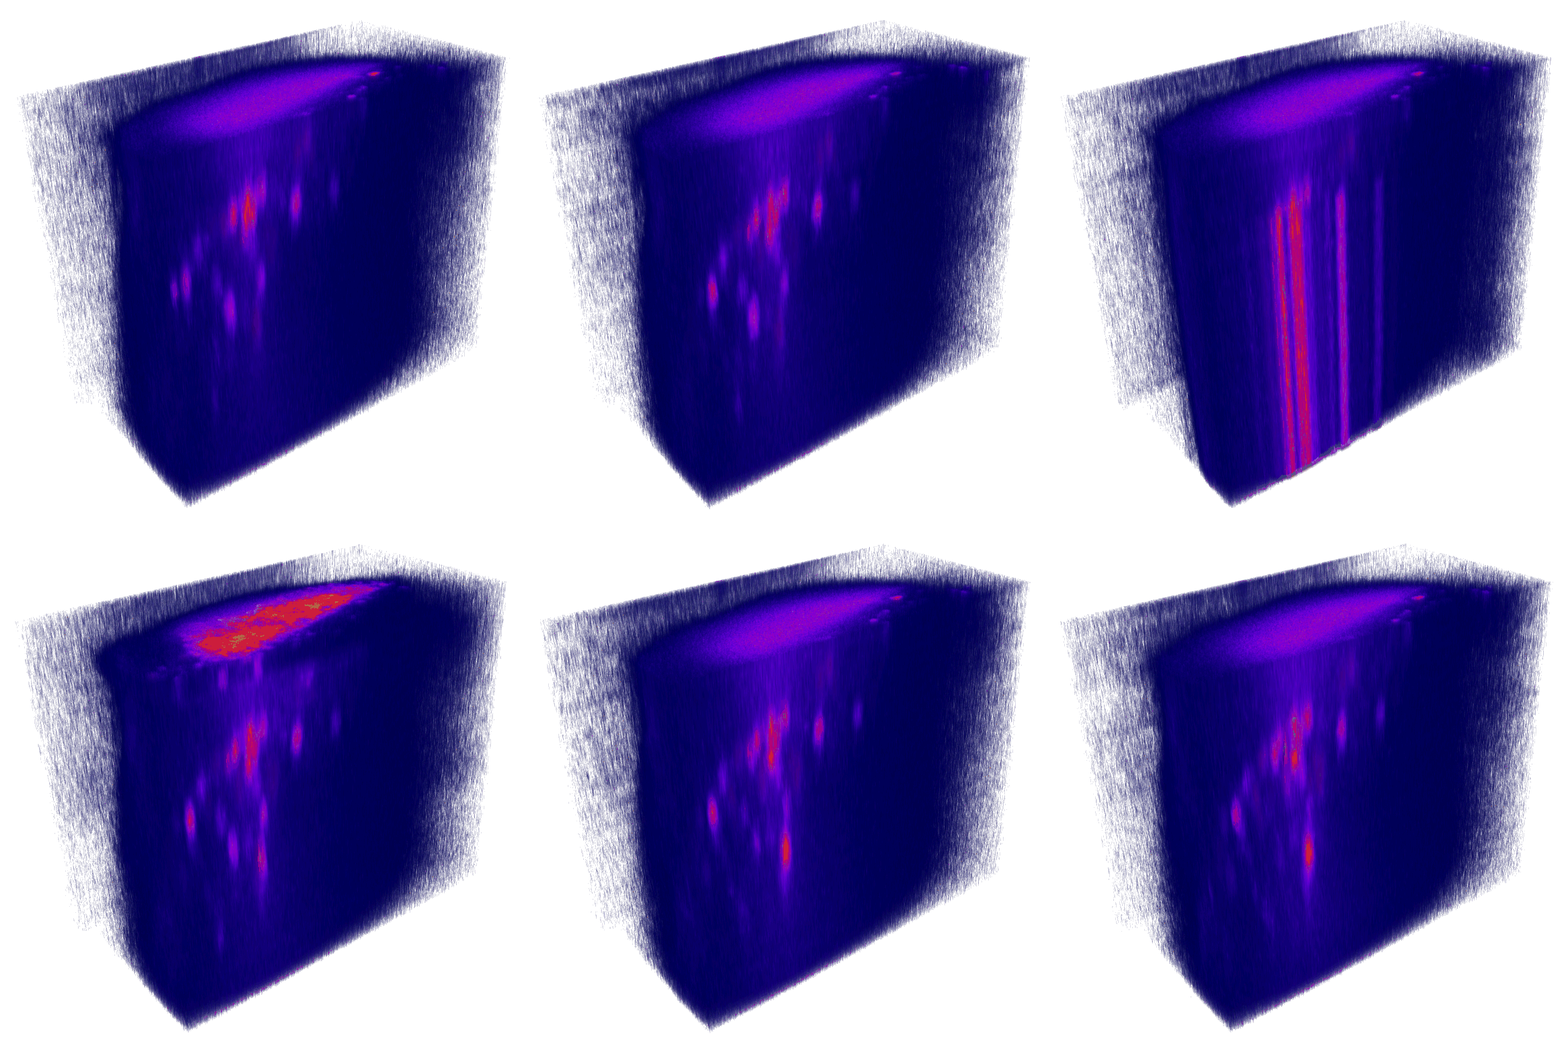
x
y
z
mCherry (nuclei)
Volumetric reconstruction
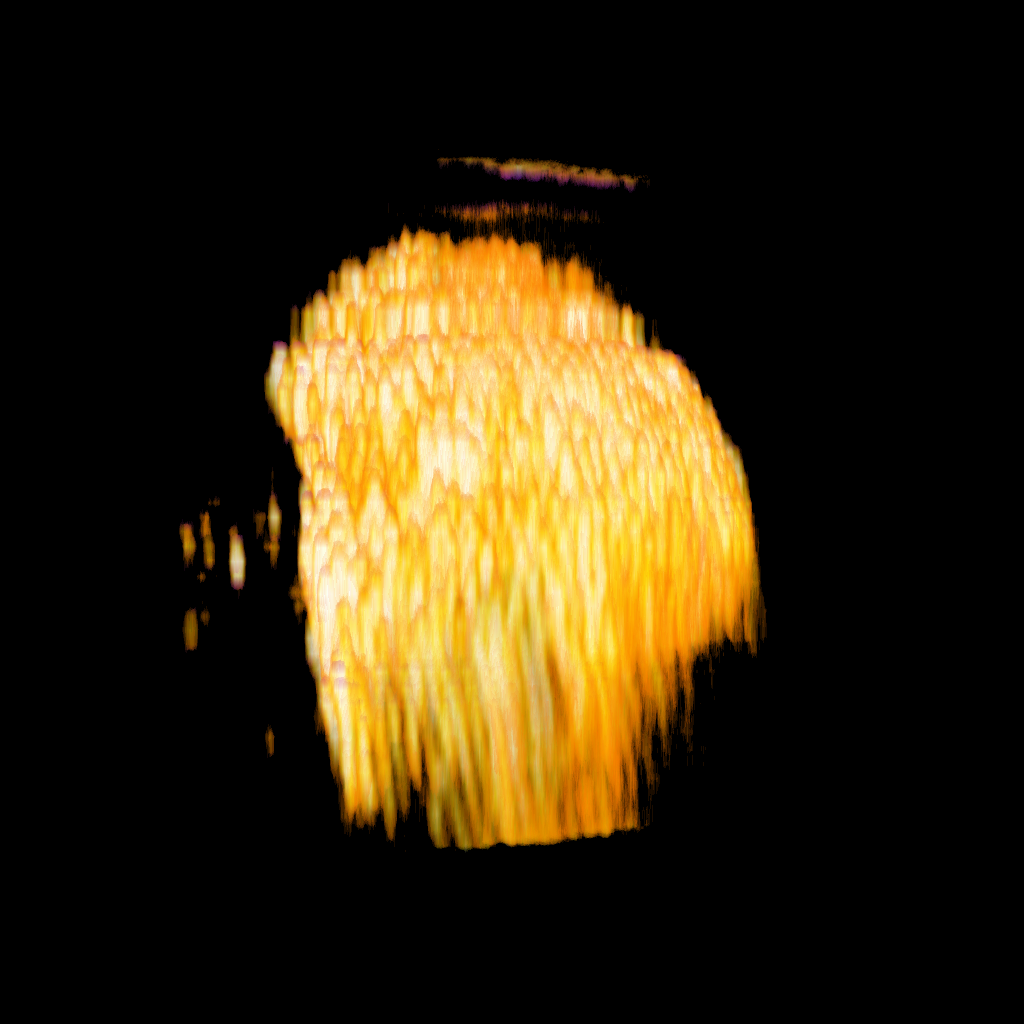
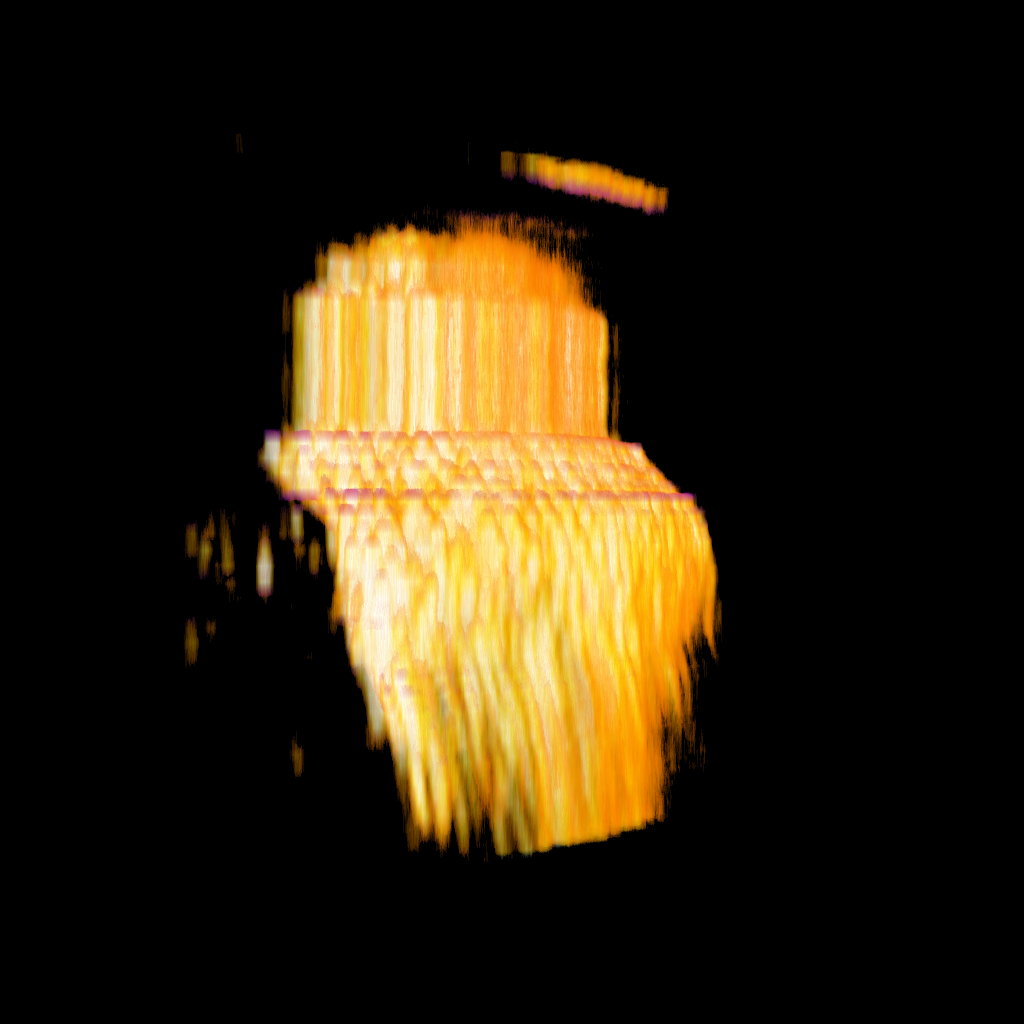
normal
artifact
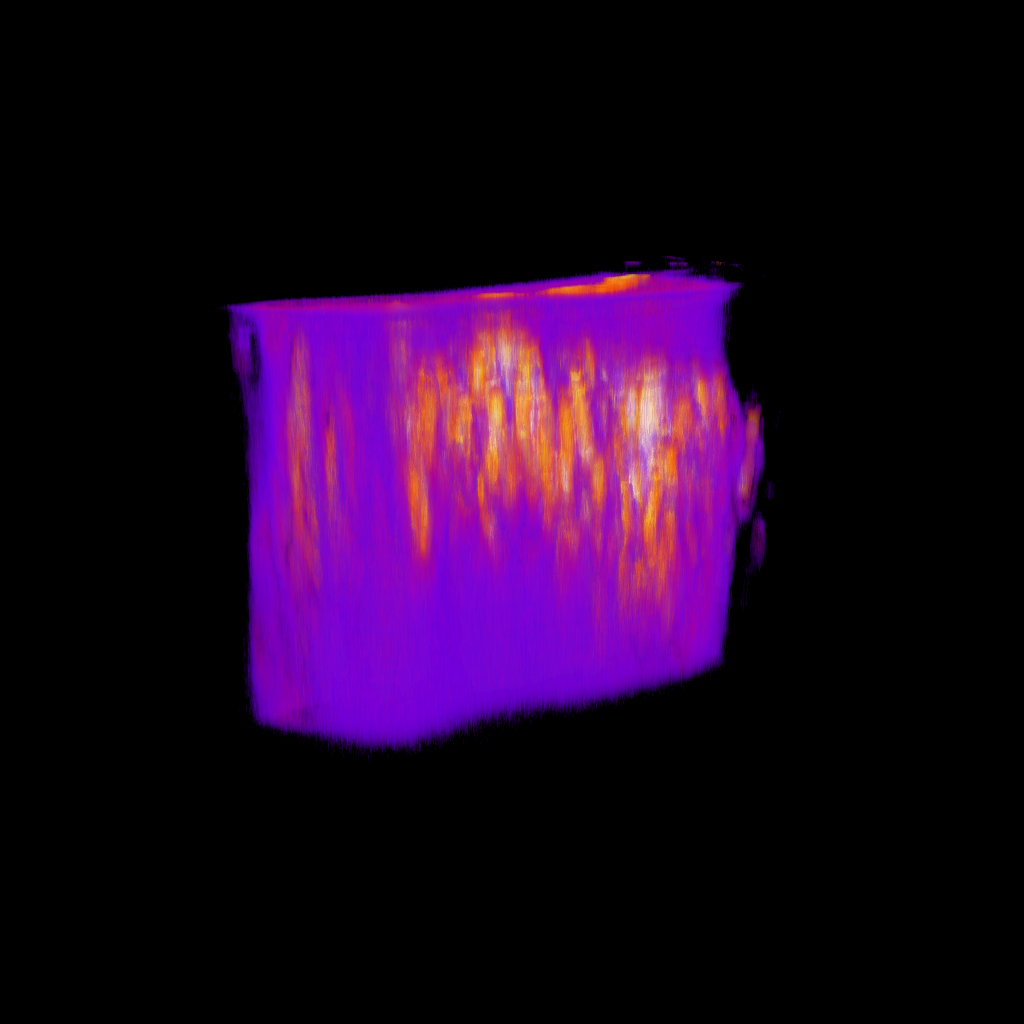
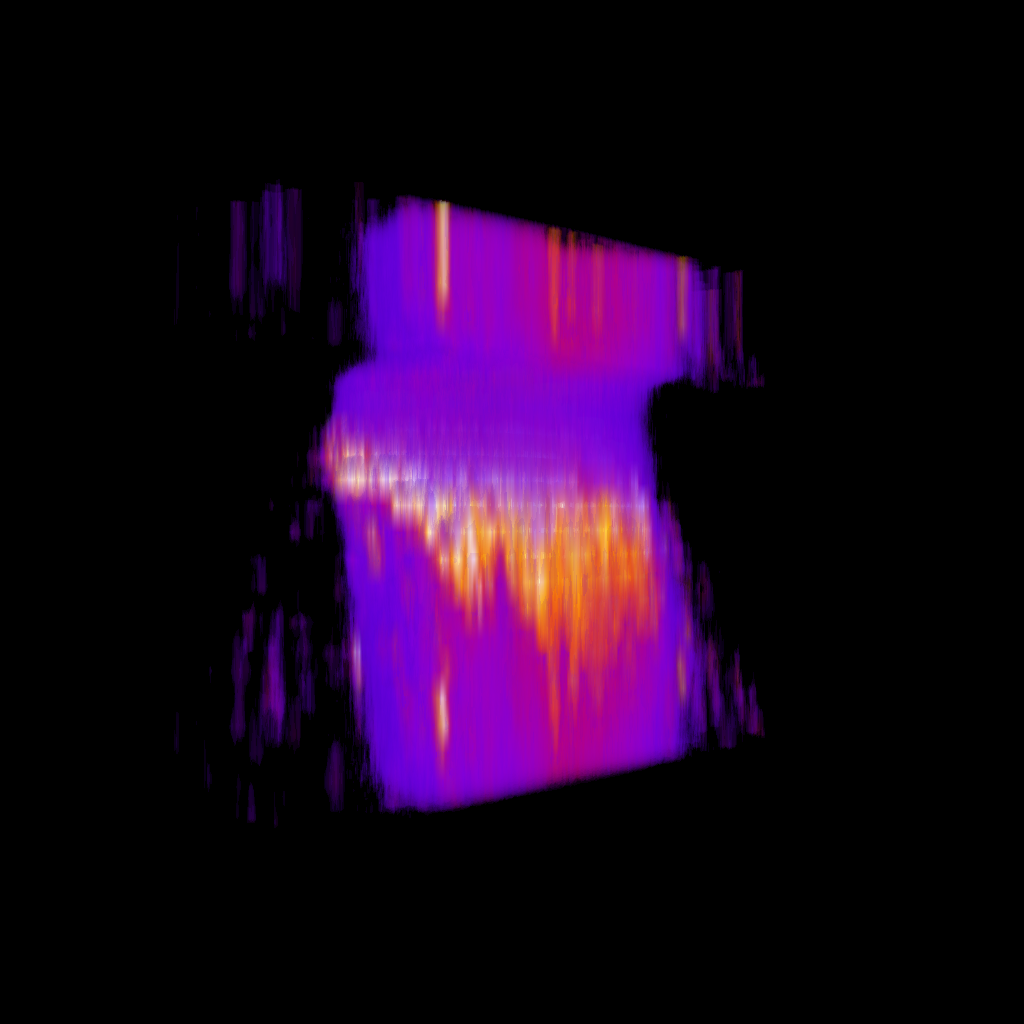
normal
artifact
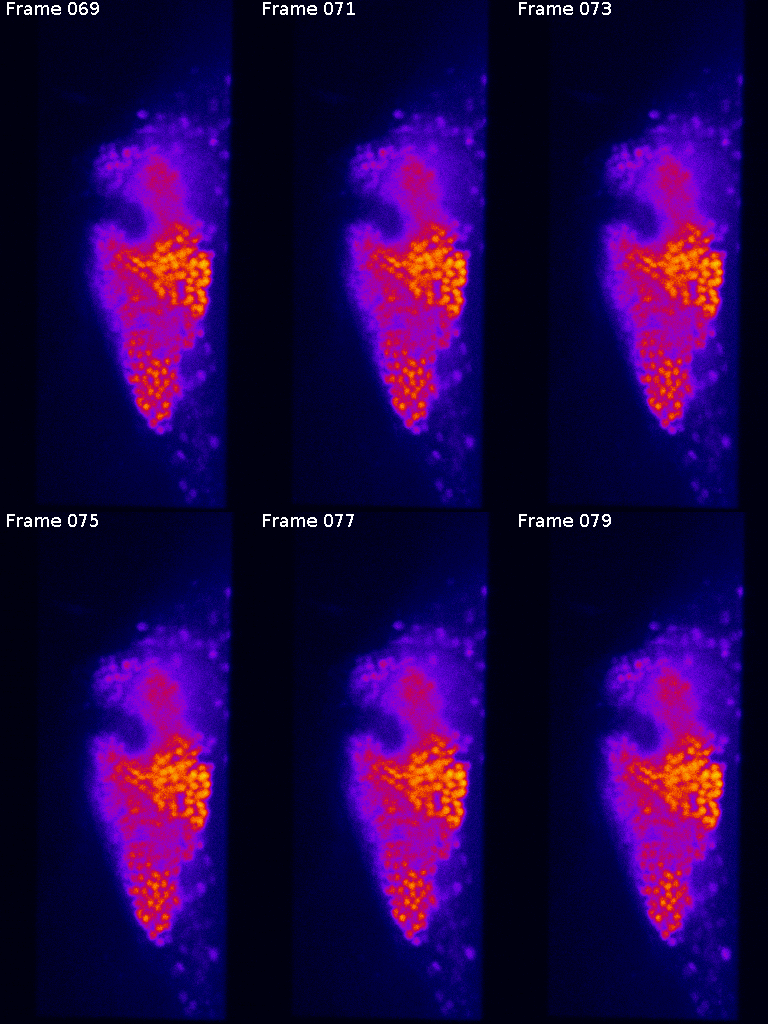
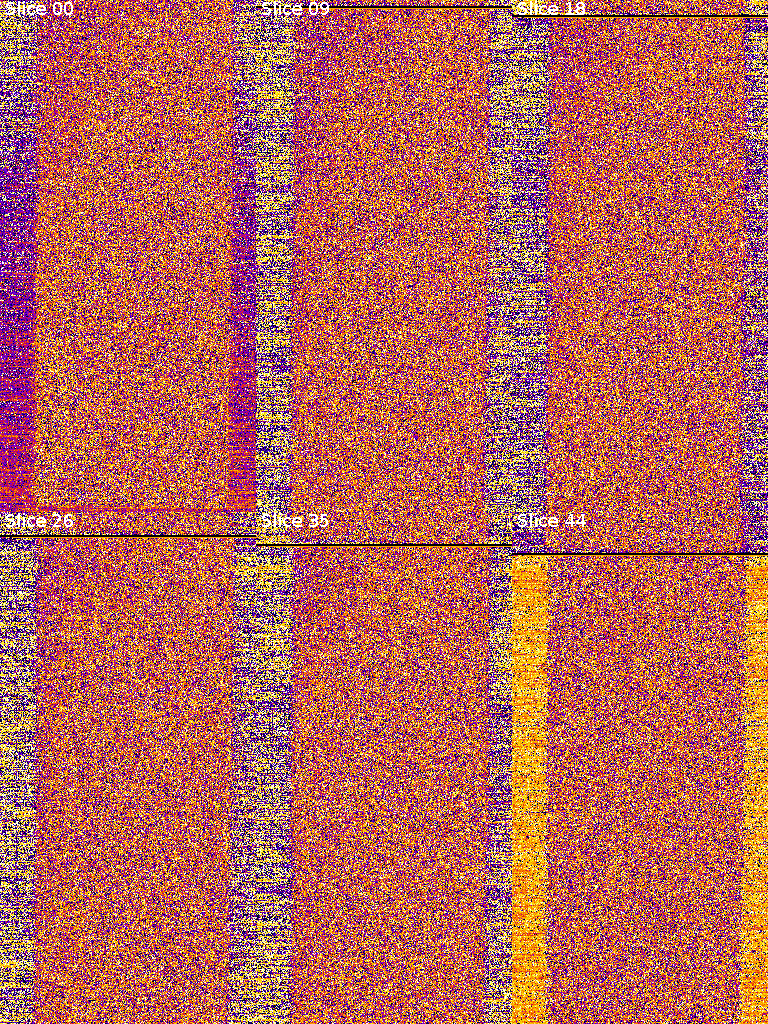
Max projection through time
Slices of problematic stack
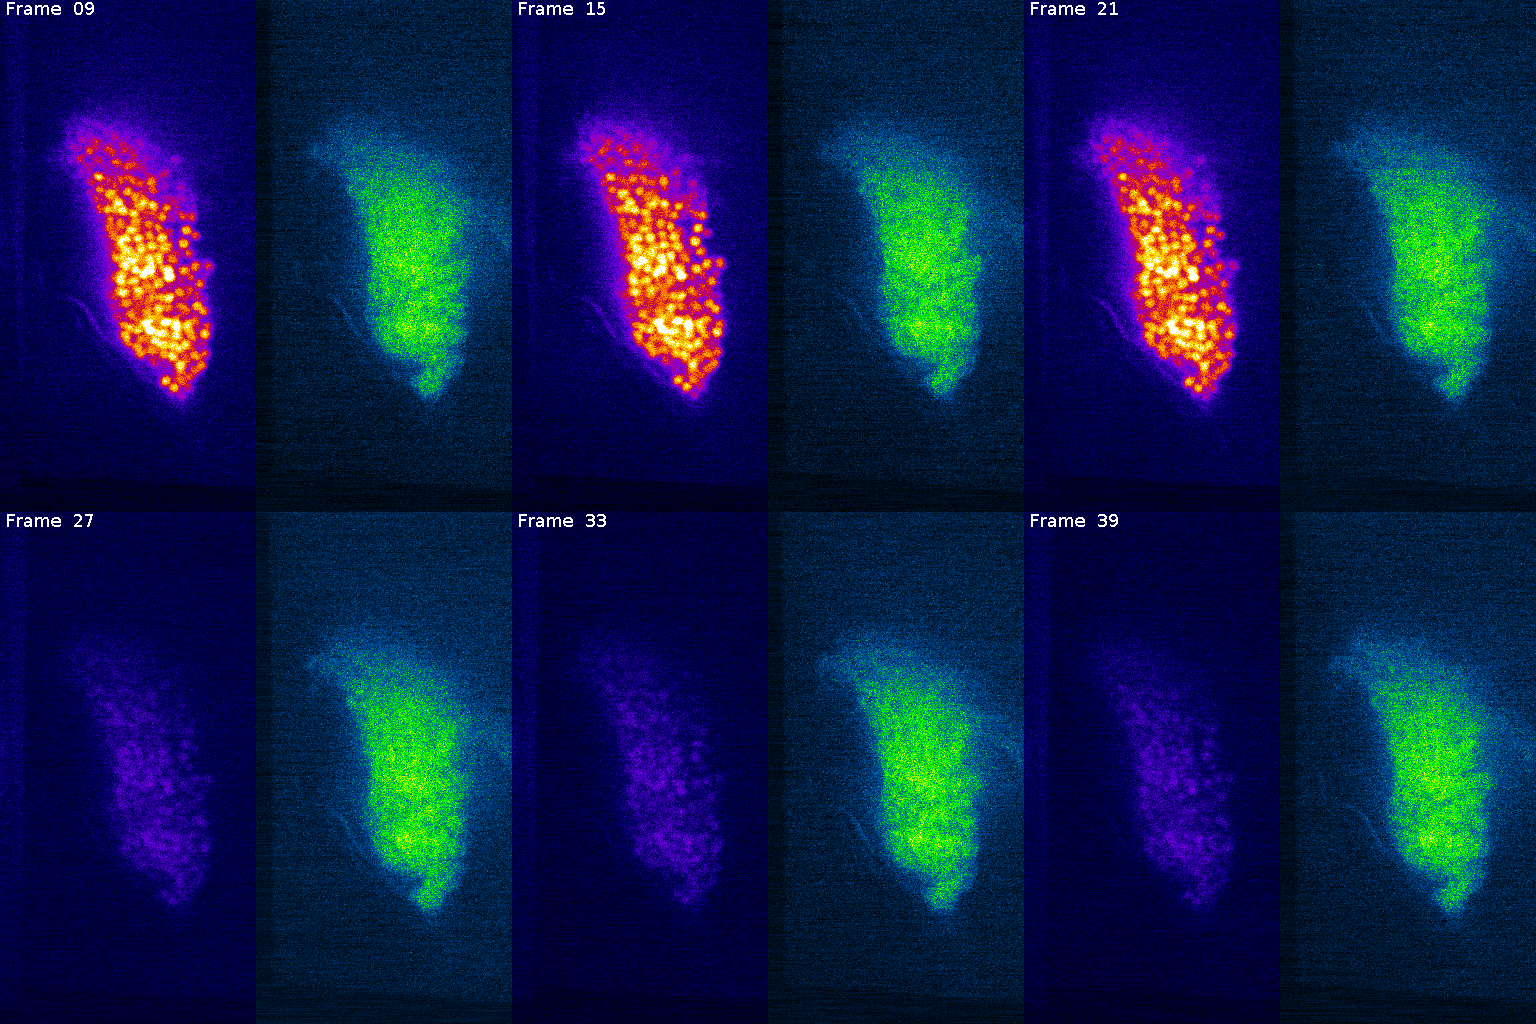
Nuclei (mCherry)
Signal (GCaMP)
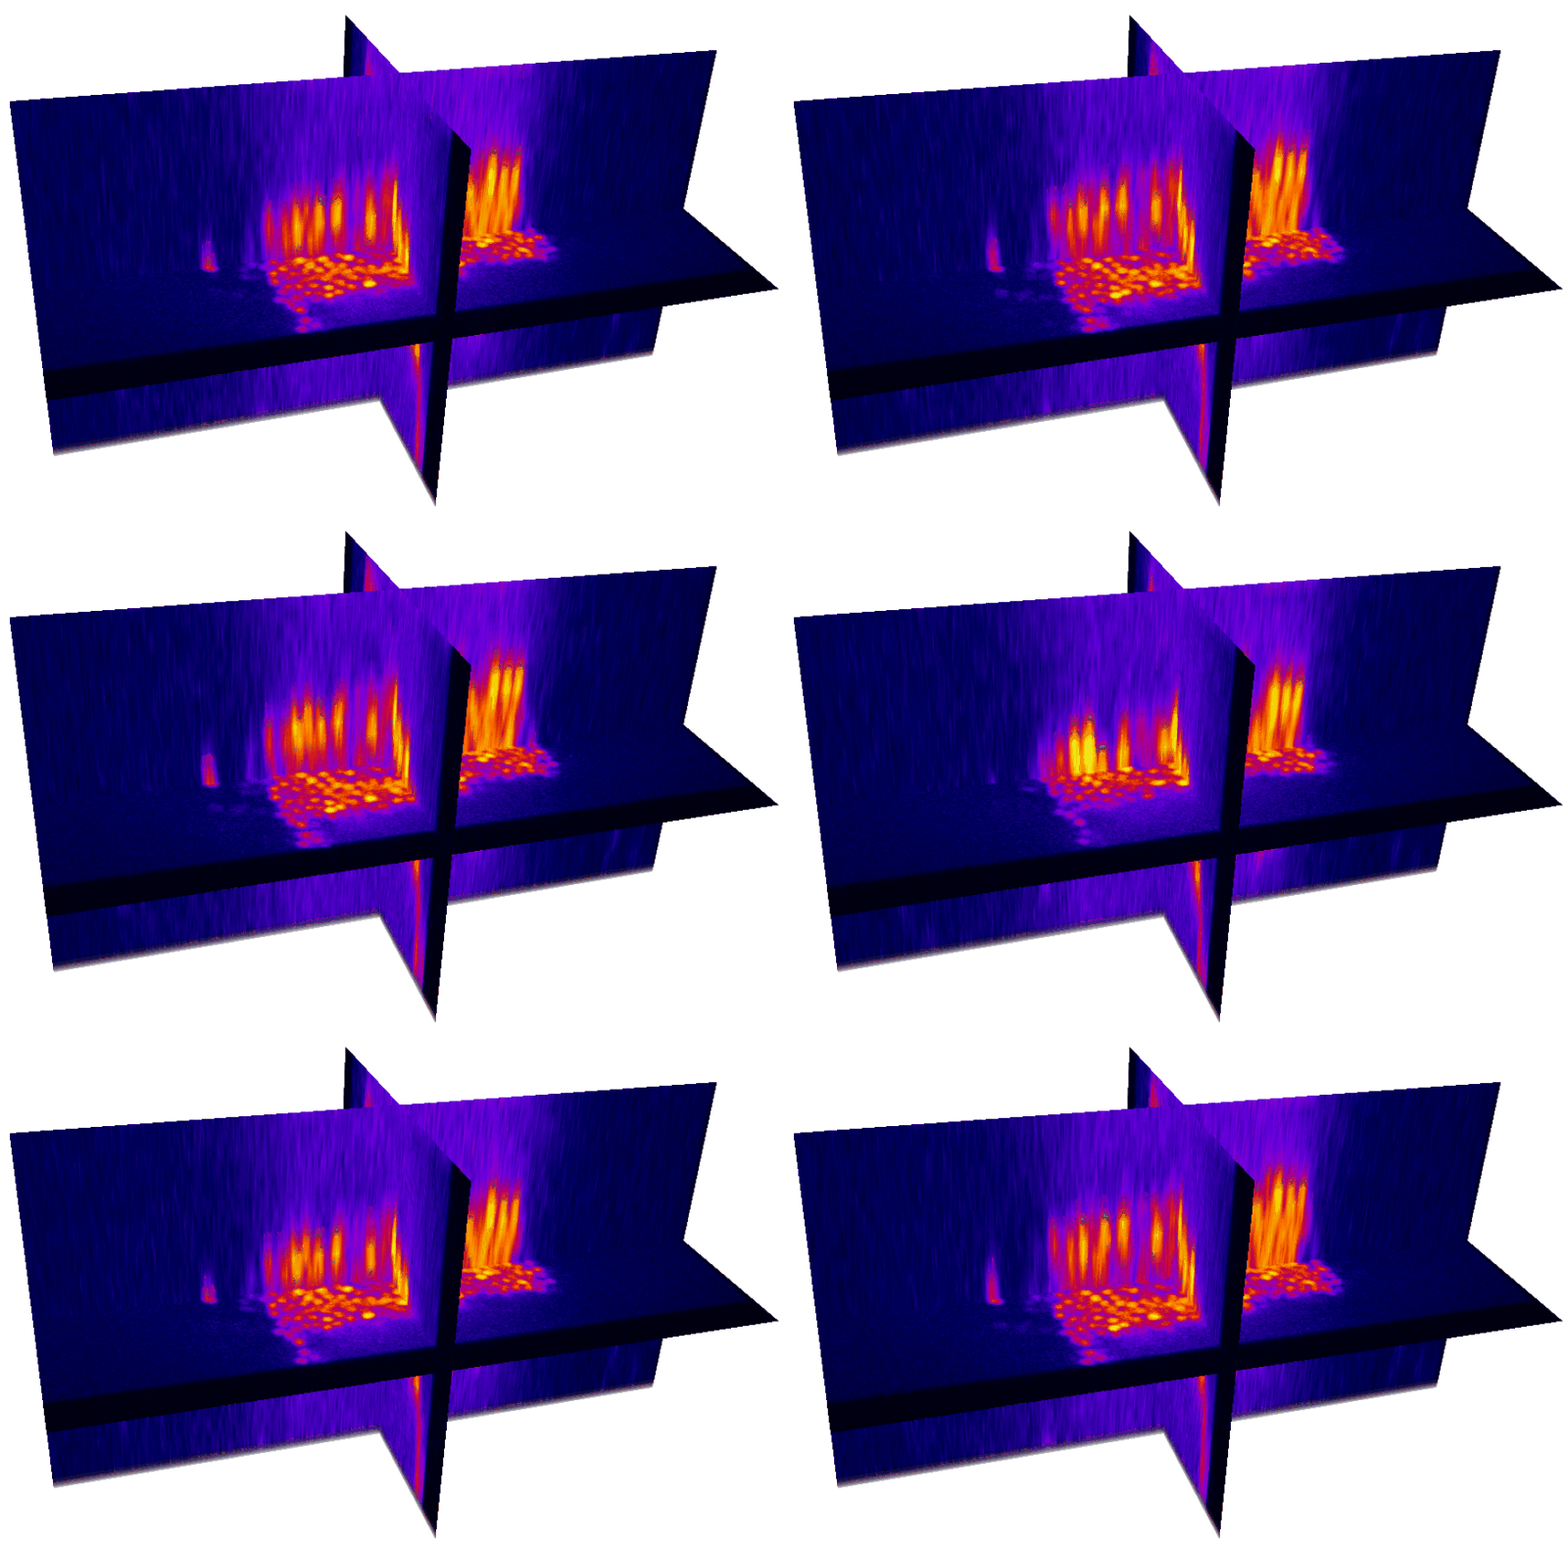
Natural brain movement
x
y
z
y
Data analysis
DETECTION
TRACKING
SIGNAL
DETECTION
TRACKING
SIGNAL
Find the position of the nuclei of neurons from the Mushroom body
Follow each one of the detected neurons through time
Measure the correspondent signal for the individual neurons
DETECTION
TRACKING
SIGNAL
Neuron detection
The goal is to find the positions of nuclei from the Mushroom body, so that the individual neurons can be identified
normal
artifact
normal
artifact
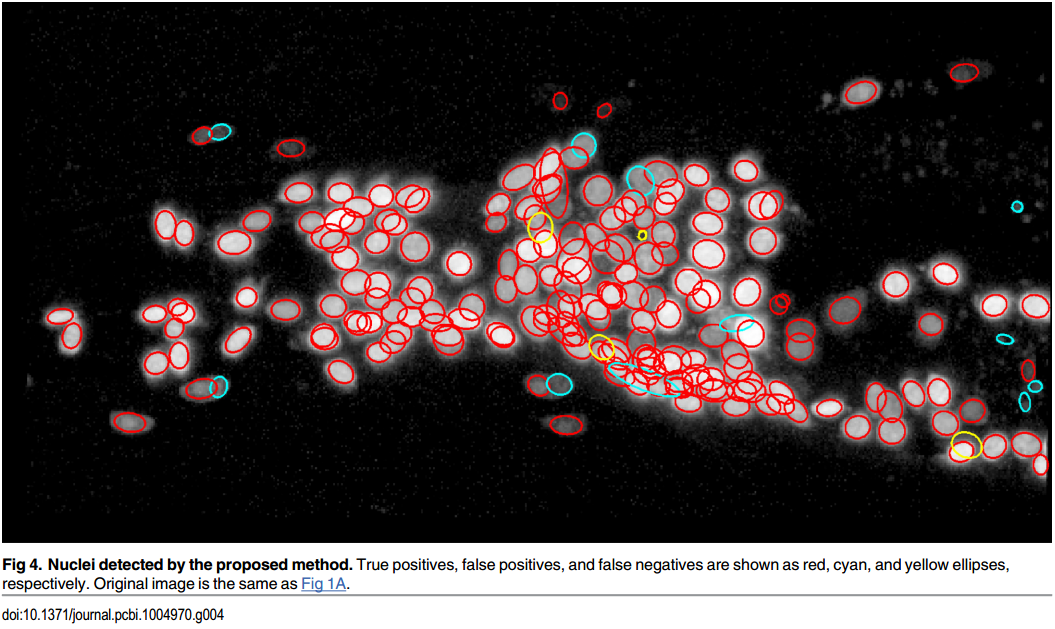
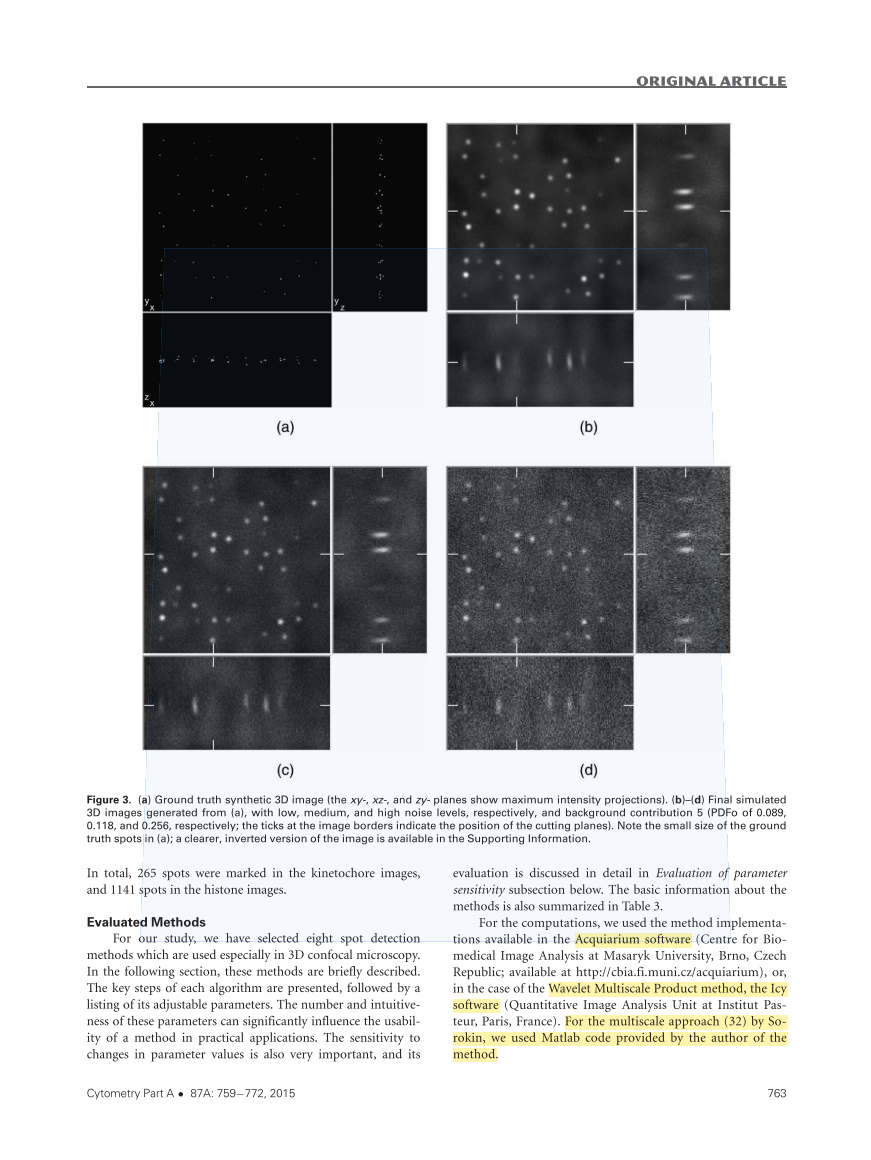
Toyoshima, Y. et al.
Accurate Automatic Detection of Densely Distributed Cell Nuclei in 3D Space.
PLoS Comput. Biol. 12, 1–20 (2016)
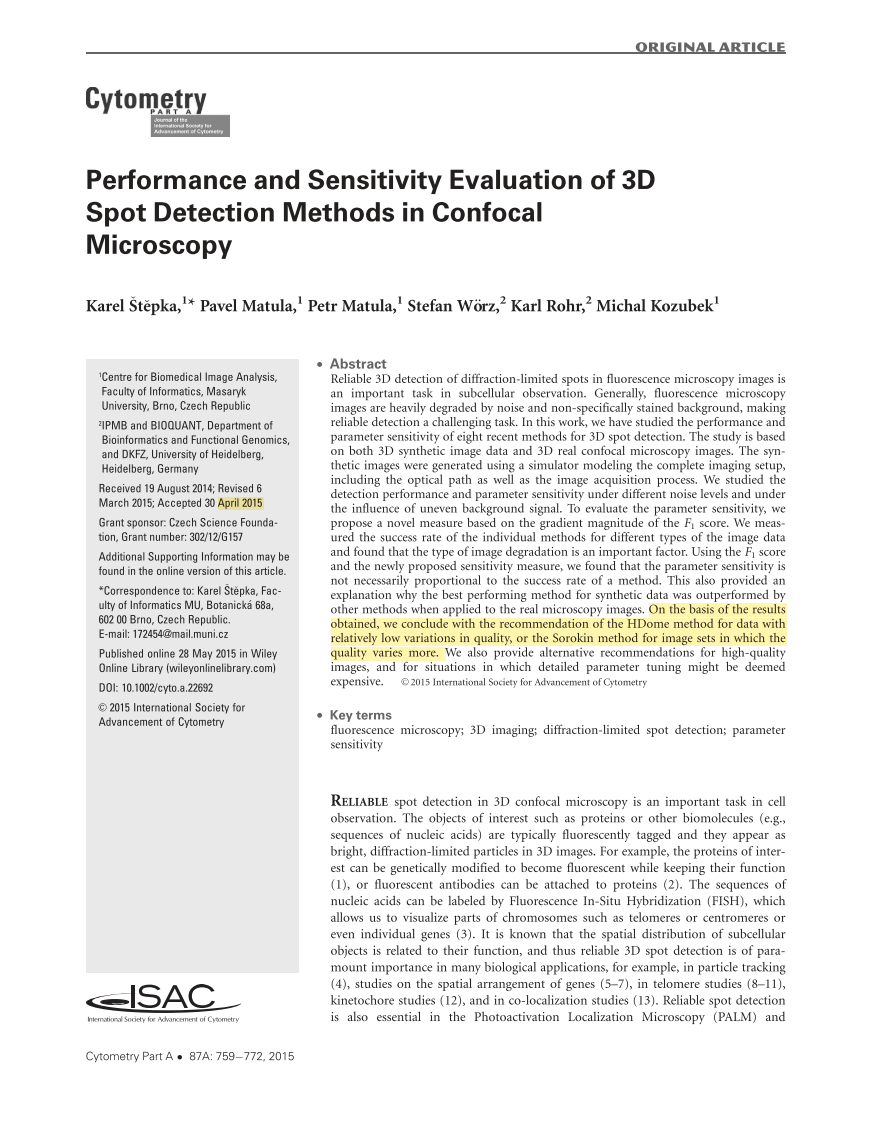
Štěpka, K. et al.
Performance and sensitivity evaluation of 3d spot detection methods in confocal microscopy.
Cytom. Part A (2015)

Estimating nuclei size
Using the Full Width at Half maximum, we can estimate the nuclei diameter


time frames
0
250
Detection validation
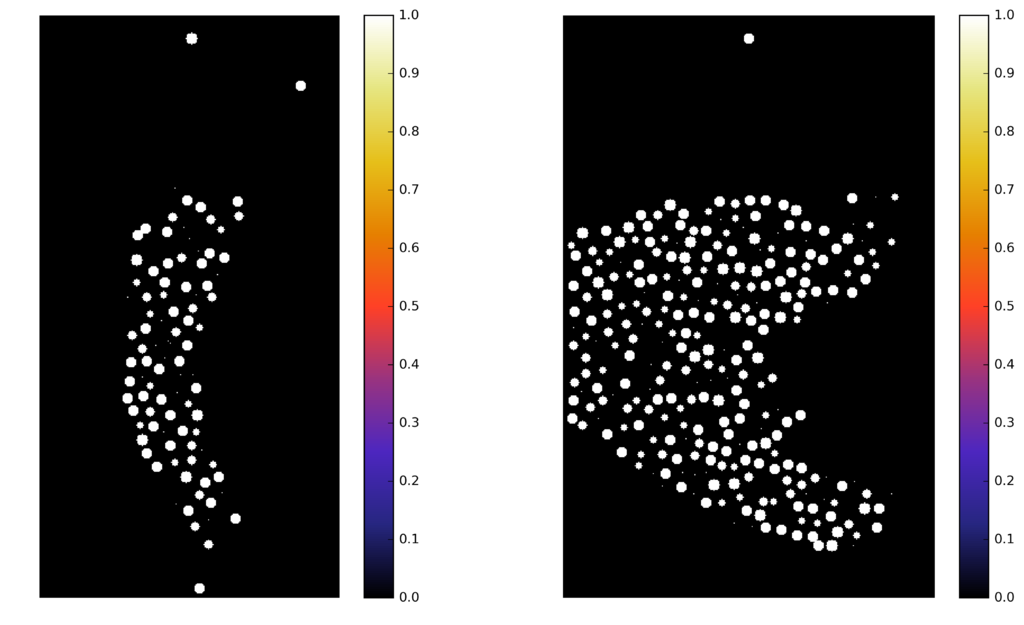
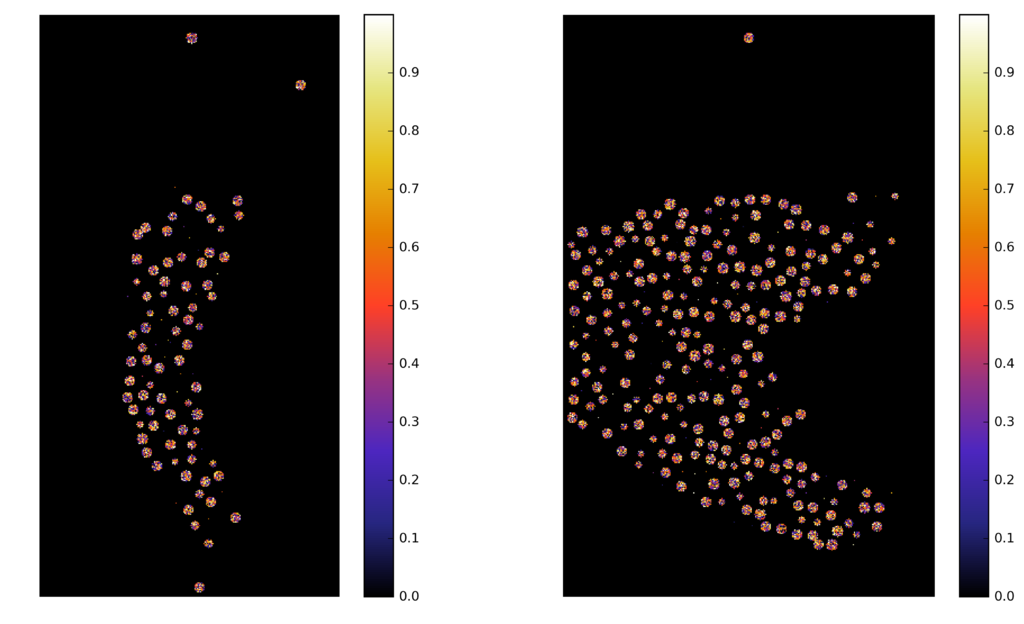
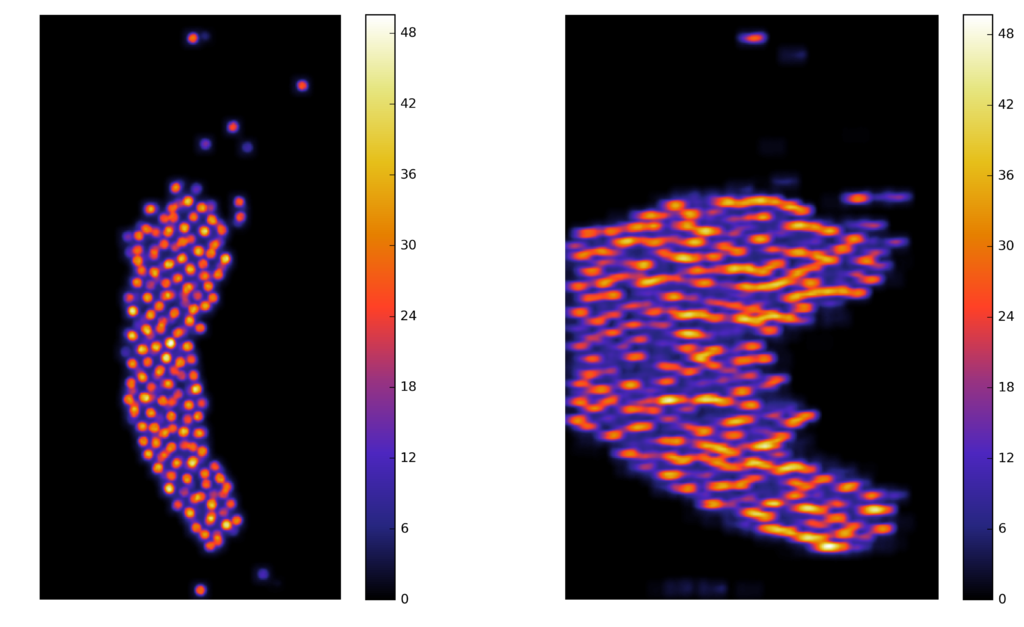
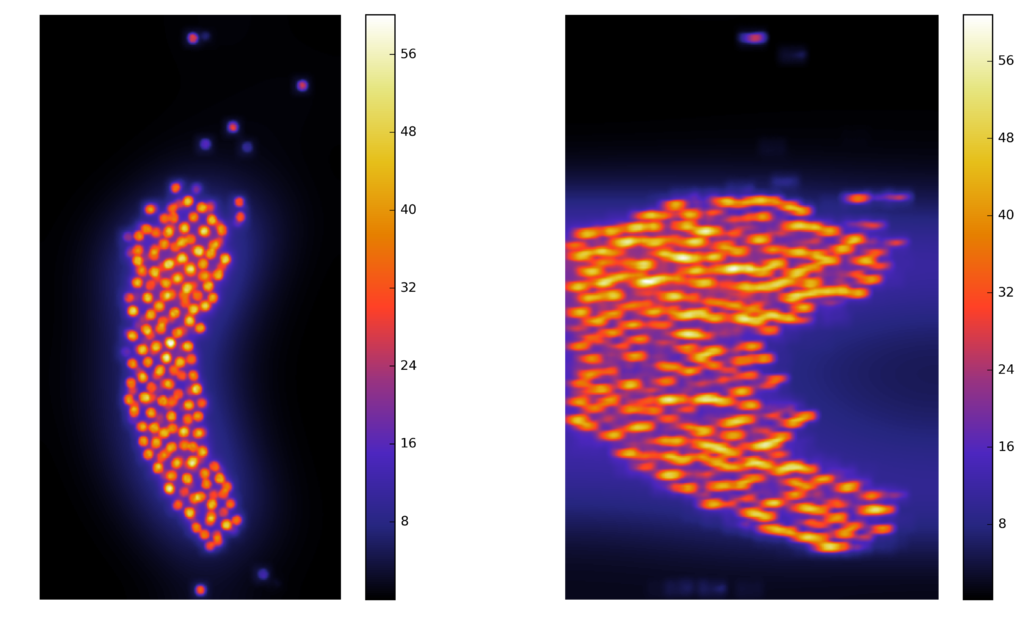
Synthetic images
A computer generate image, with similar characteristics to the original image, and known ground truth
Detection validation

synthetic
real
Synthetic images
A computer generate image, with similar characteristics to the original image, and known ground truth
Detection validation
Manual annotation
Using the CellCounter ImageJ plugin to manually mark the nuclei position in 3D

Detection validation


Real image
Synthetic image


time frames
0
250
DETECTION
TRACKING
SIGNAL
Neuron tracking
Once having the positions of every neuron, we need to link the detections trough time.
Chenouard, N. et al.
Objective comparison of particle tracking methods.
Nat. Methods 11, 281–289 (2014)
Non-rigid deformation
Natural movements of the brain cause deformations during the acquisition
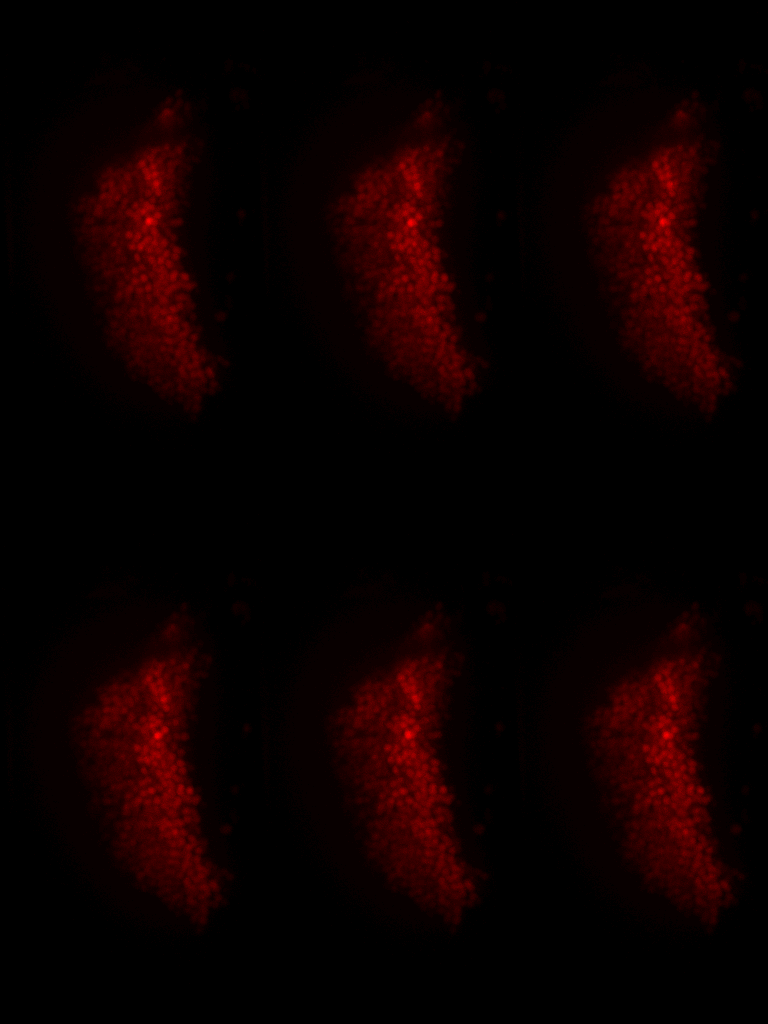
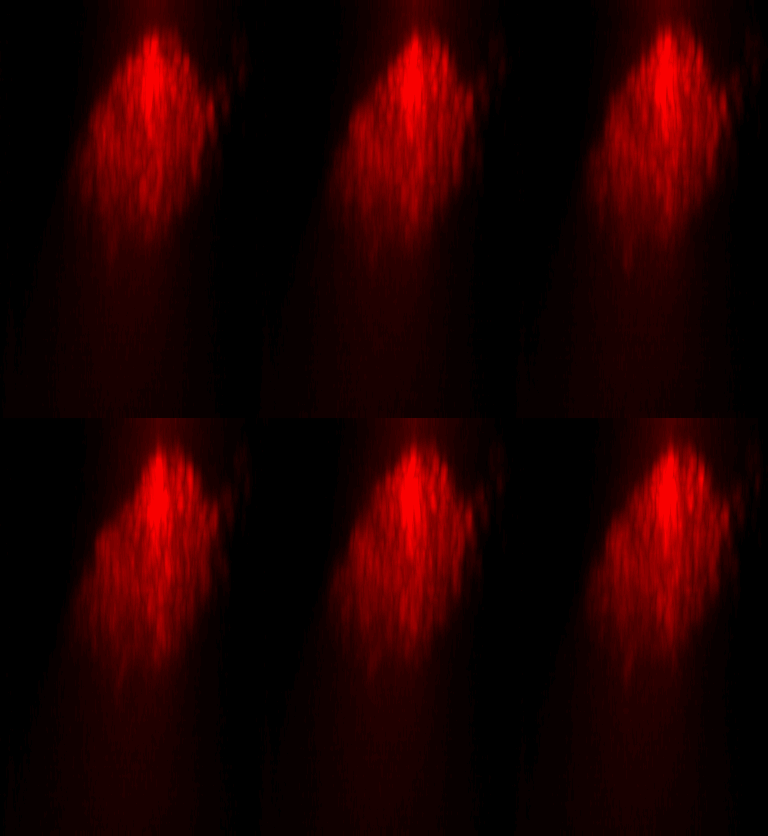
top view
side view


Frame 1
Frame 2


Frame 1
Frame 2


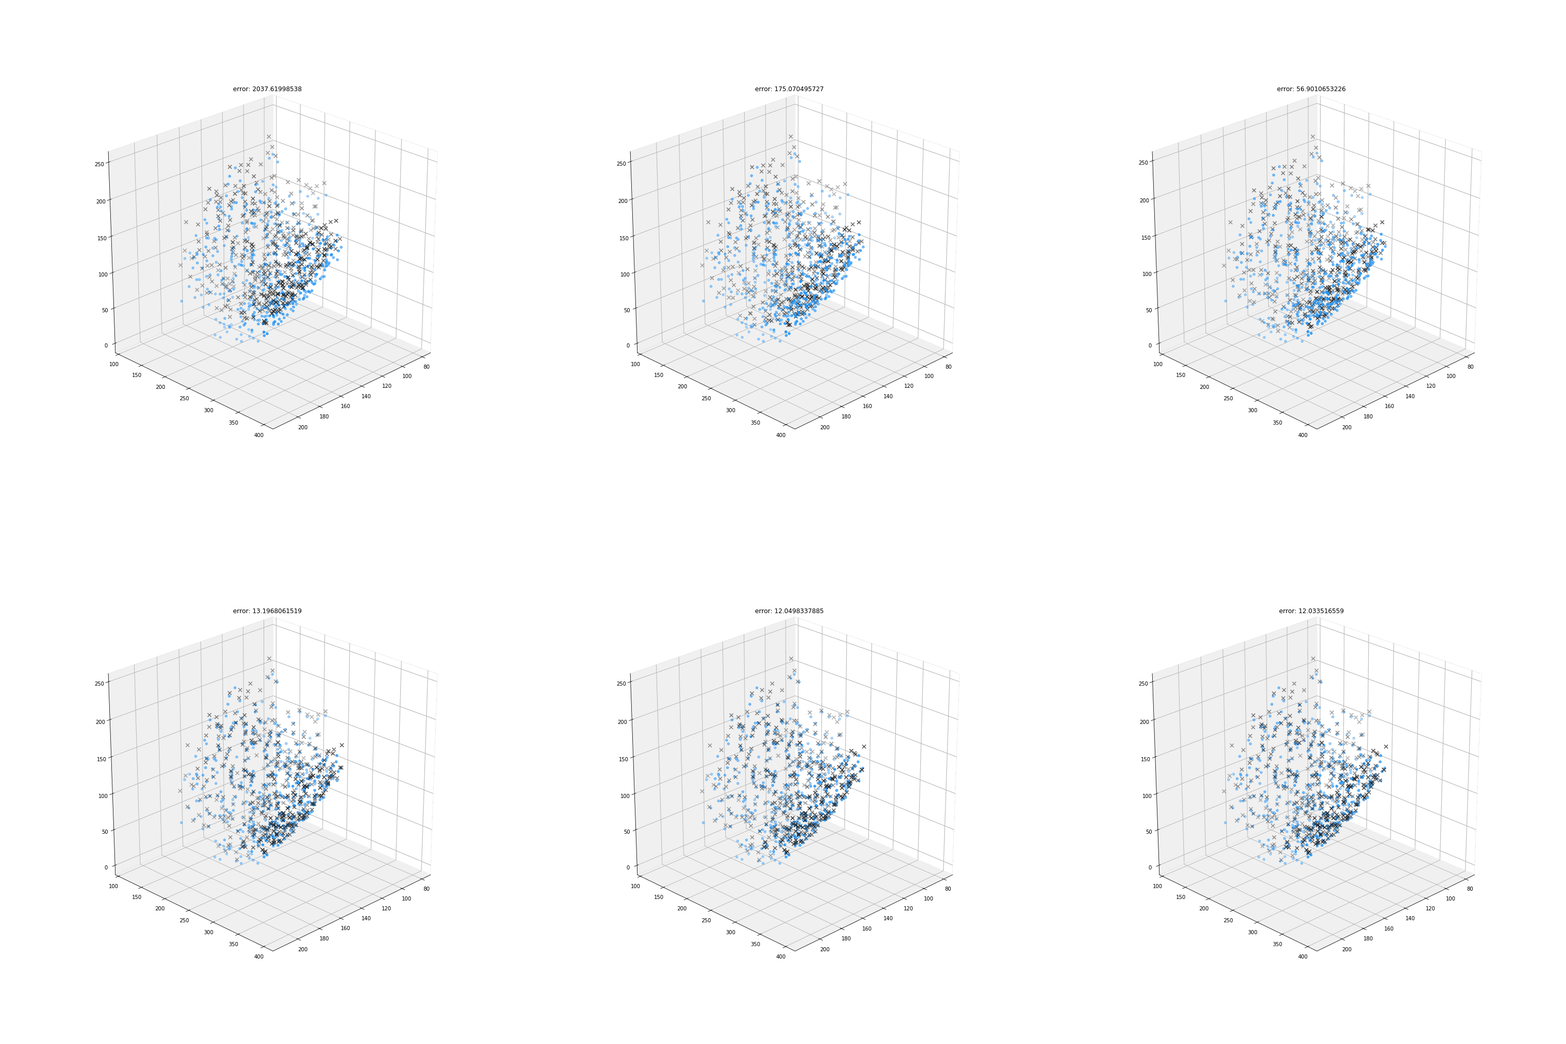
Myronenko, A. & Song, X.
Point set registration: coherent point drift.
IEEE Trans. Pattern Anal. Mach. Intell. 32, 2262–75 (2010).
Ester, M., et al.
A Density-Based Algorithm for Discovering Clusters in Large Spatial Databases with Noise.
Proceedings of the 2nd International Conference on Knowledge Discovery and Data Mining, pp. 226-231. (1996)
DBSCAN
Original detections
Registered detections
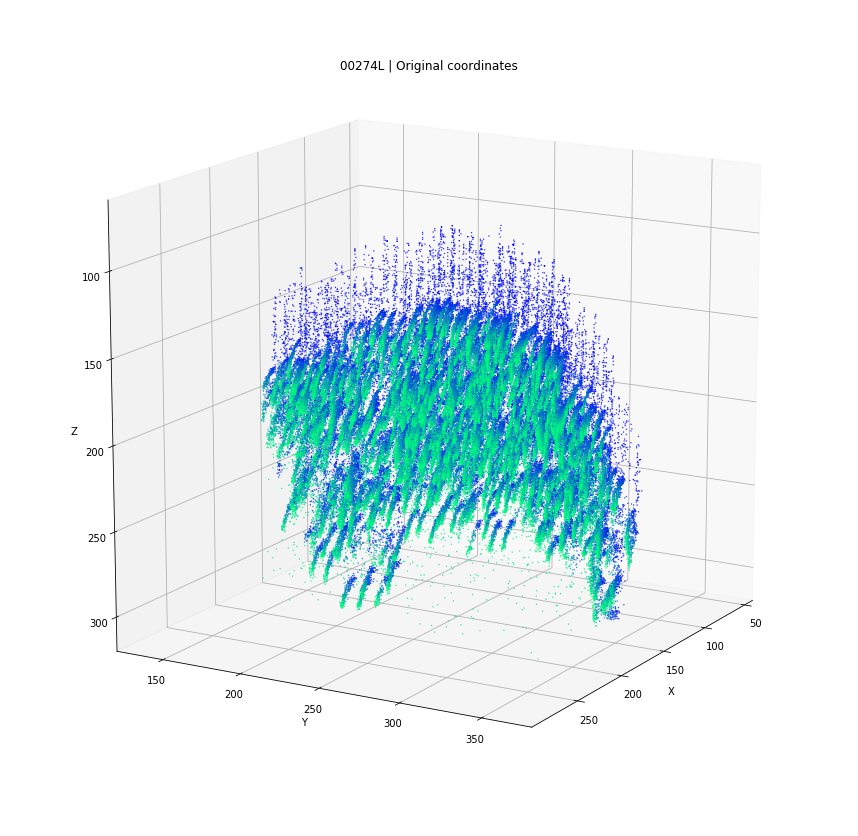
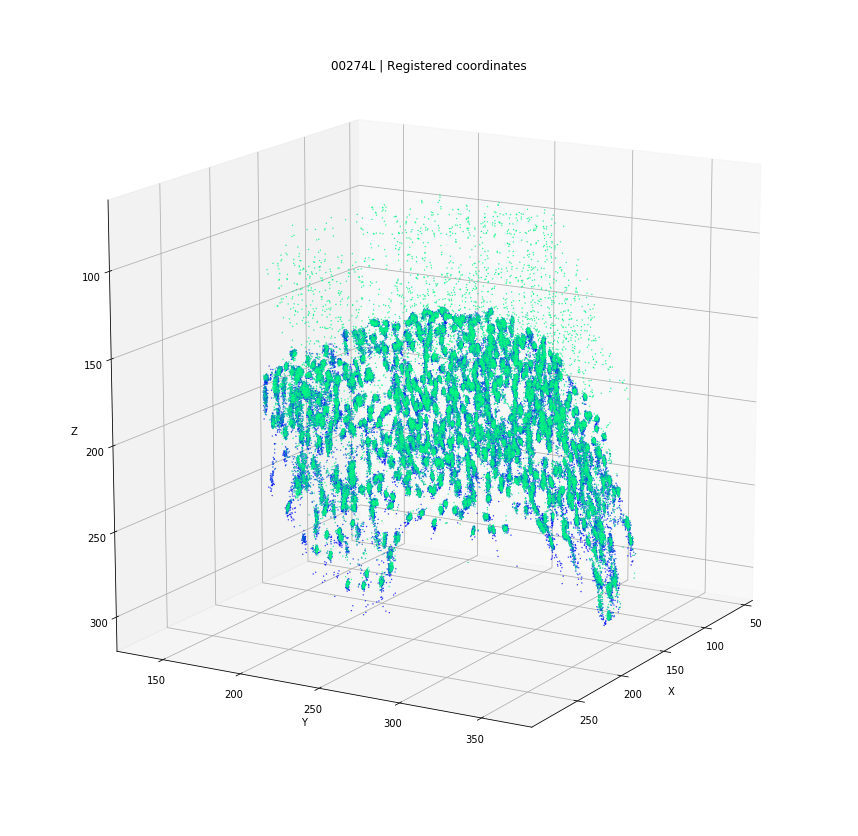
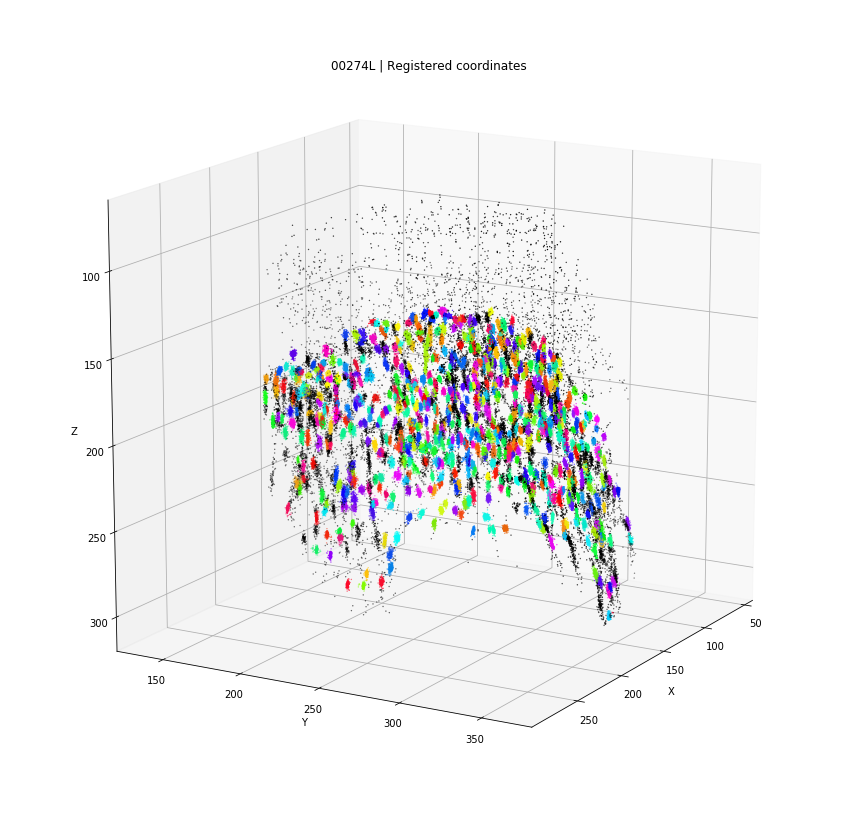
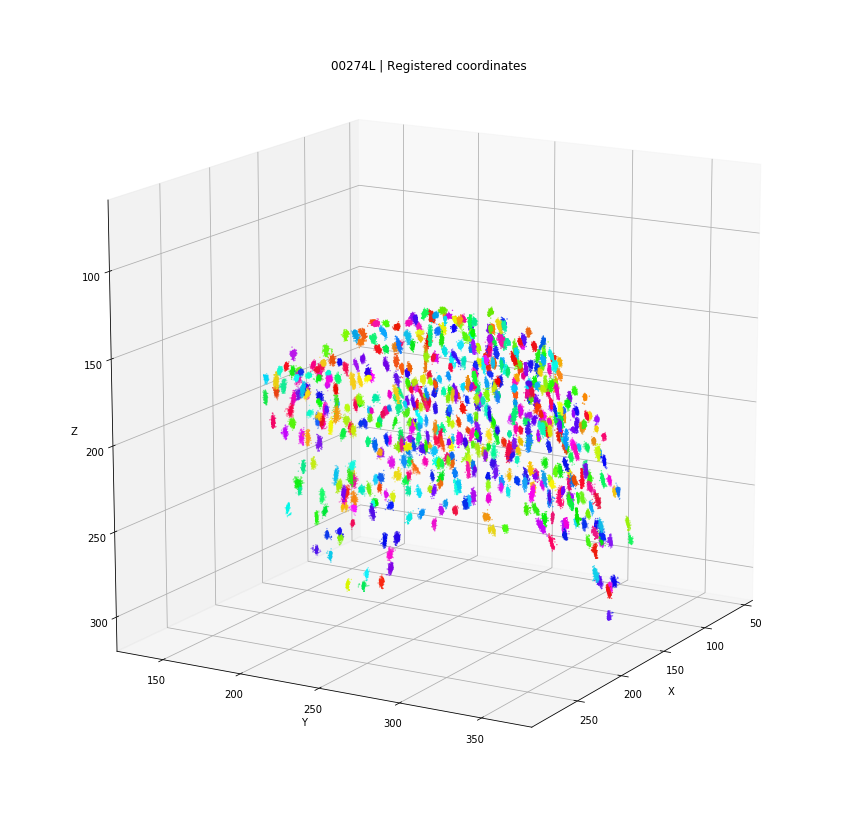

time frames

clusters
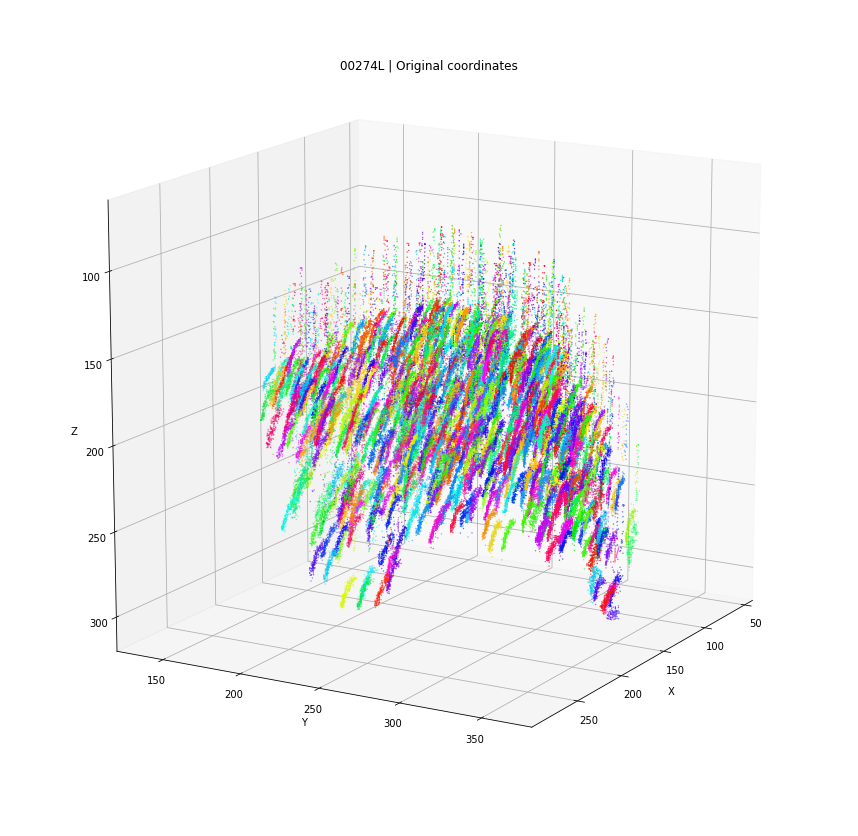
Clusters in original coordinates
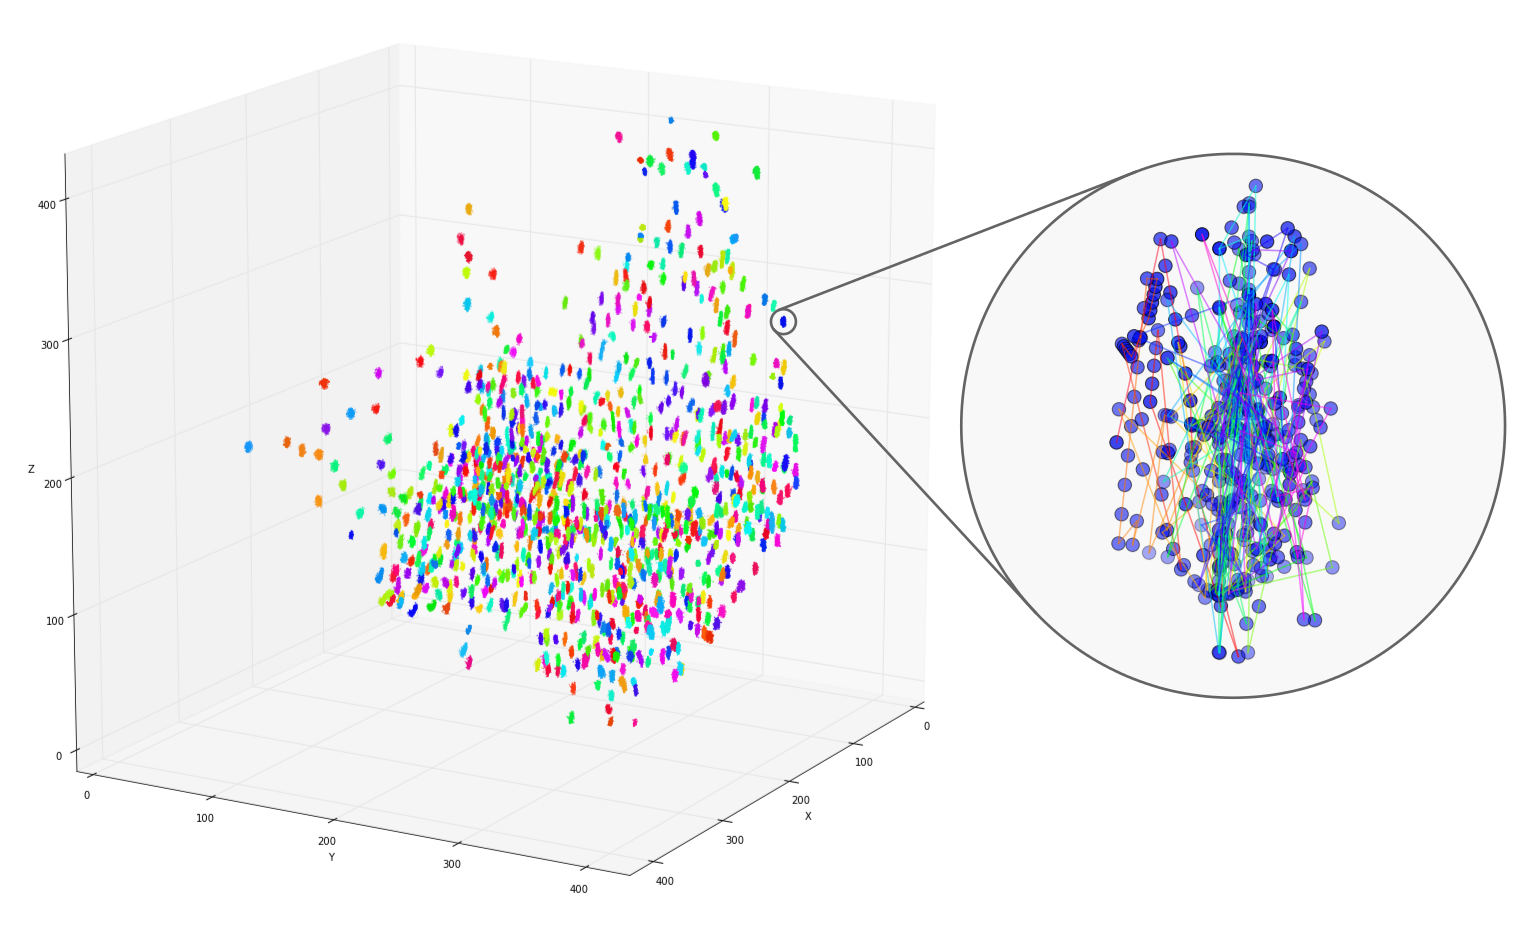

time frames
0
400
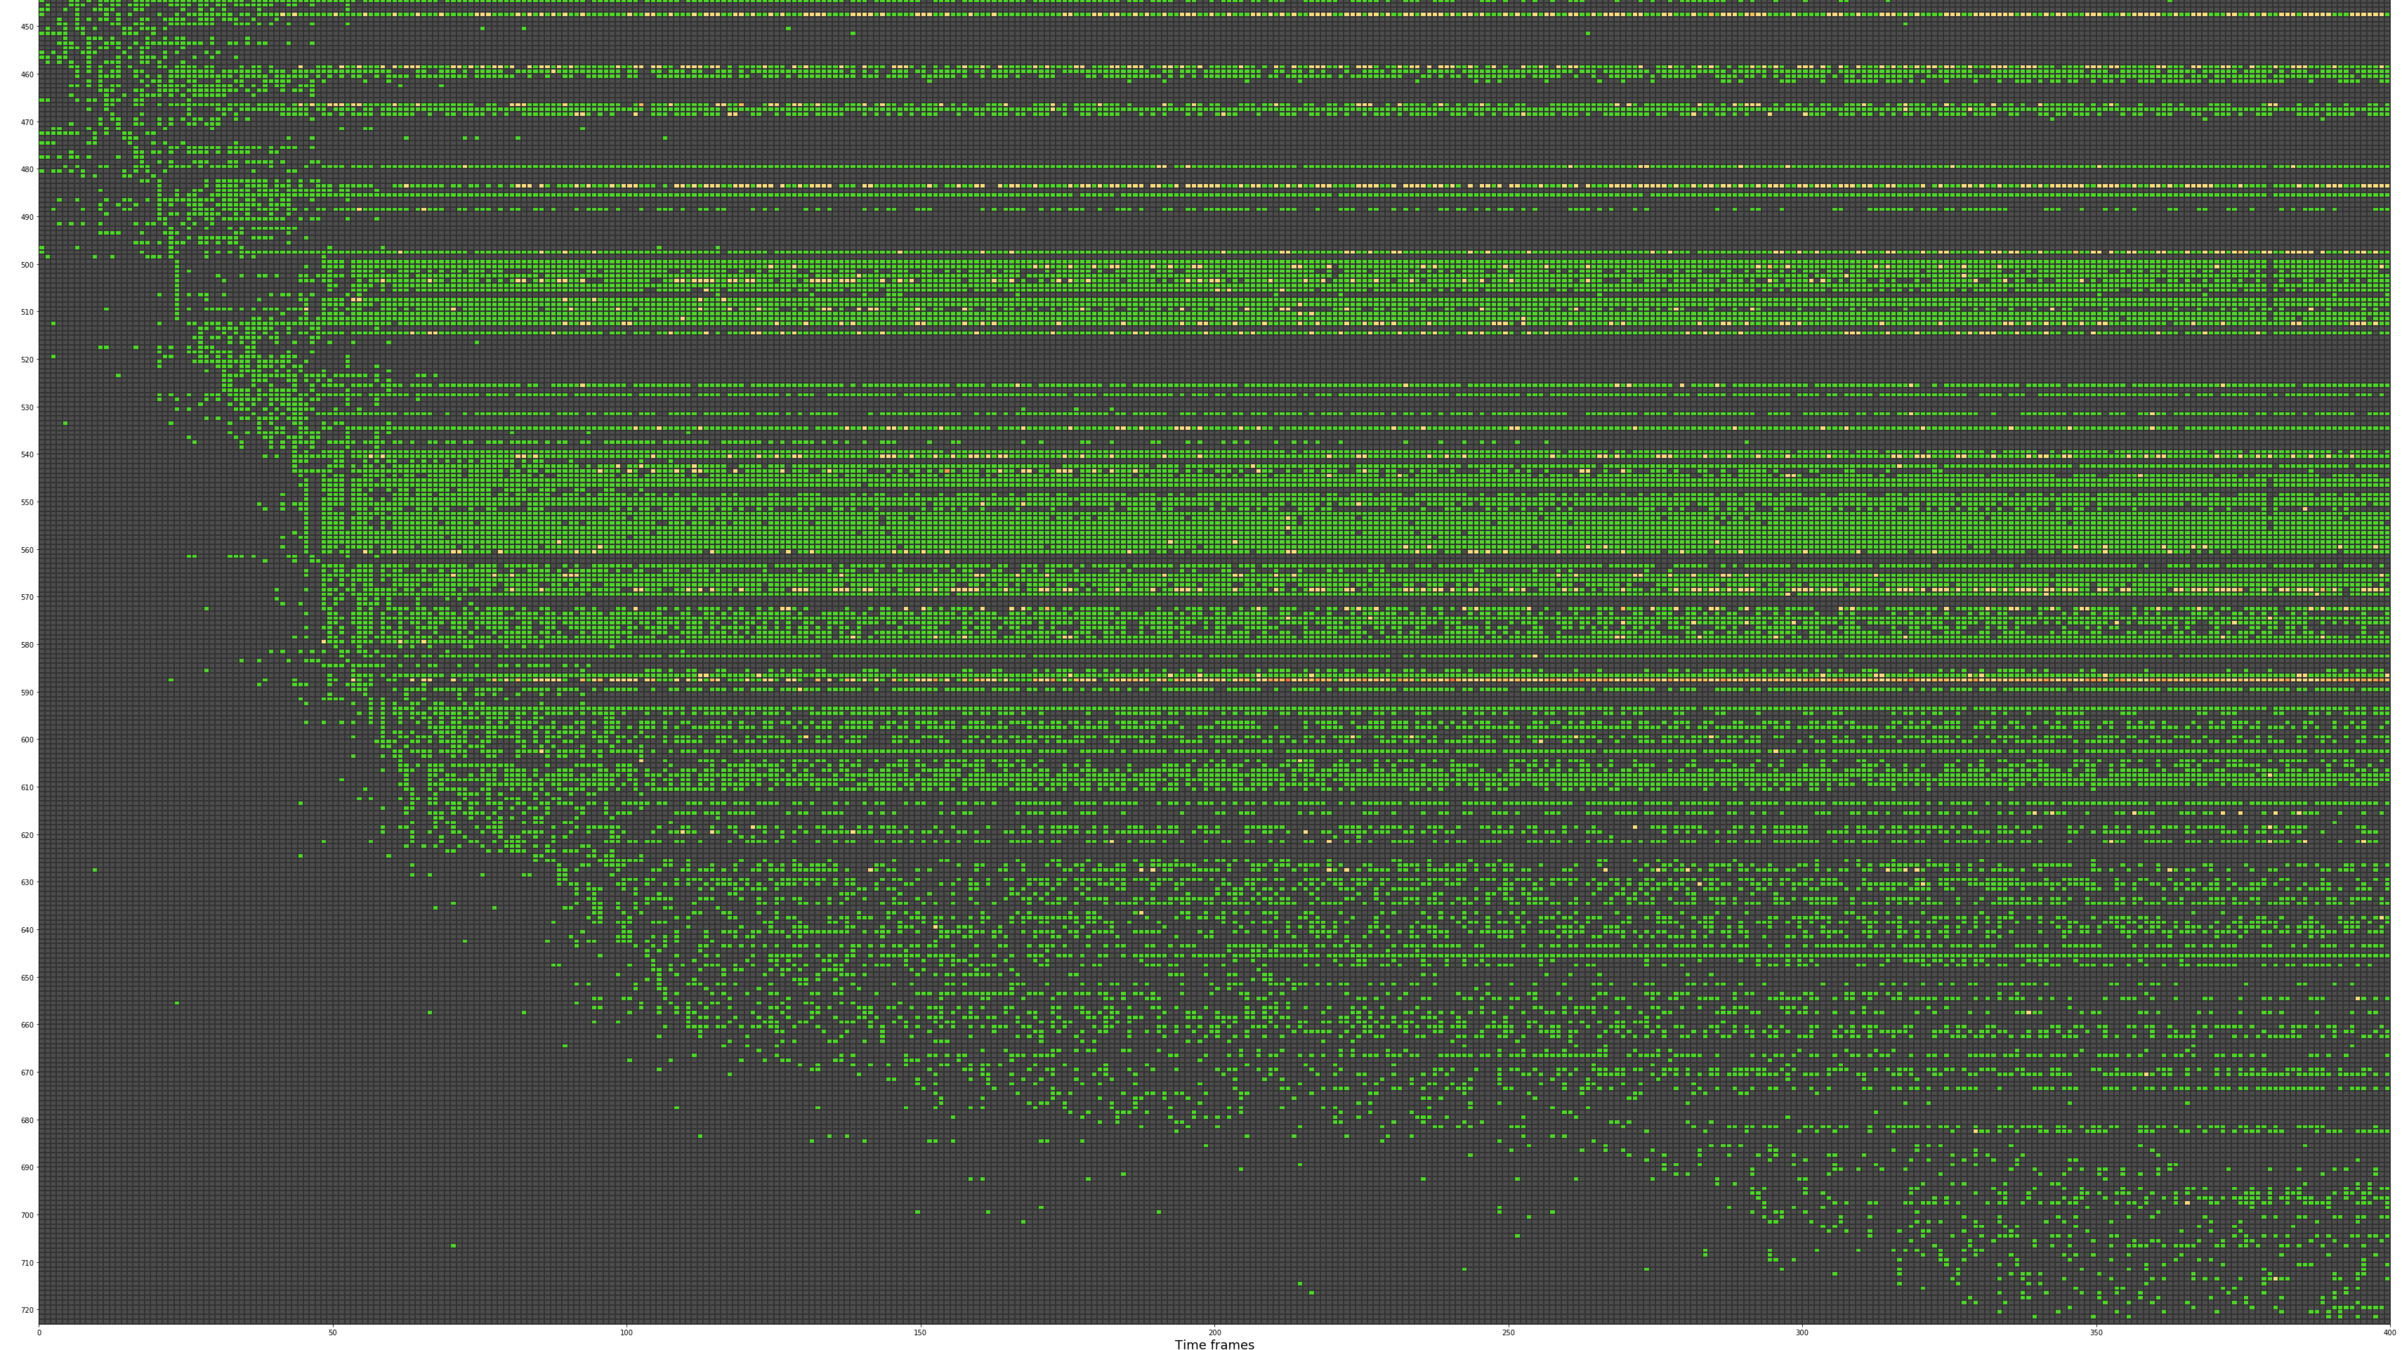
Every detection projected into a single 3D space
Tracks for one of the detected clusters

cluster fix
using time information to fix merged clusters

cluster fix
using time information to fix merged clusters

cluster fix
using time information to fix merged clusters

cluster fix
using time information to fix merged clusters

cluster fix
using time information to fix merged clusters
original detections
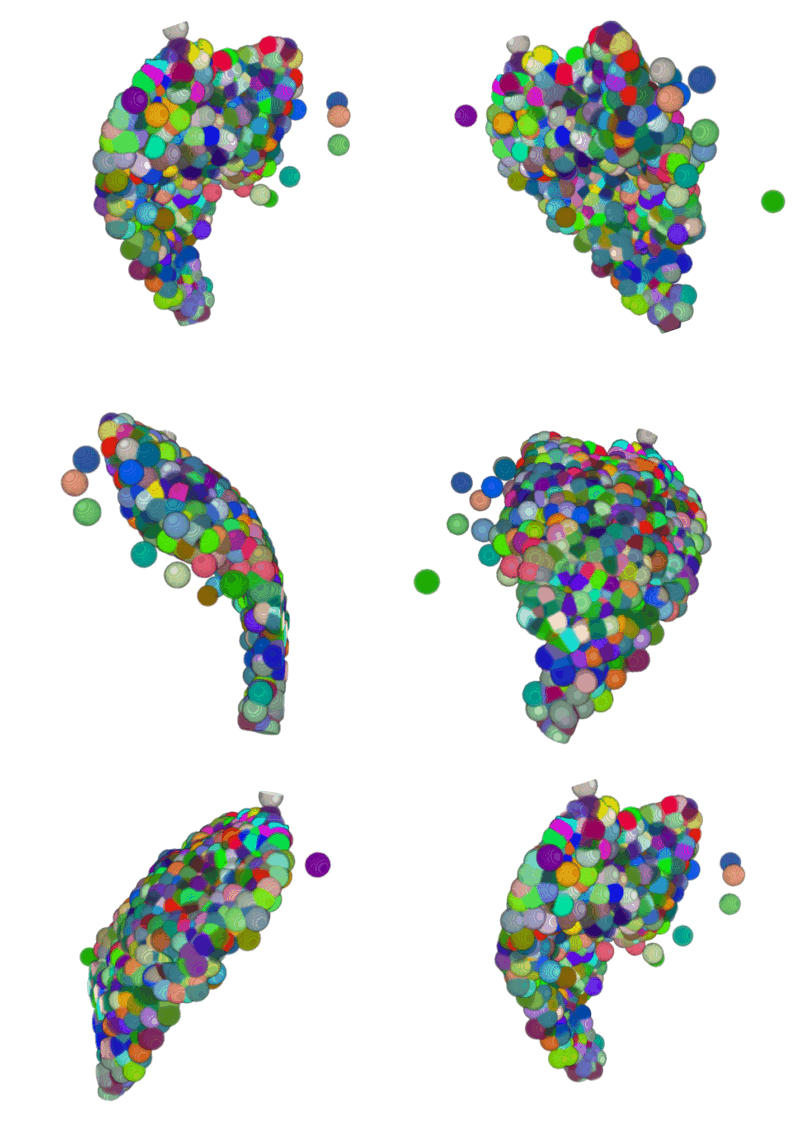
tracked nuclei
DETECTION
TRACKING
SIGNAL
Measuring signal
The last step is to actual measure the activity signal from the neurons, while the fly receives a stimulus
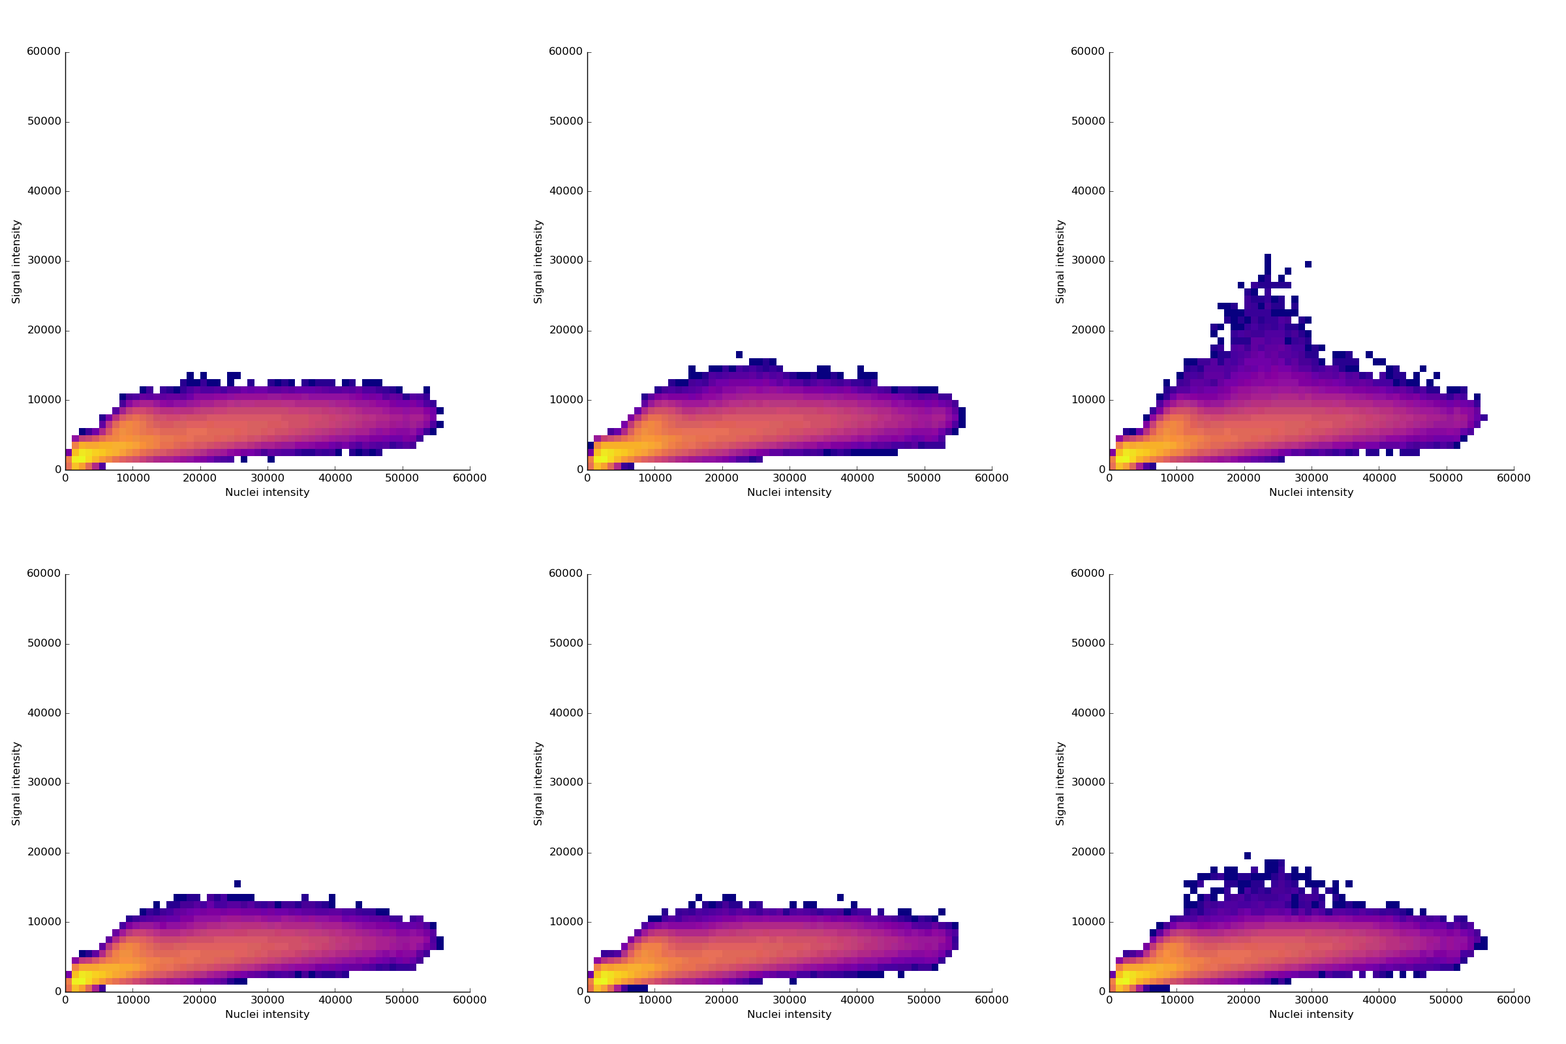
intensity 2d histogram
Nuclei & Signal
Axial max projection
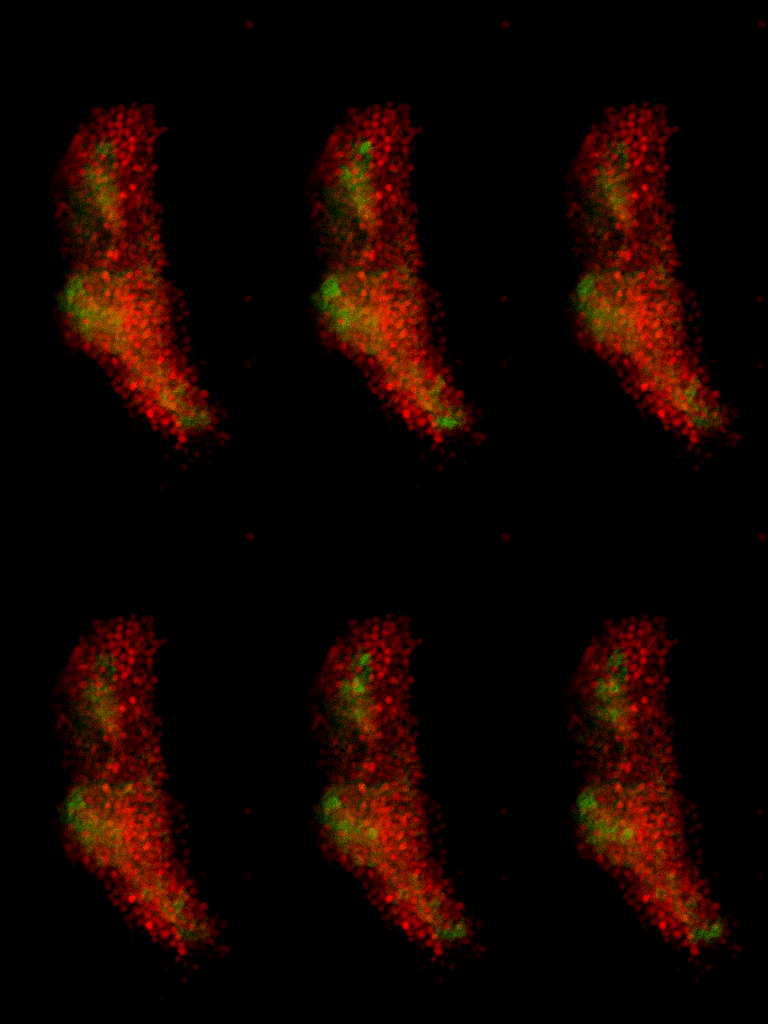
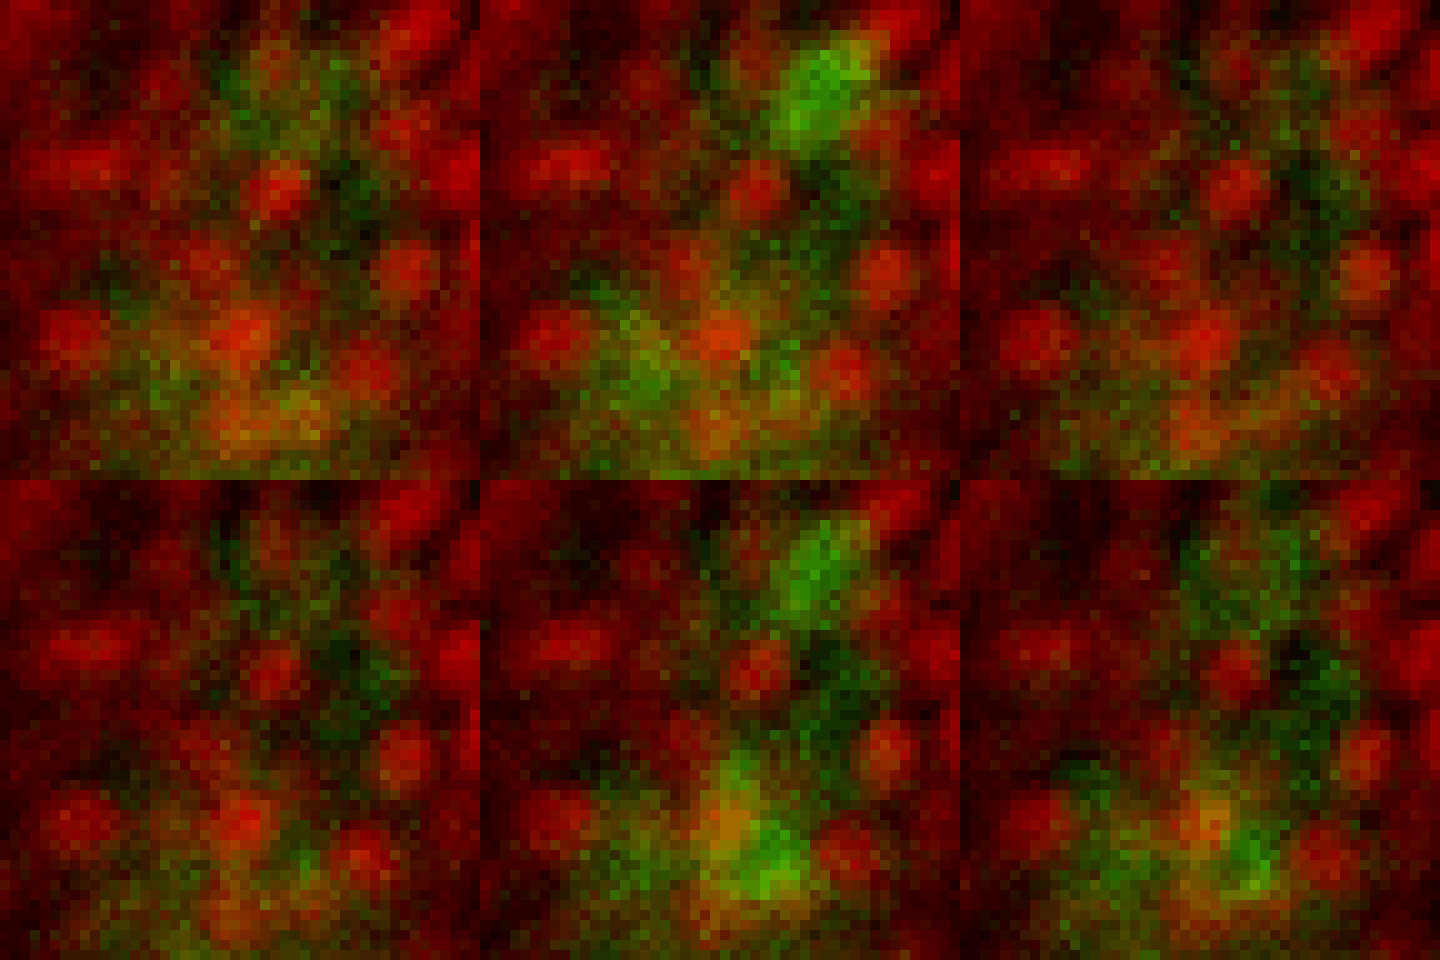
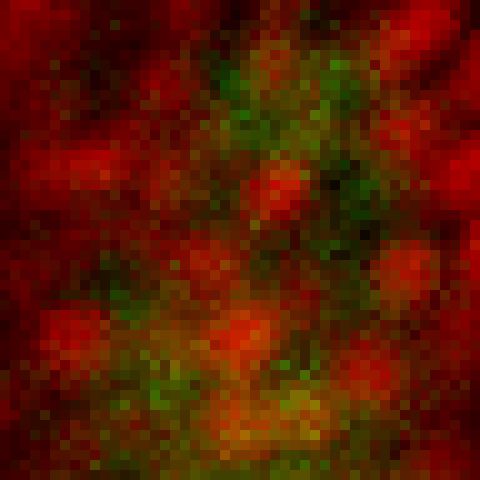

before stim
during stim


Memory traces

What are the quantitative changes in the brain to represent the memory trace ?

unpaired control

paired conditioning


Unpaired (no long-term memory)
Paired (long-term memory formed)

Neuron recruitment
Response intensity
Mann-Whitney two-sided test
p-value: 0.0014
t-test
p-value: 0.248
Contributions
Data acquisition
Detection & Tracking
Memory traces
Fine-tuning of a system capable of acquiring 3D+Time images of the Mushroom body, while the fly experiences an odor
Development of an open-source and fully automated detection and tracking algorithm, capable of handling the high density of neurons and movements of the brain
This unique set-up allowed us to quantify, for the first time, the recruitment of new neurons during long-term memory formation
Perspectives

Graph features
More subtle characteristics of the neuronal activation pattern could be revealed by the use of graphs
Training during acquisition
An update on the fly chamber could allow the electric stimulation during the imaging, showing live how the brain is reacting

Genetic modifications
The system here developed would allow us to verify how different levels of expression of specific genes change the neuron recruitment
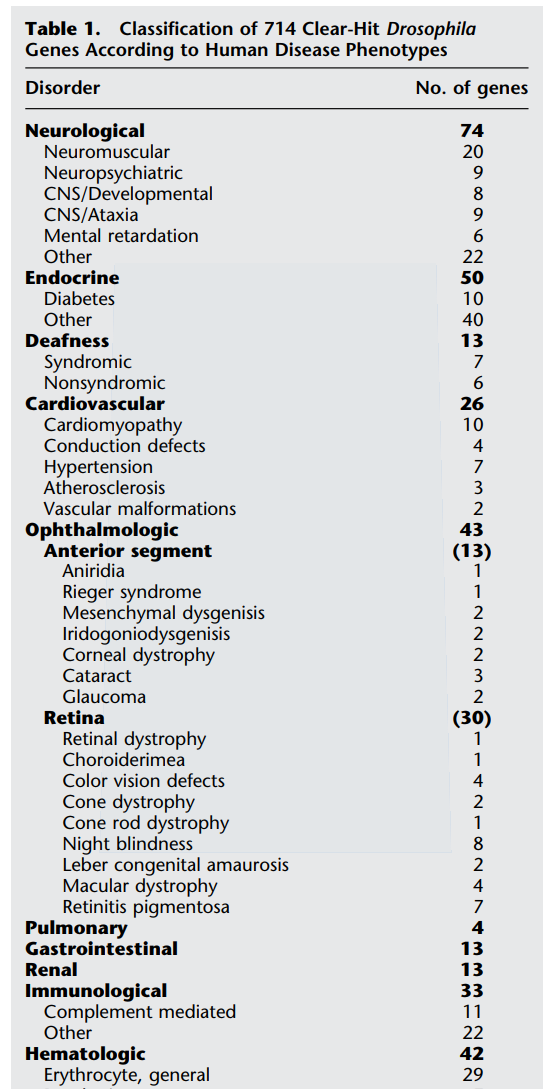

Song, L. L., Liang, R., Li, D. D. & Al., E. A
Systematic Analysis of Human Disease-Associated Gene Sequences In Drosophila melanogaster.
Genome Res. 59, 1114–1125 (2001)




2015
2016
Jul Aug Sep Oct Nov Dec Jan Feb Mar Apr May Jun Jul Aug Sep Oct Nov Dec Jan Feb Mar Apr May Jun Jul Aug Sep Oct Nov Dec Jan Feb Mar Apr May Jun Jul Aug Sep Oct Nov Dec Jan Feb Mar Apr May Jun Jul Aug Sep Oct
2014
AUGUSTE GENOVESIO
FELIPE DELESTRO
MINHUI WU
THOMAS PREAT
PAUL TCHENIO
MELANIE PEDRAZZANI
YANN DROMARD
LISA SCHEUNEMANN
2017


2018
Computational Bioimaging and Bioinformatics
Auguste Genovesio
Elise Laruelle
France Rose
Nikita Menezes
Tiphaine Champetier
Toni Paternina
Solène Weill
Mathieu Bahin
Amira Kramdi
Ouardia Ait Mohamed
Maxime Corbé
Guillaume Delevoye
Fatemeh Habibolahi
Benoit Noël
Delase Amesefe
Alice Othmani
Ayfer-Marie Montibus
Asm Shivuddin
Perrine Lacour
Sreetama Basu
Charles Bernard
Jennifer Salazar
Alexis Renault
Leila Bastianelli
Minhui Wu
Elton Rexhepaj
Quentin Viautour
Charles Wang
Yingbo Li


Supplementary slides
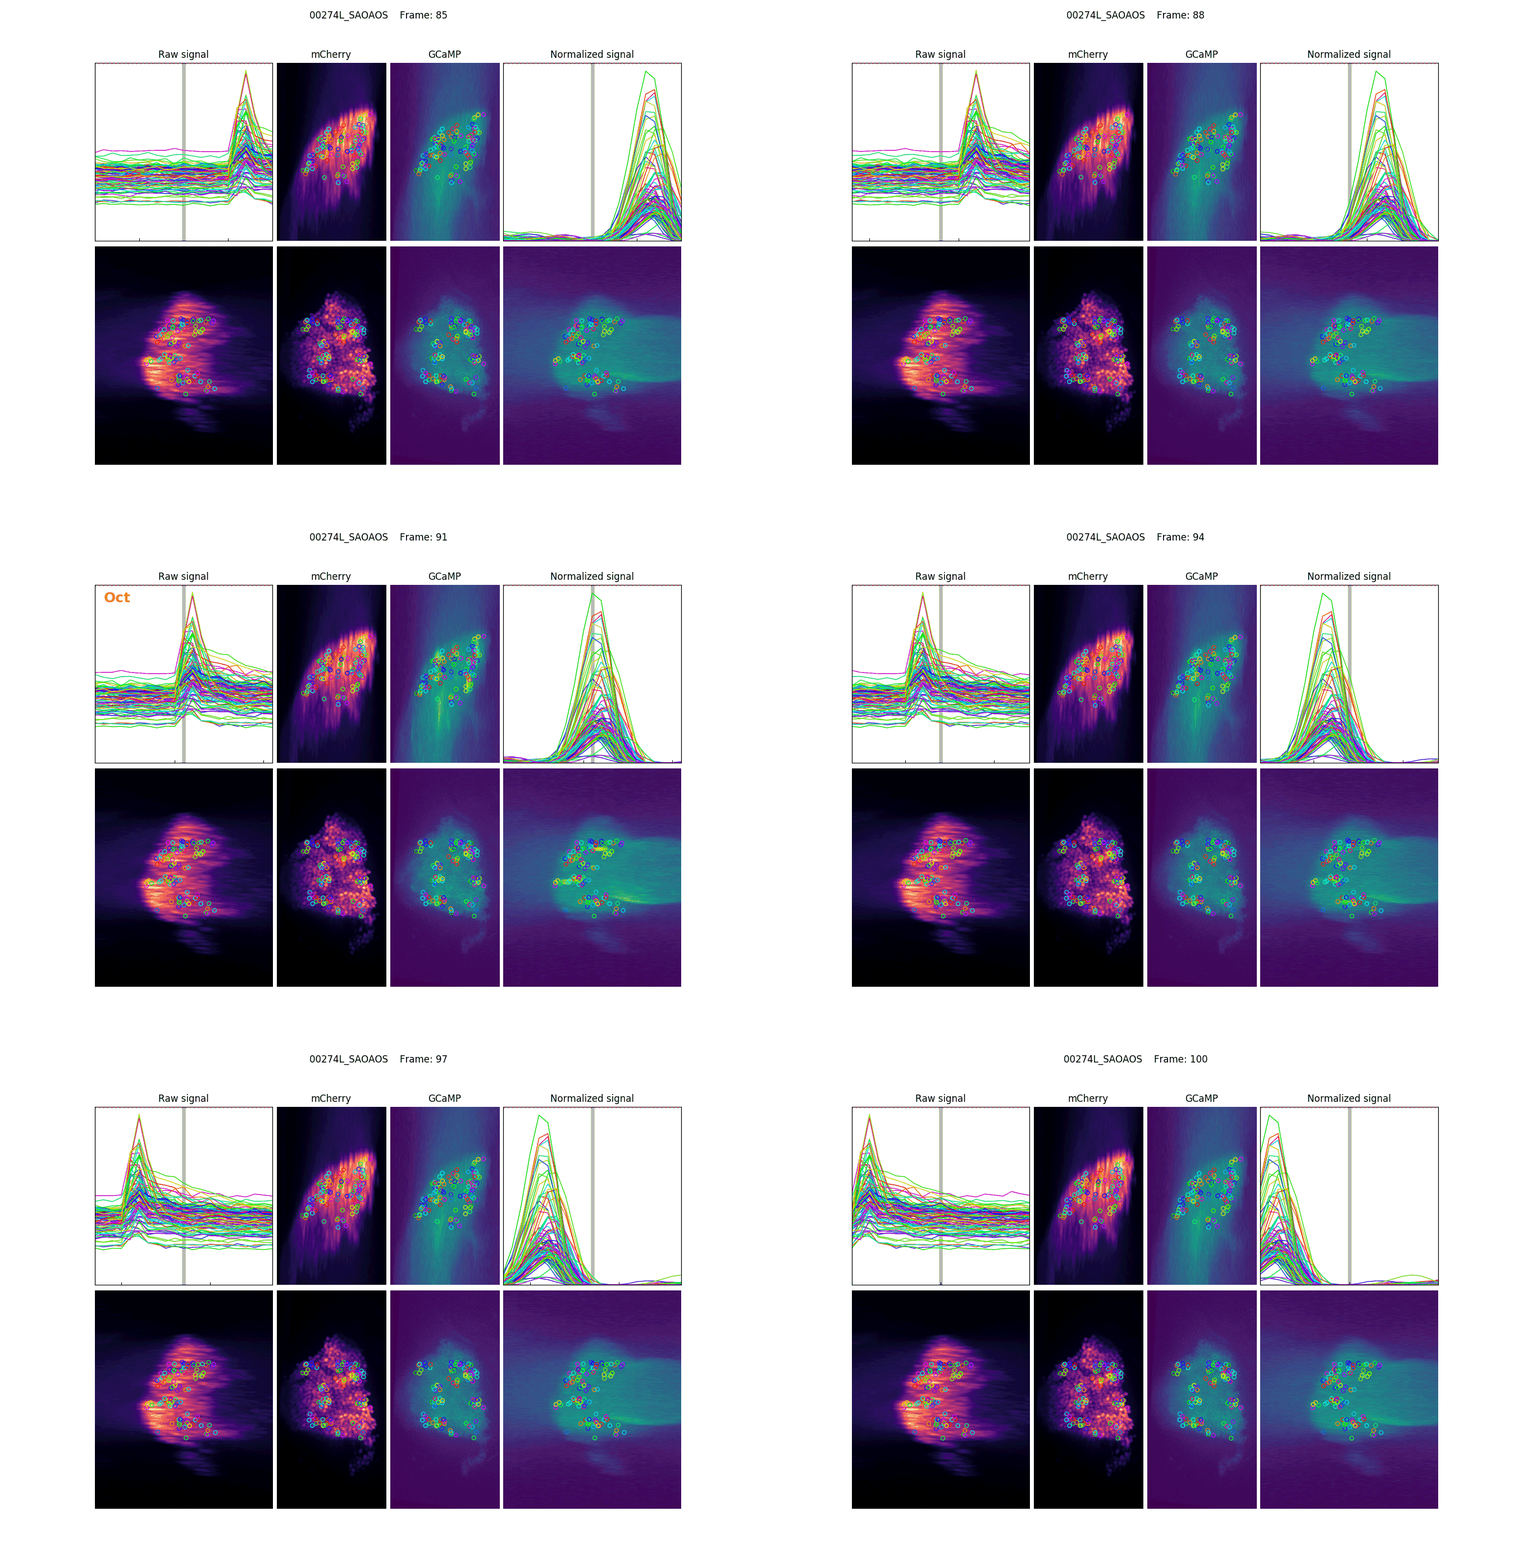
Projections, detections & signal
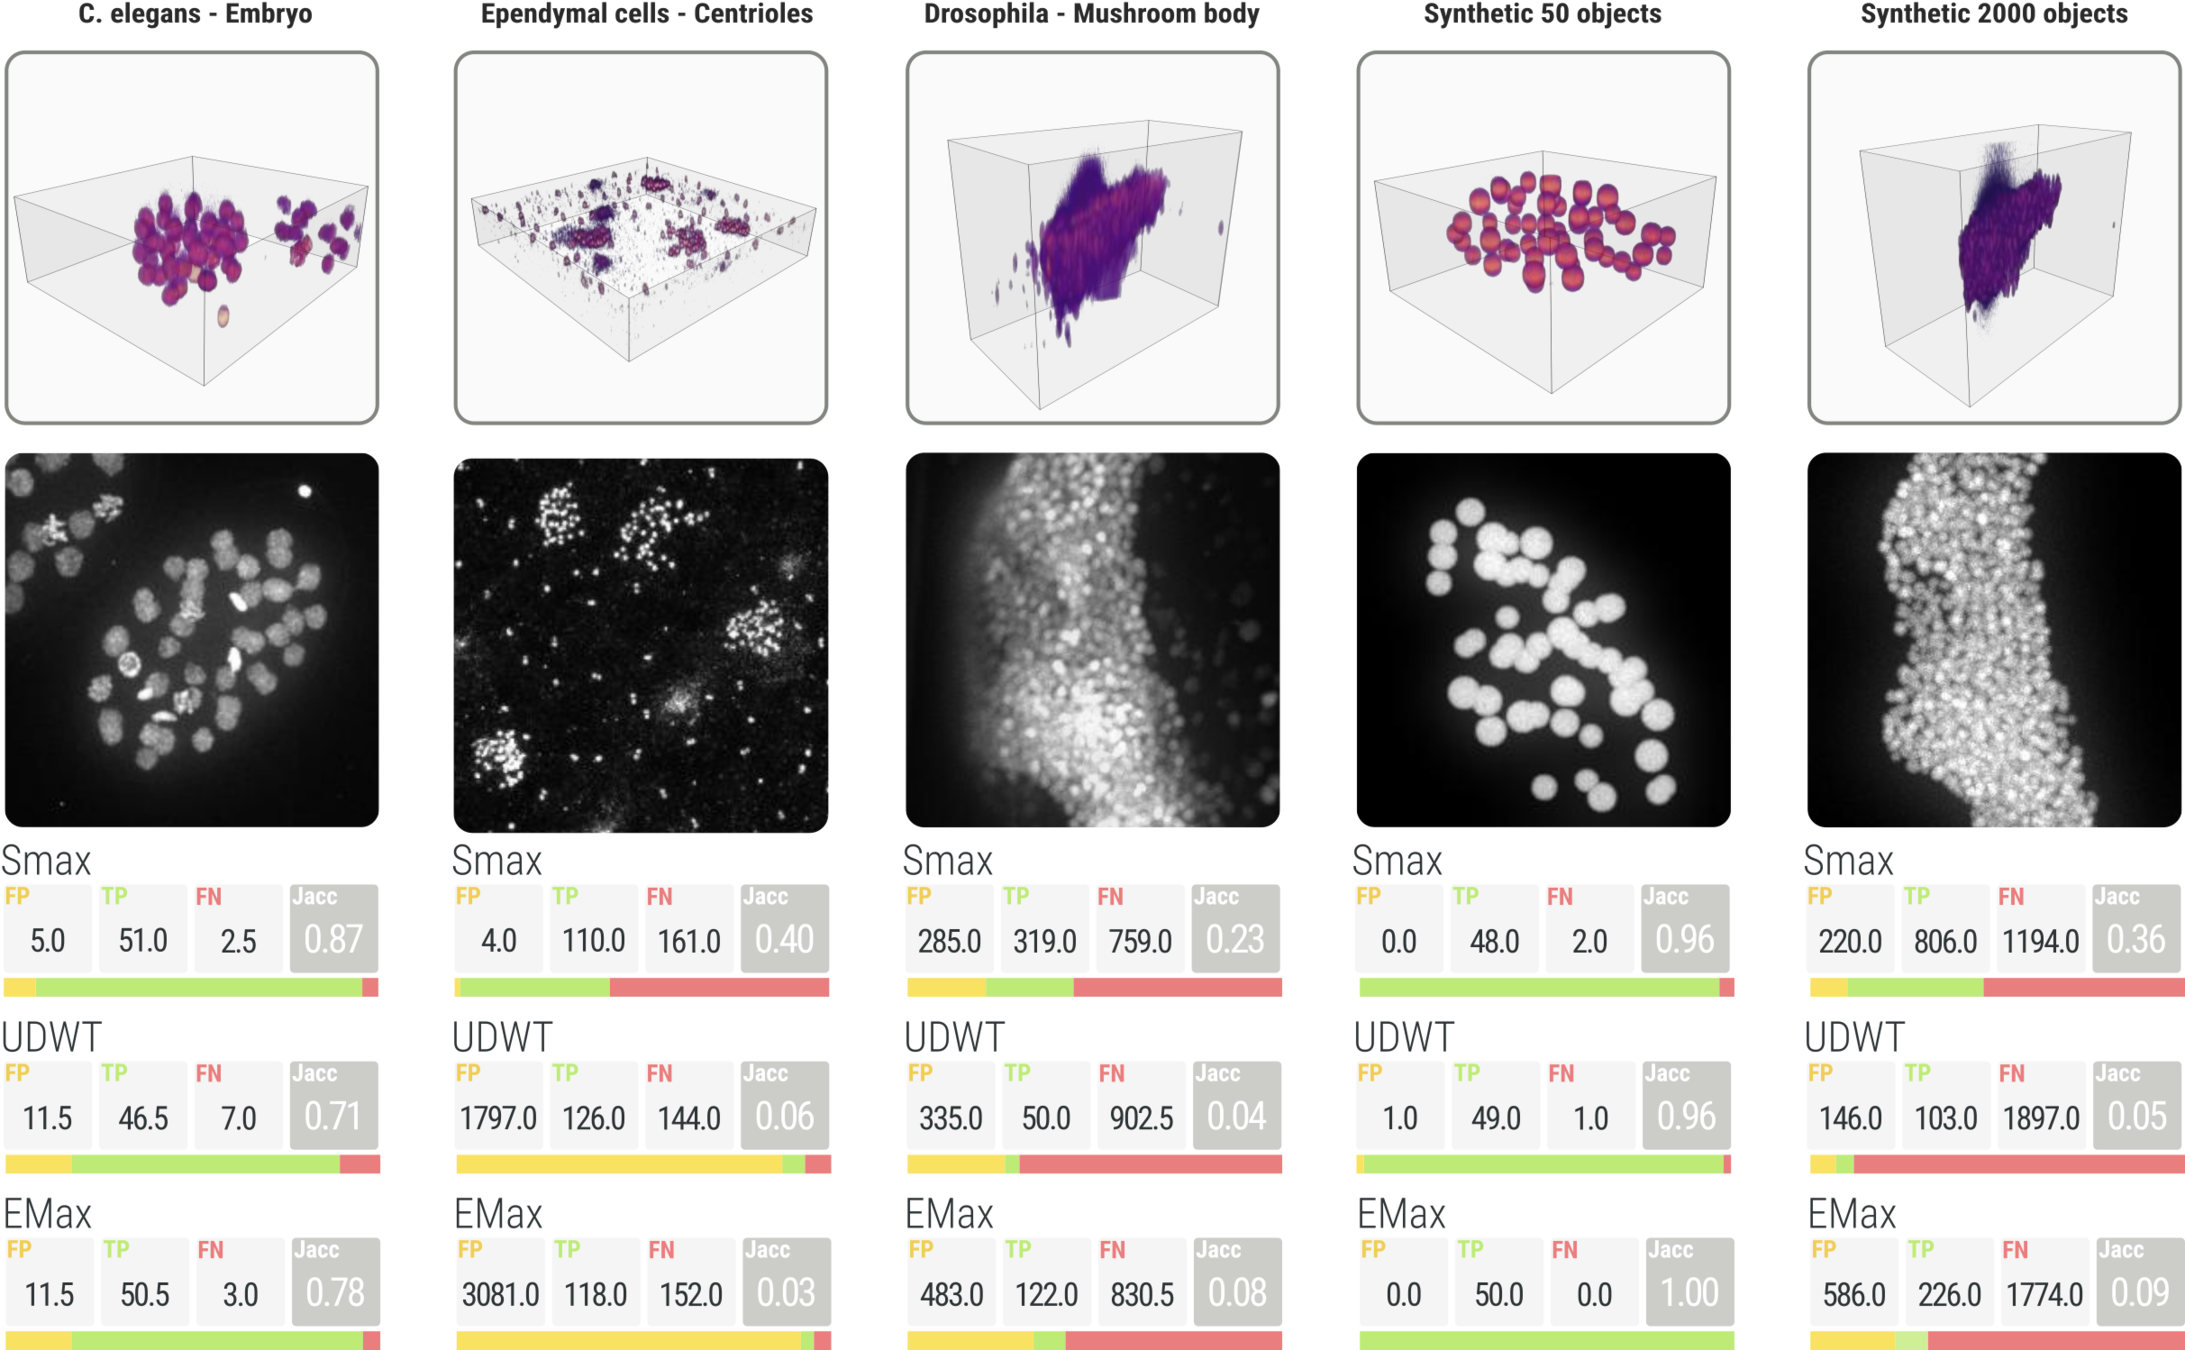
SMAX comparison
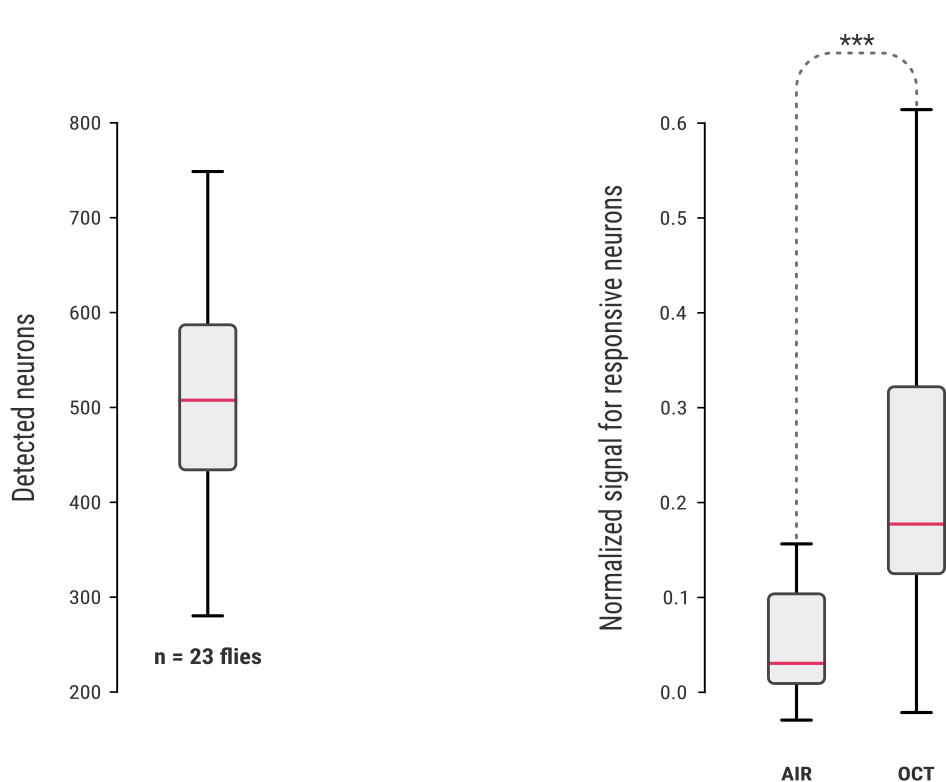
standardization with naïve flies
Detection on naive flies
Volumes from
groups

Automated fly filter
Naïve
Paired
Unpaired

AIR
OCT
AIR
AIR
OCT
AIR


MCH
AIR
MCH
AIR


Paired
control
Unpaired
control
OCT

OCT

OCT

OCT

OCT

MCH groups
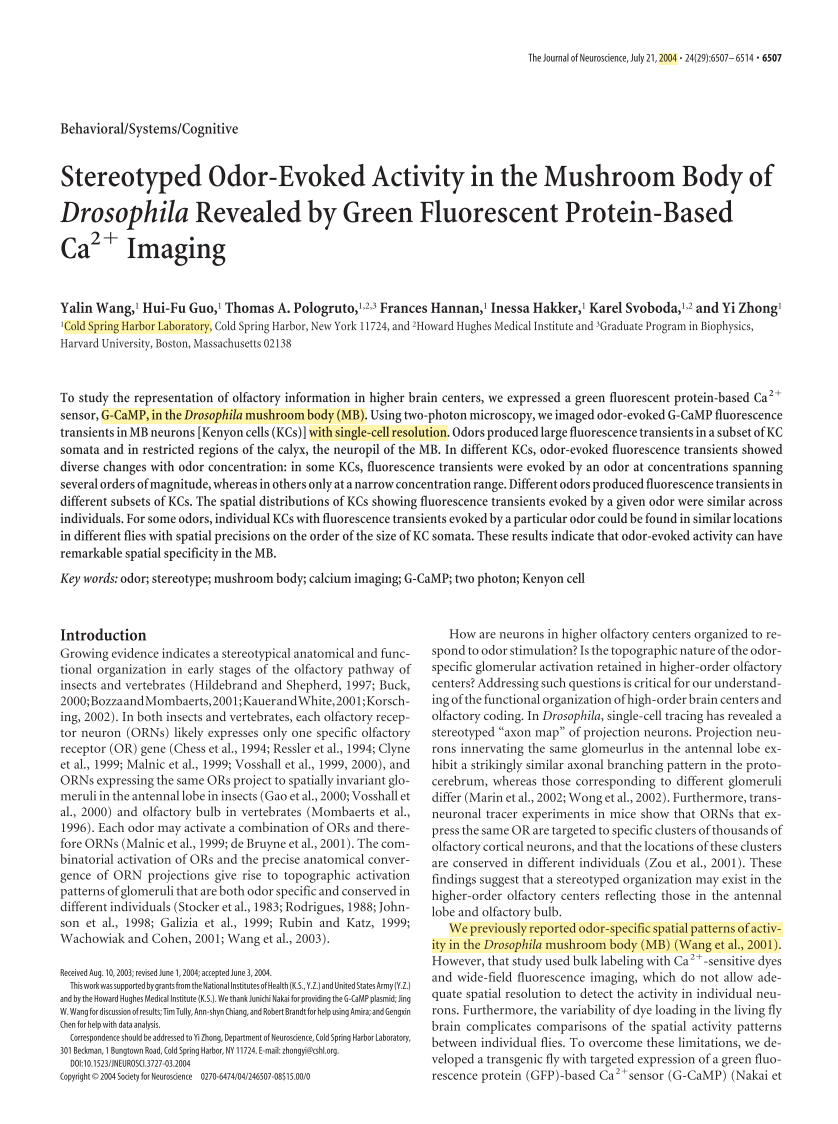
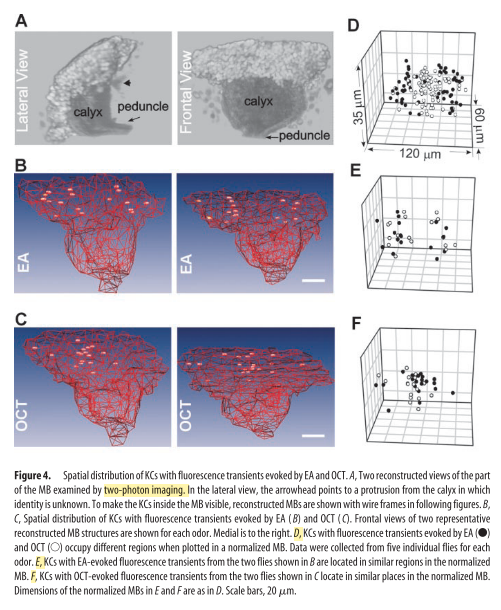
3D detections paper


MB details
Frame 1
Frame 2
Frame 3
Frame 1
Frame 2
Frame 3

DBSCAN
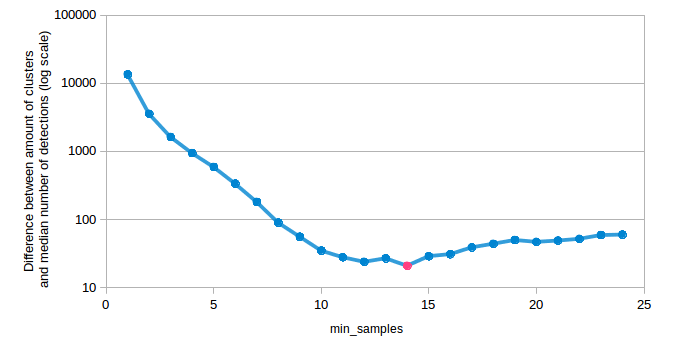
DBSCAN parameter scan

Detection removal without split
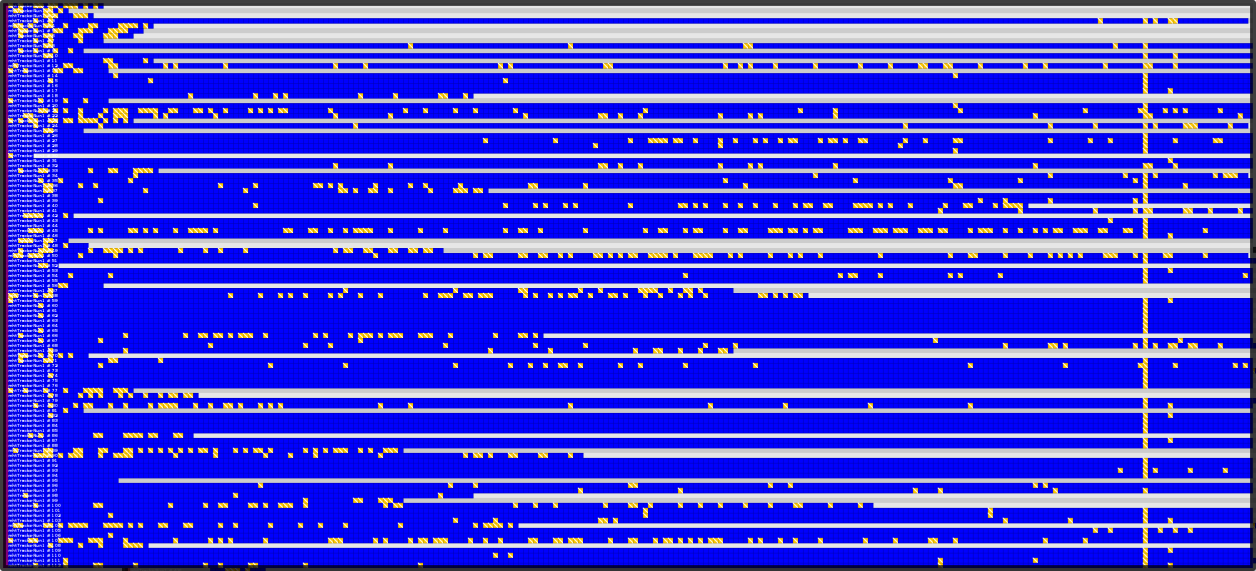
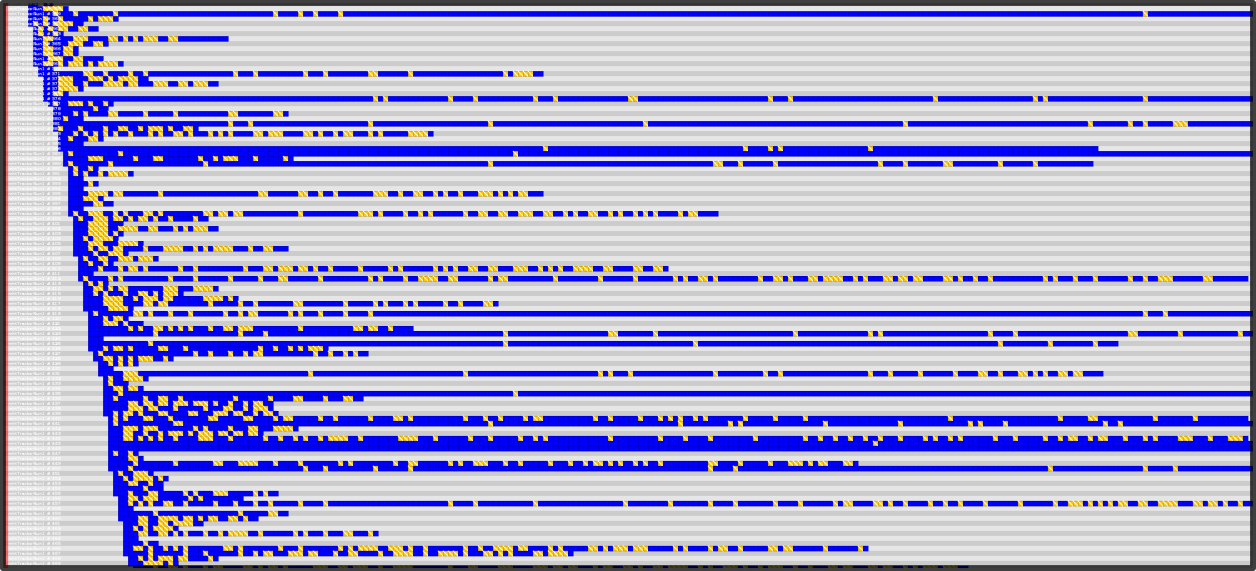
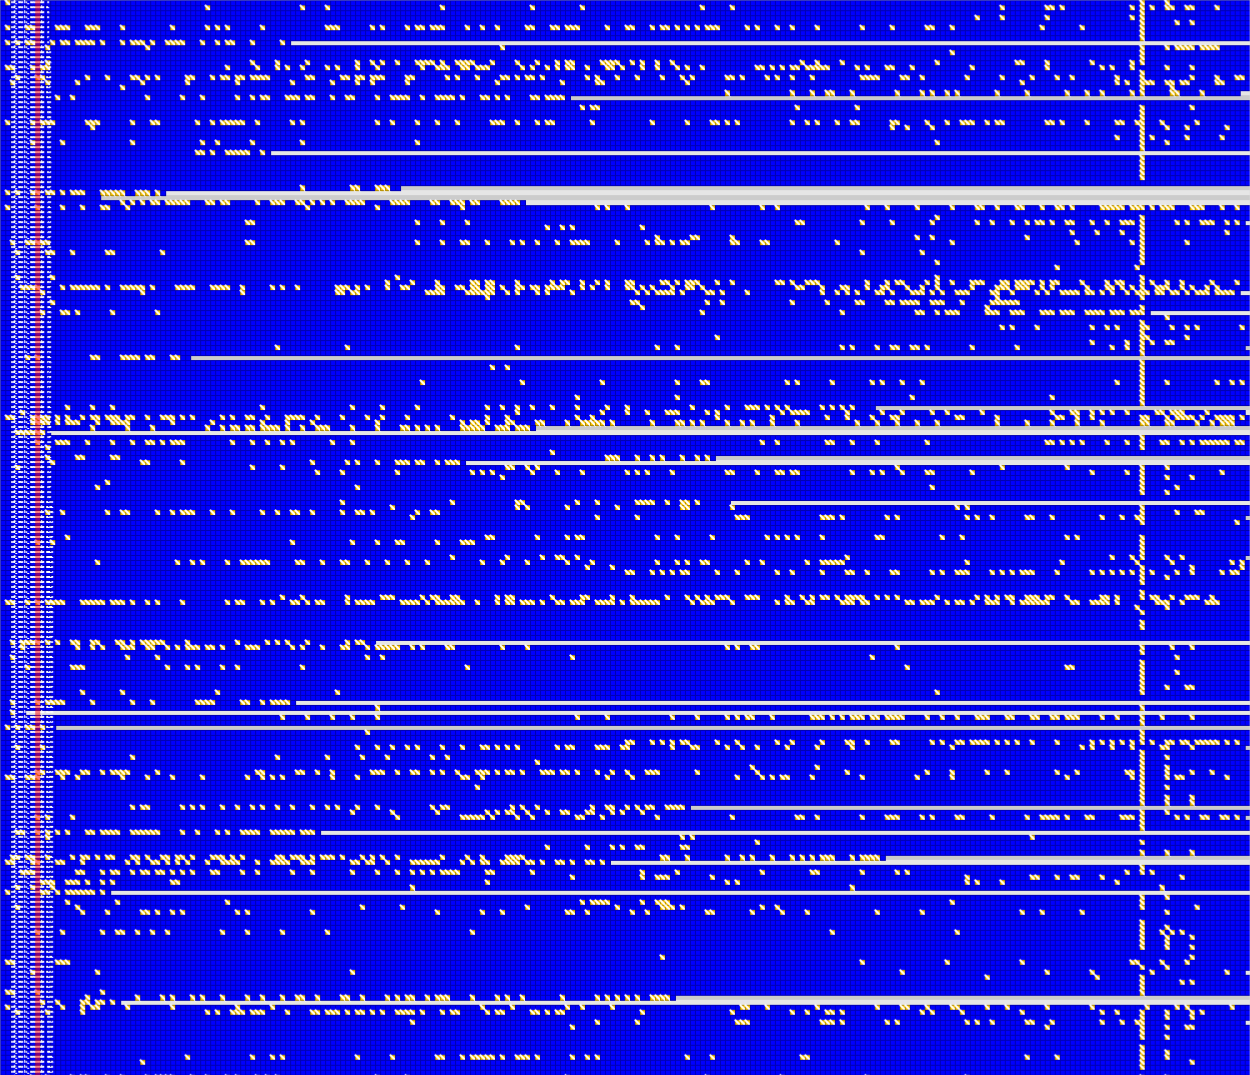
ICY Multiple hypothesis tracking

Variables
- Expected track length
- Minimum probability of existence for confirmation
- Probability of existence threshold
- Expected XY displacement
- Expected Z displacement
- Expected new objects per frame
- Expected number of objects in first frame
- Depth of track trees
- Gate factor for association
real
synthetic
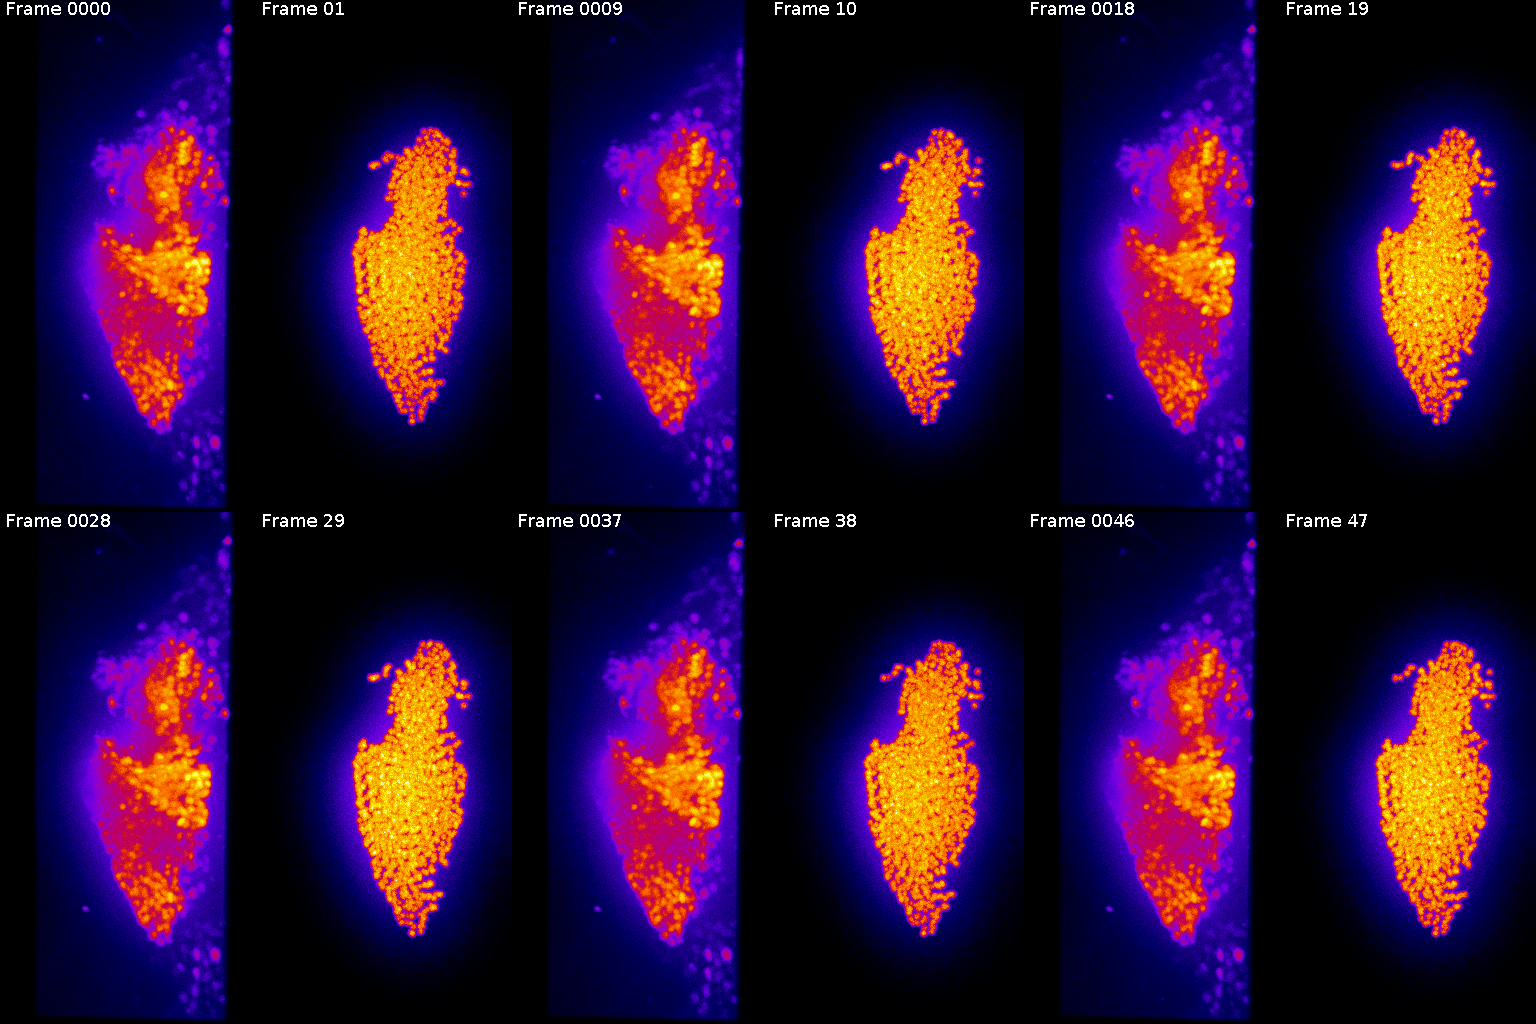
Synthetic movie
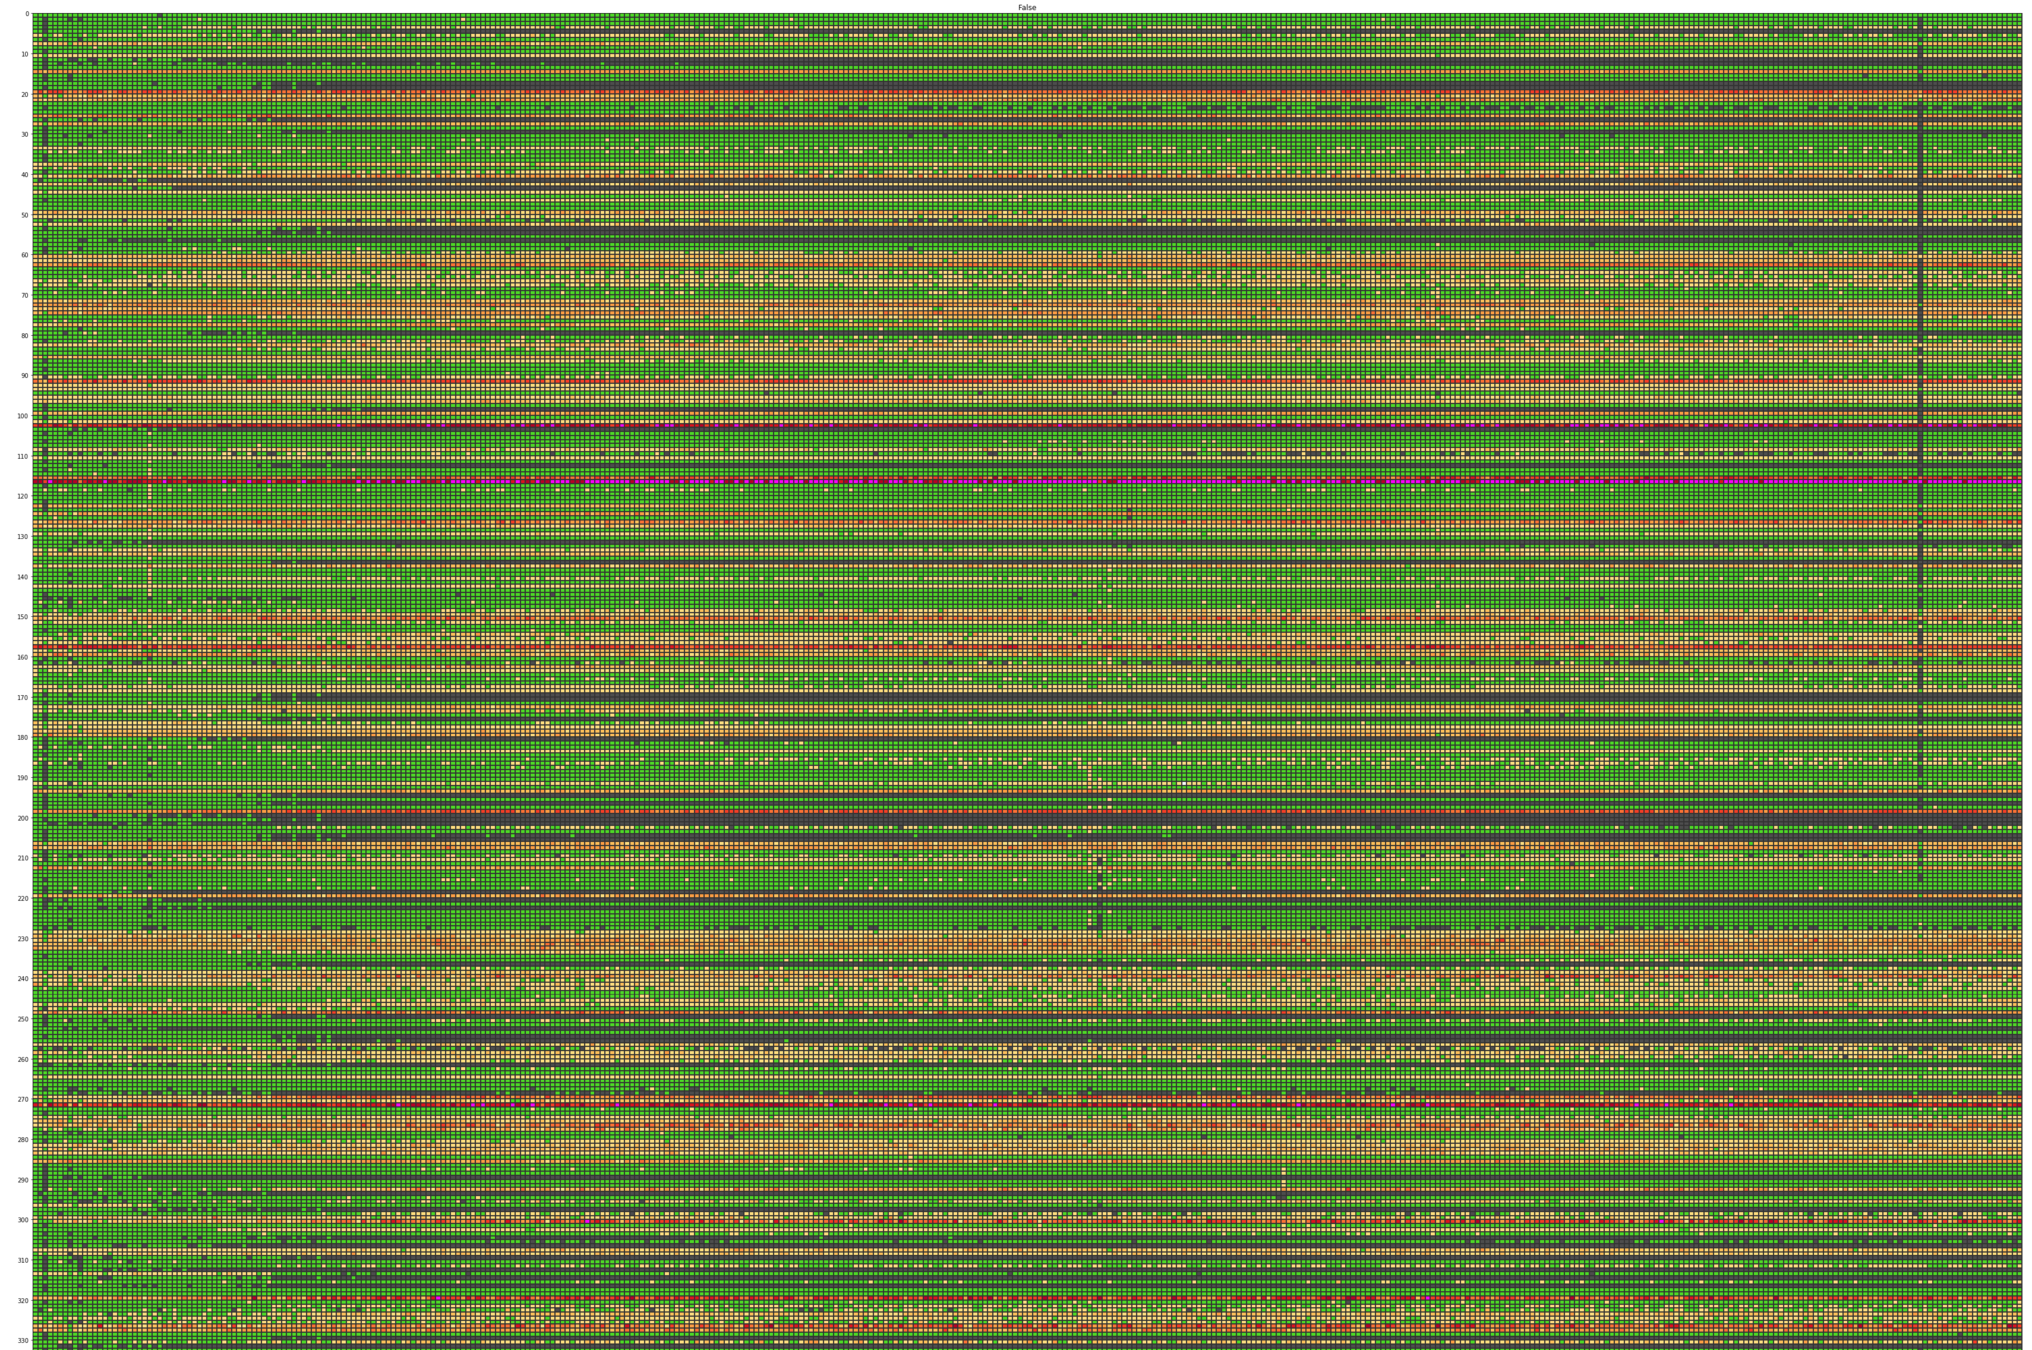
Detection tracks with duplicates
Starting cluster stage...

Estimation of eps for DBSCAN:
Calculating distances between pairs: [65 & 178] [44 & 57] [254 & 2] [52 & 13] [88 & 110] [221 & 104] [163 & 138] [239 & 166] [234 & 133] [382 & 393] [381 & 247] [1 & 301] [335 & 102] [88 & 273] [83 & 11] [68 & 313] [321 & 58] [214 & 186] [351 & 350] [207 & 127] [232 & 394]
Done after 21 iterations, normal distribution with pvalue of 0.0341911133526

Global mean distance:	7.80852894987
Estimated eps value:	3.90426447493

Estimation of min_samples for DBSCAN:
Target: 726.615 clusters

6873 clusters for min_samples of 1	Difference from target: 6146.385
1946 clusters for min_samples of 2	Difference from target: 1219.385
892 clusters for min_samples of 3	Difference from target: 165.385
540 clusters for min_samples of 4	Difference from target: 186.615
419 clusters for min_samples of 5	Difference from target: 307.615
353 clusters for min_samples of 6	Difference from target: 373.615
278 clusters for min_samples of 7	Difference from target: 448.615
256 clusters for min_samples of 8	Difference from target: 470.615
227 clusters for min_samples of 9	Difference from target: 499.615
219 clusters for min_samples of 10	Difference from target: 507.615
215 clusters for min_samples of 11	Difference from target: 511.615
209 clusters for min_samples of 12	Difference from target: 517.615
216 clusters for min_samples of 13	Difference from target: 510.615

Best value for min_samples: 3

Initializing final DBSCAN...
eps: 3.90426447493
min_samples: 3
Number of clusters: 892
DBSCAN parameter estimation
Checking and fixing clusters...
Number of labels with duplicates: 70 (7%)
Resolving duplicates . . . . . .
62 cases with mode 0 (88%)
7 cases with mode 1 (10%)
0 cases with mode 2 (0%)
0 cases with mode 3 (0%)
0 cases with mode 4 (0%)
.
.
.
0 cases with mode 705 (0%)
0 cases with mode 706 (0%)
0 cases with mode 707 (0%)
1 cases with mode 708 (1%)

Remaining duplicates: 699
Number of labels with duplicates: 699 (43%)
Resolving duplicates . . . . . . . . . . . . . . . . . . . . . . . . . . . . . . . . . . . . . . . . . . . . . . . . . . . . . . . . . . . . . . .
197 cases with mode 0 (28%)
433 cases with mode 1 (61%)
69 cases with mode 2 (9%)

Remaining duplicates: 126
Number of labels with duplicates: 126 (7%)
Resolving duplicates . . . . . . . . . . .
49 cases with mode 0 (38%)
77 cases with mode 1 (61%)

Remaining duplicates: 0
Iterative cluster fix
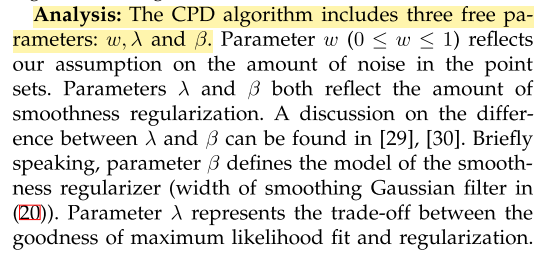
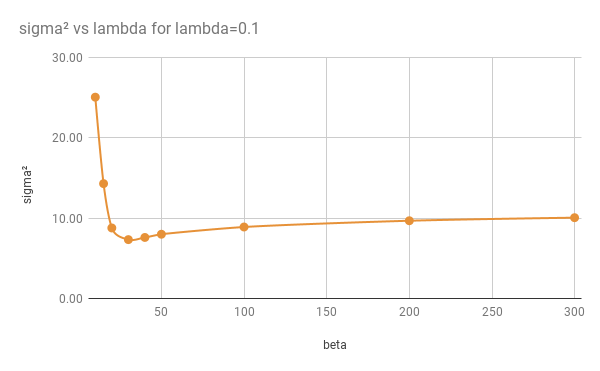
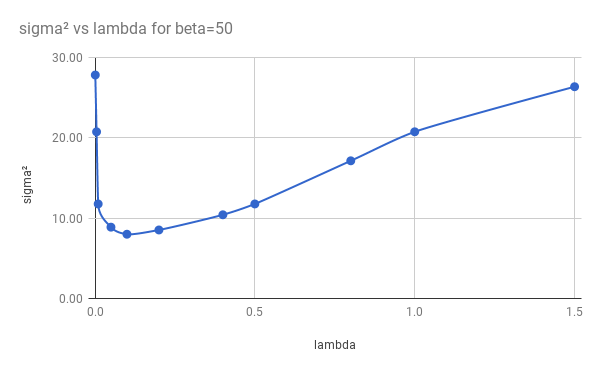
CPD parameters

Chained registration
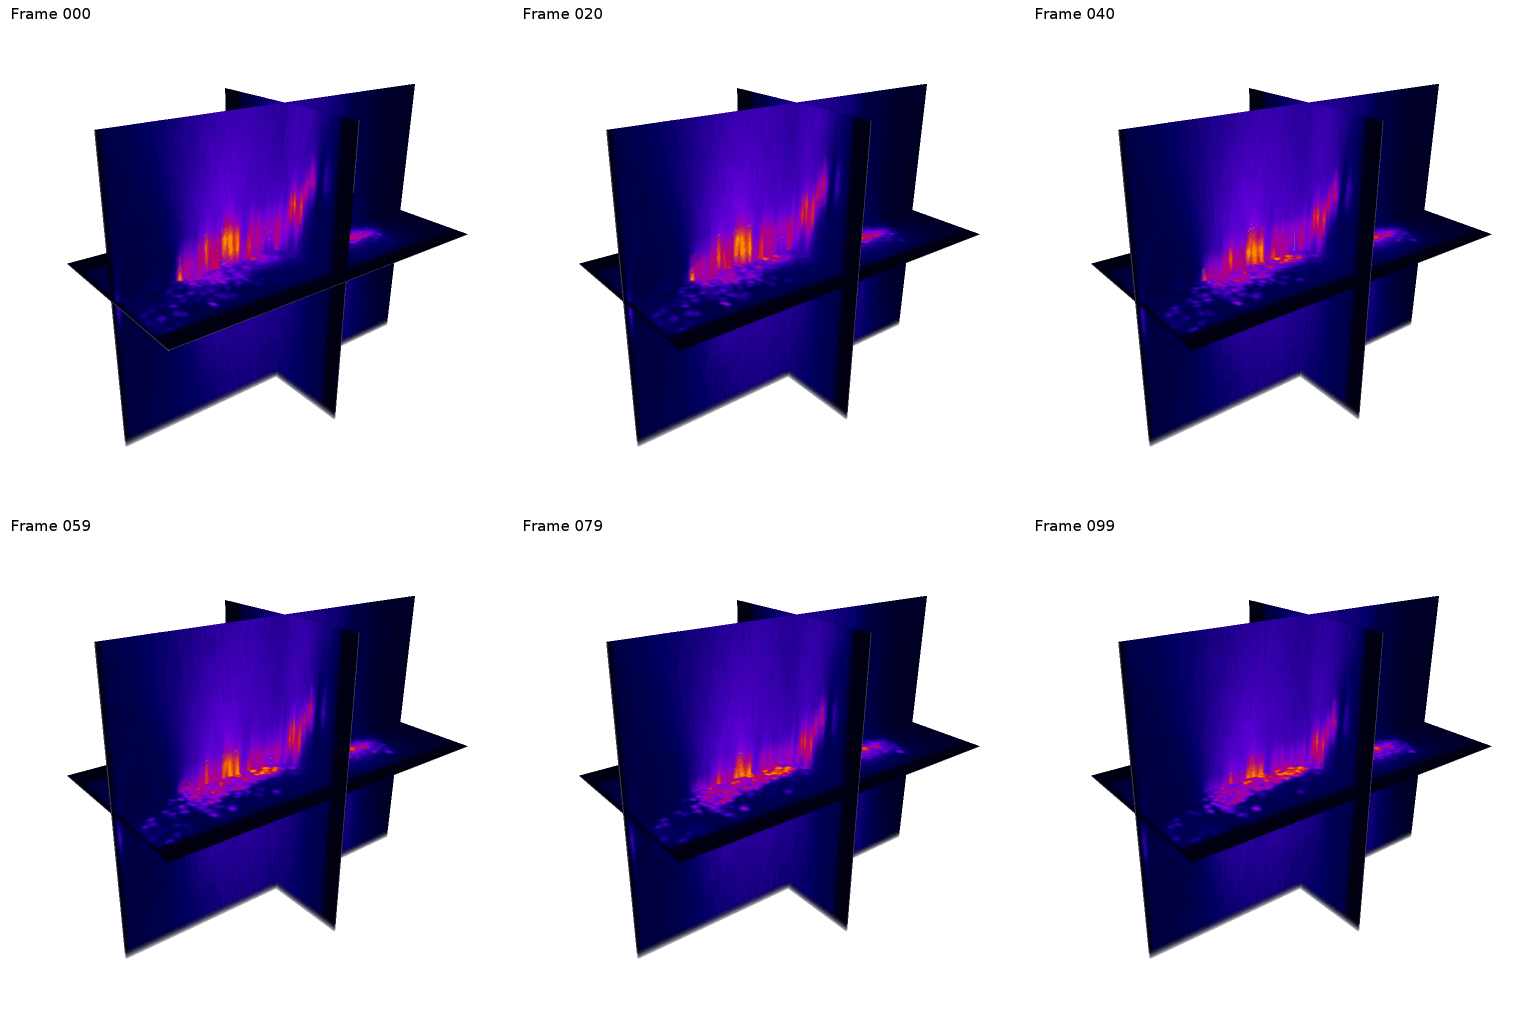
Axial drift through time
Axial drift

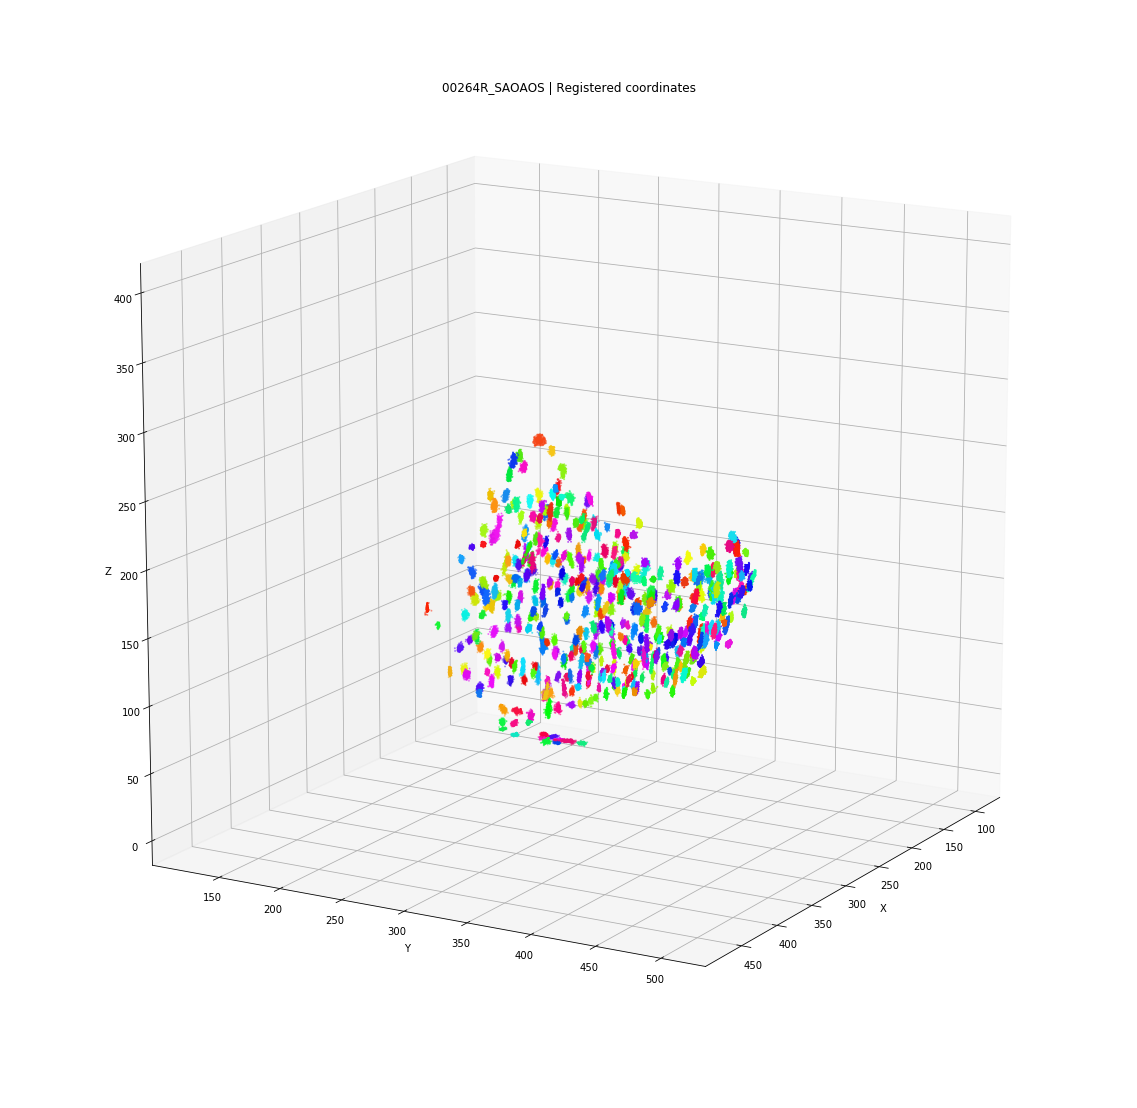
Rigid Vs Non-rigid registration
Only affine
Affine + CPD
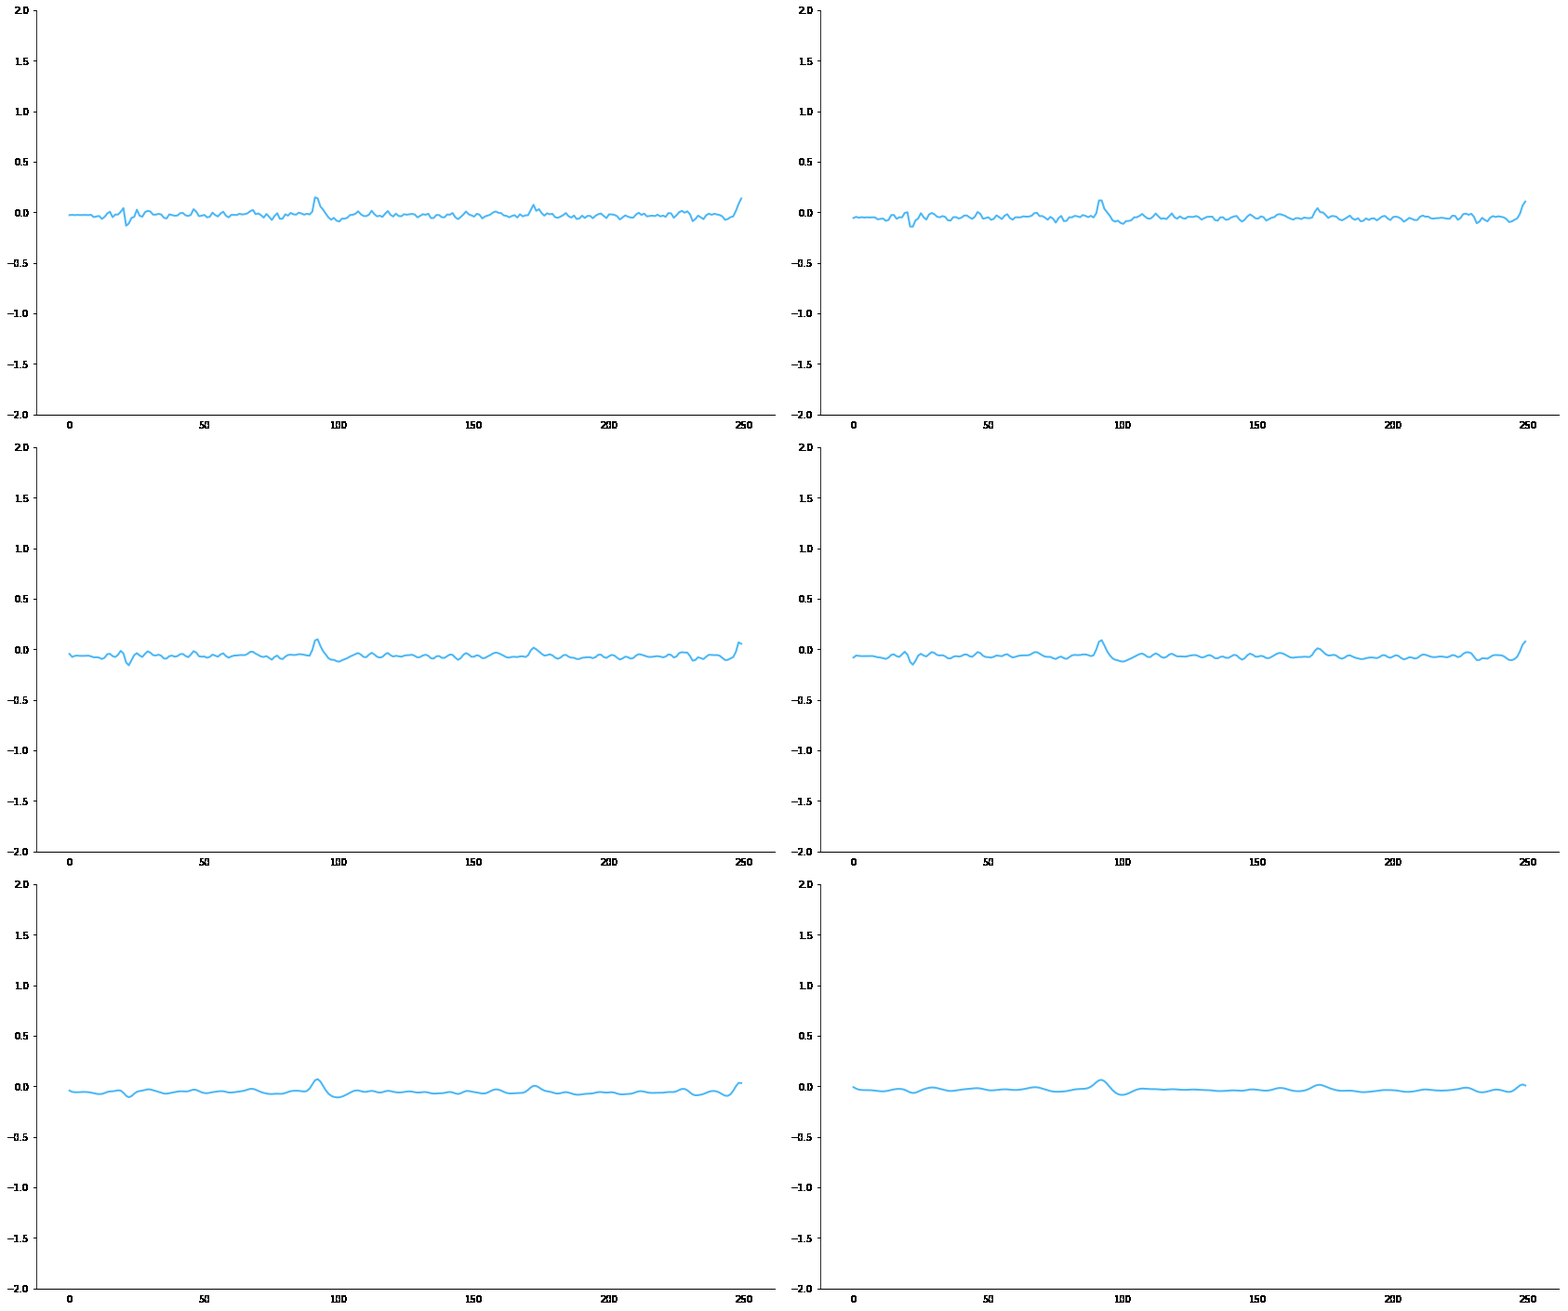
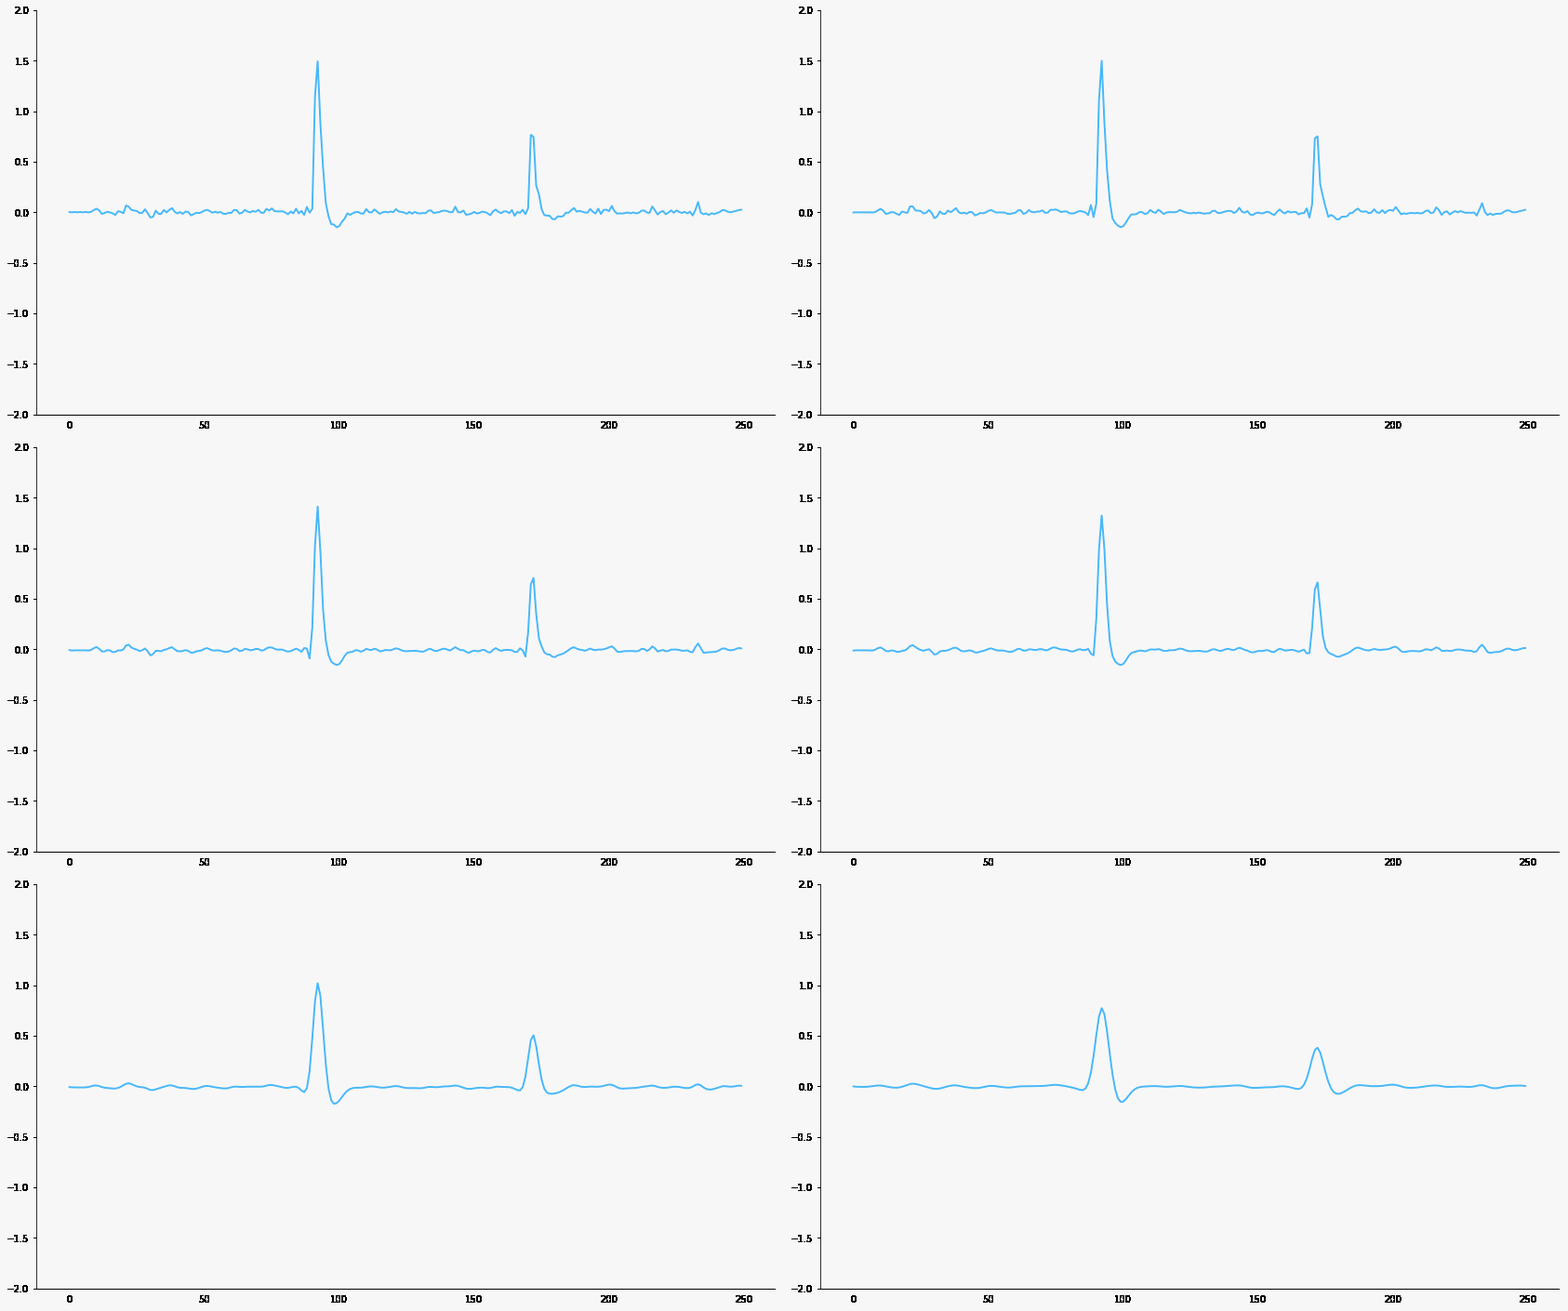
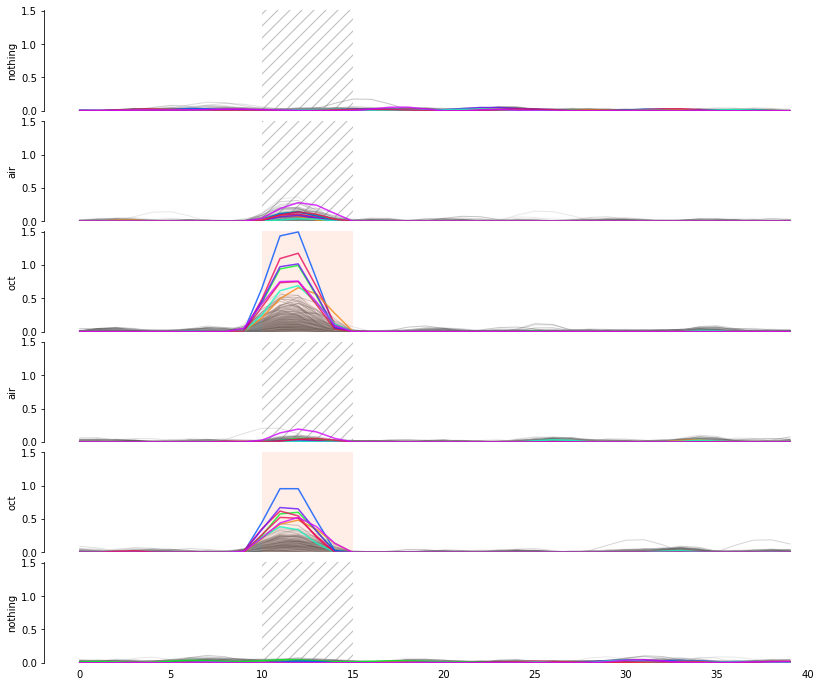
Signal filtering
Responsive neuron
Baseline neuron
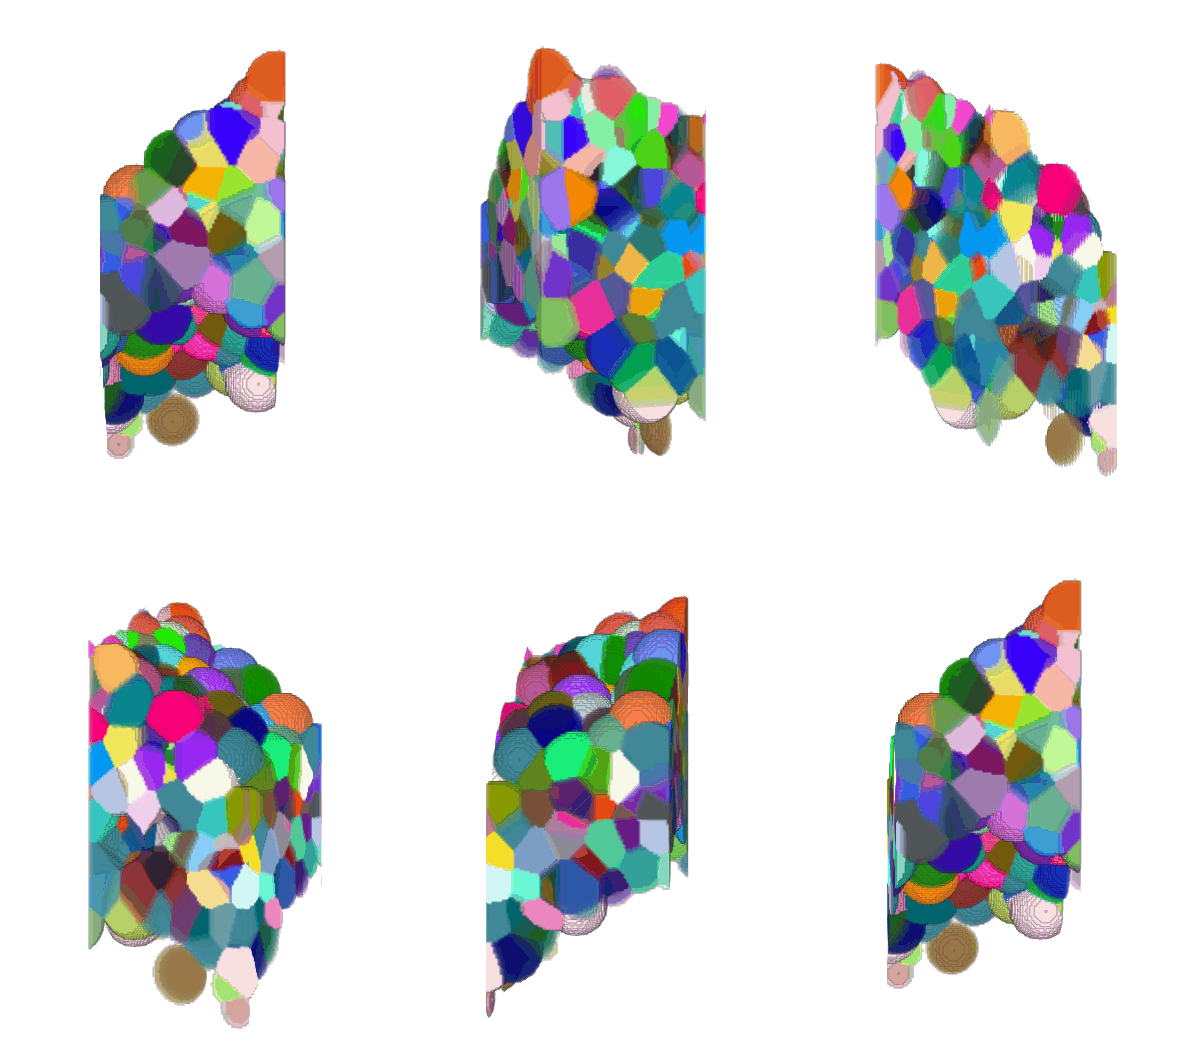
3D + Time
Center crop


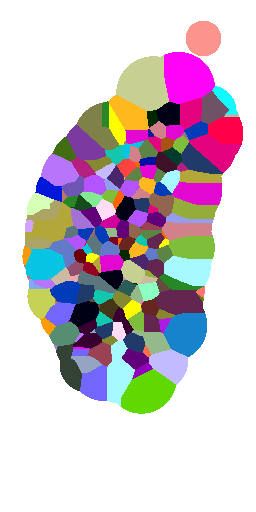


Voronoi maximum size
(relative to nuclei diameter)
x1
x2
x5
x10
no limit
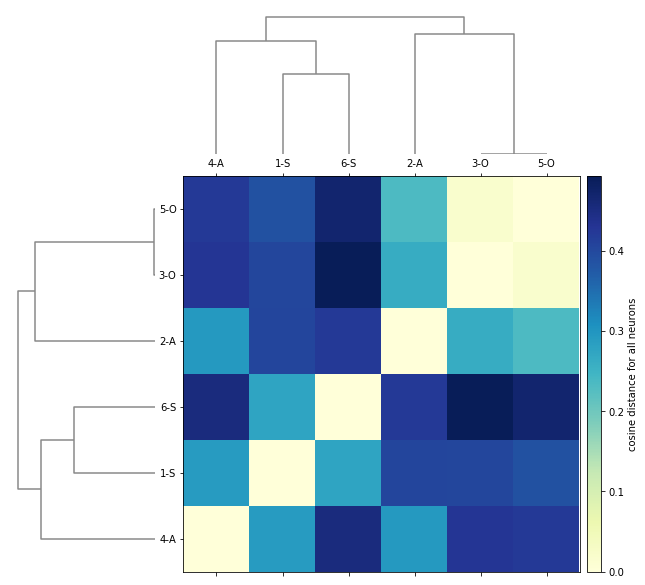
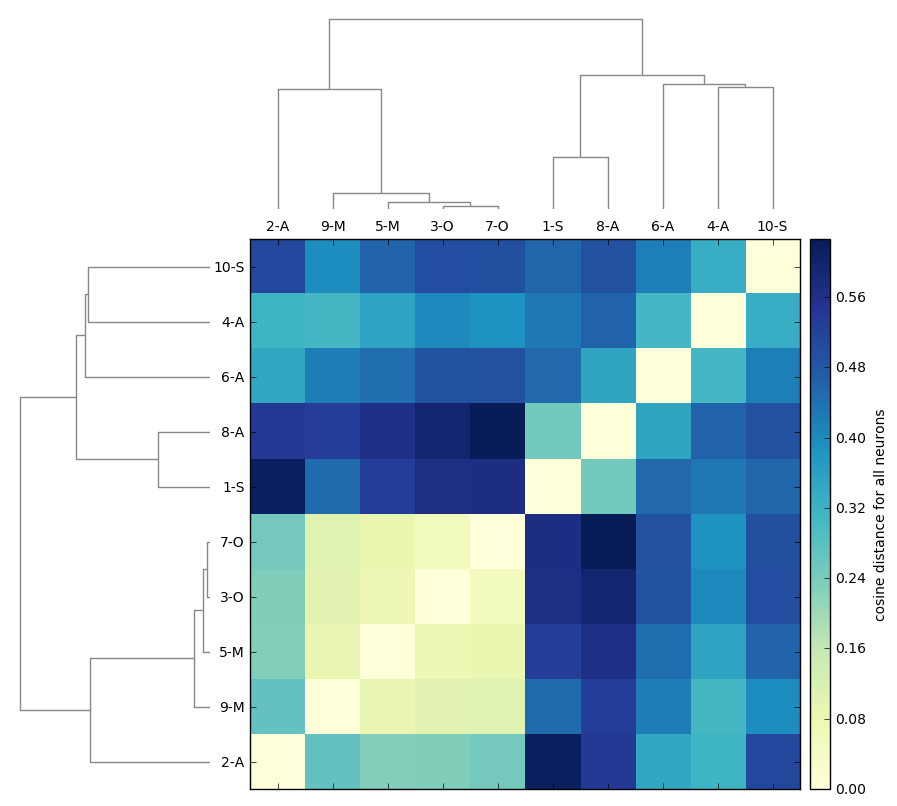
Similarity matrix
Similarity matrix
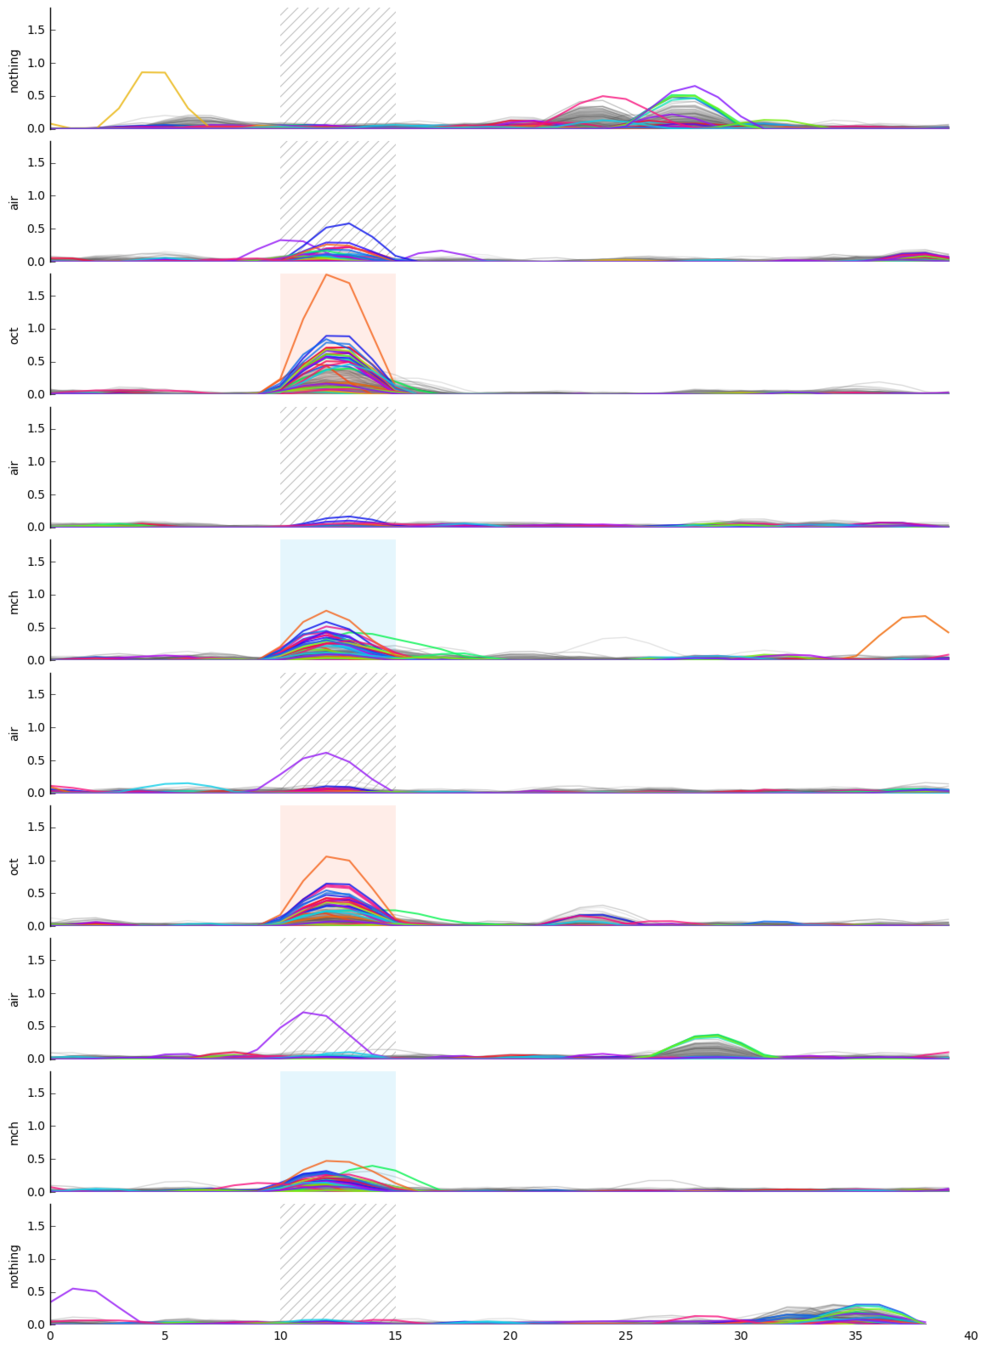
Axial precision & Interpolation
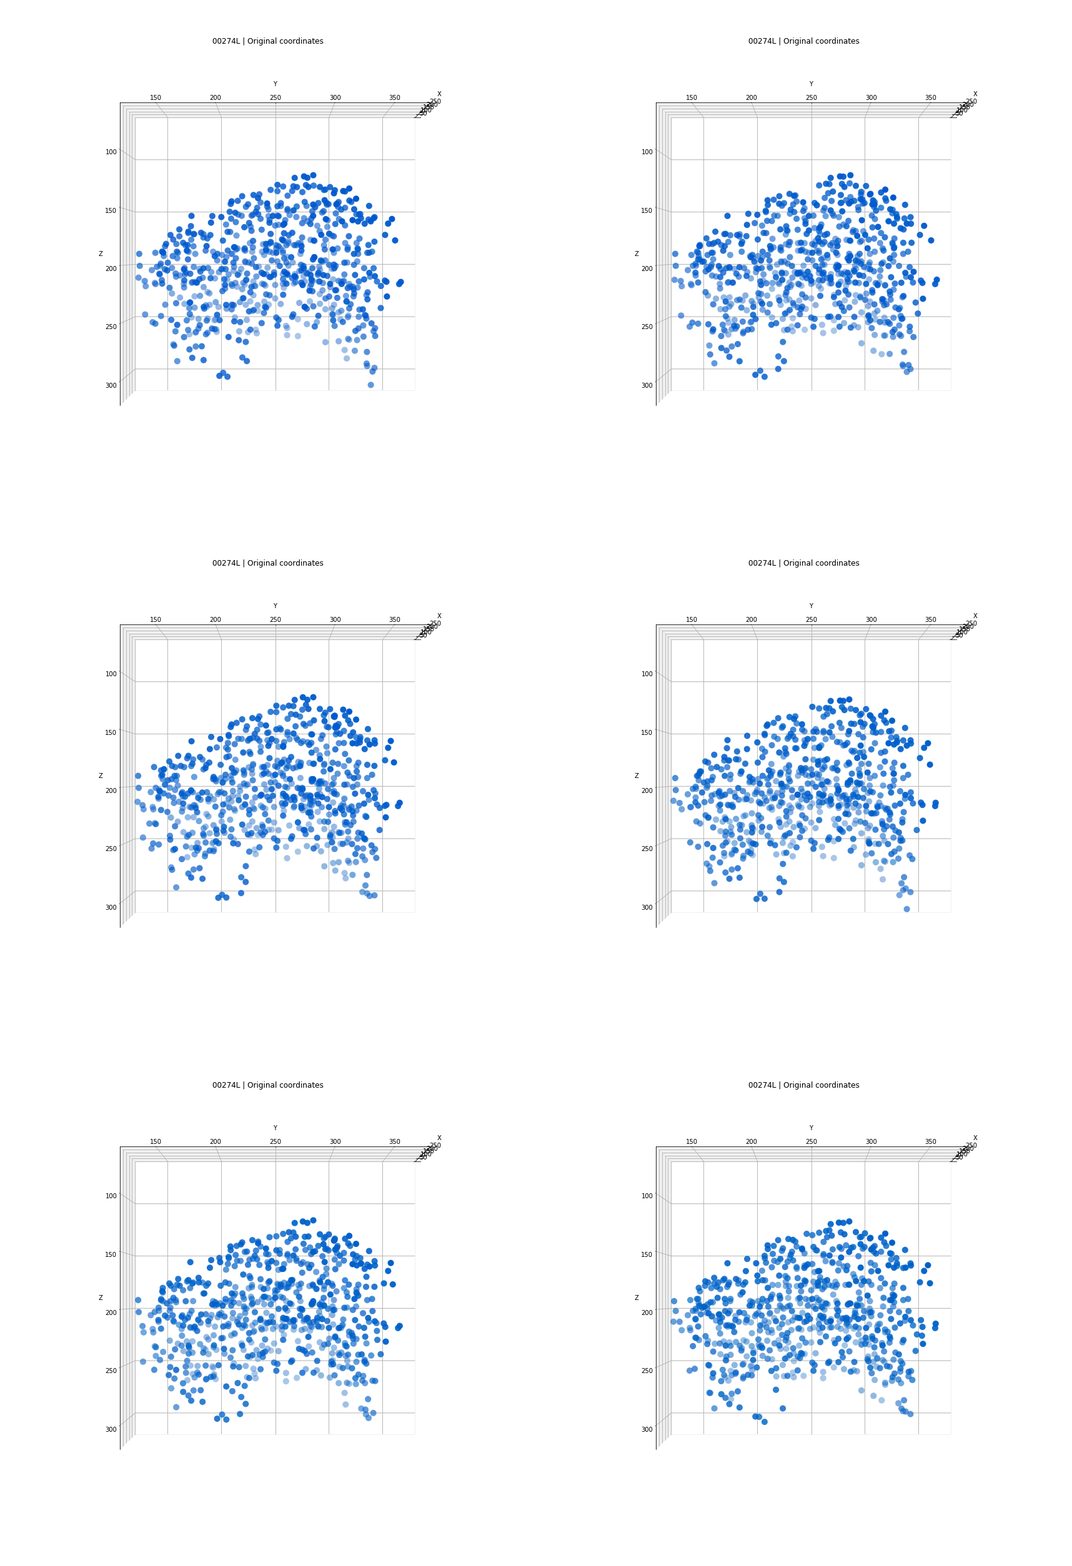
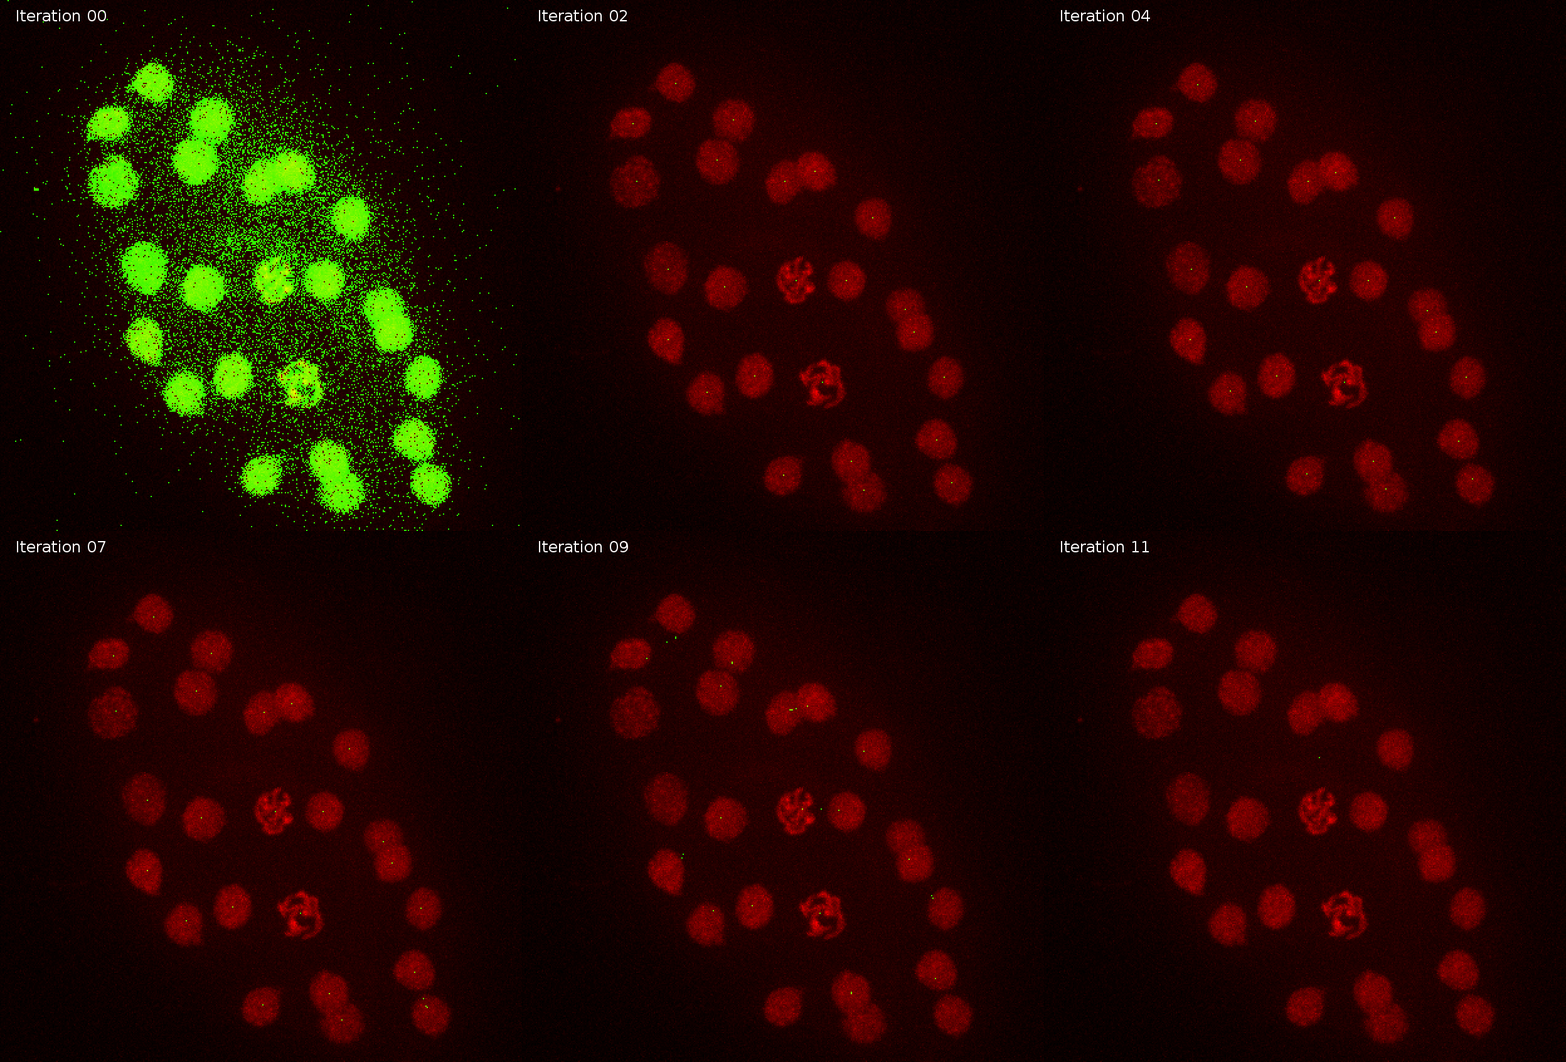
        sigma  detections
0    0.000000       61006
1    7.507692          25
2   12.061538          24
3   14.400000          24
4   15.261538          24
5   15.384615          24
6   15.507692          24
7   16.369231          26
8   18.707692          23
9   23.261538          28
10  30.769231          11
11  41.969231           1
Sigma and object size


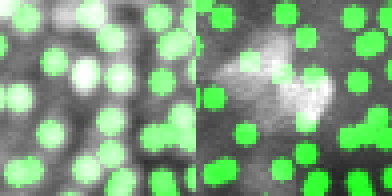
nuclei
signal
detection


z
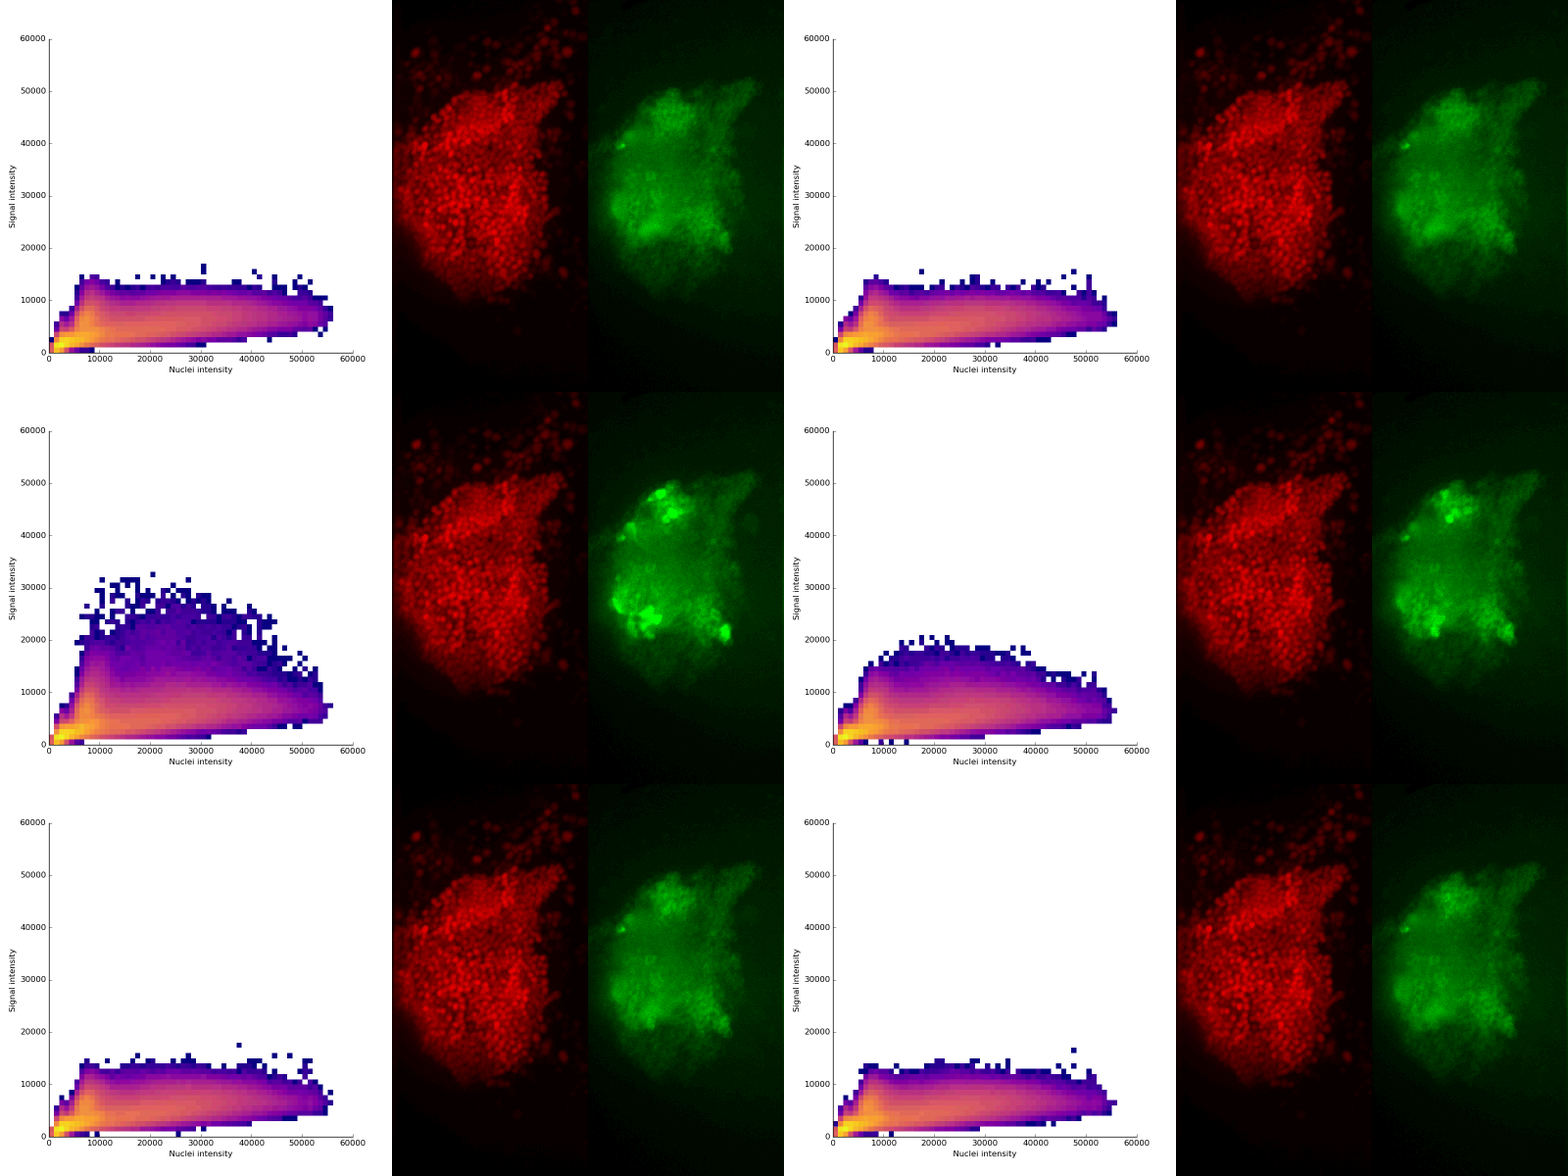
intensity 2d histogram
nuclei
signal
Signal colocalization
Signal quality
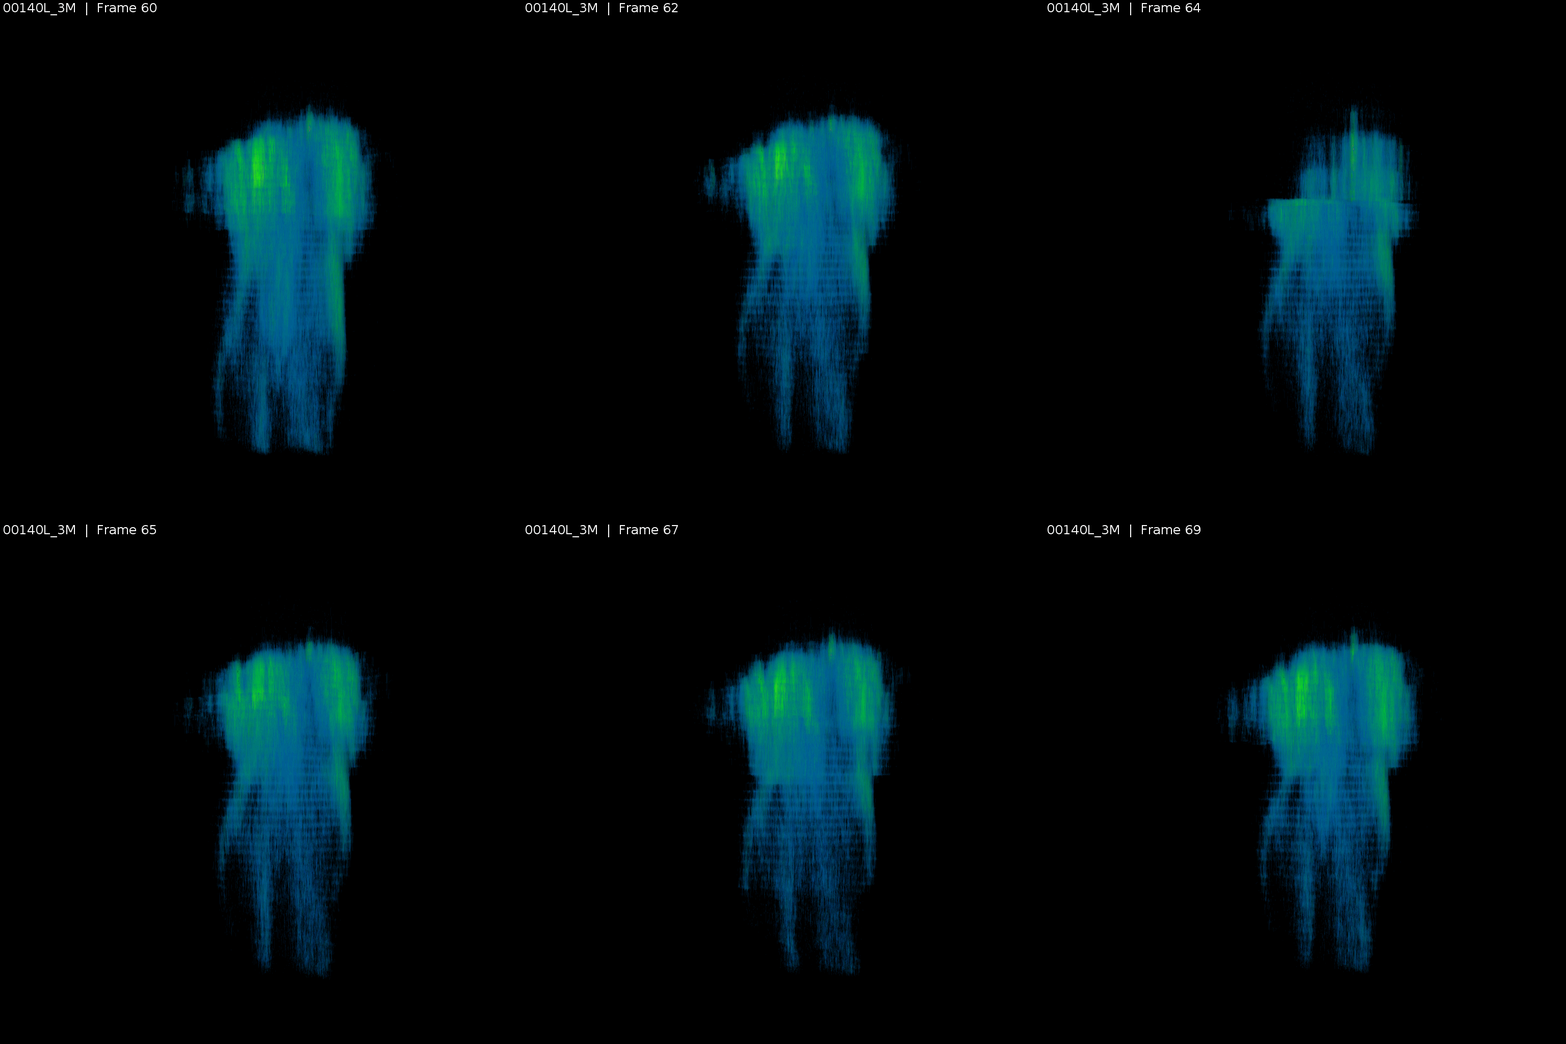
Signal (GCaMP)
Signal quality
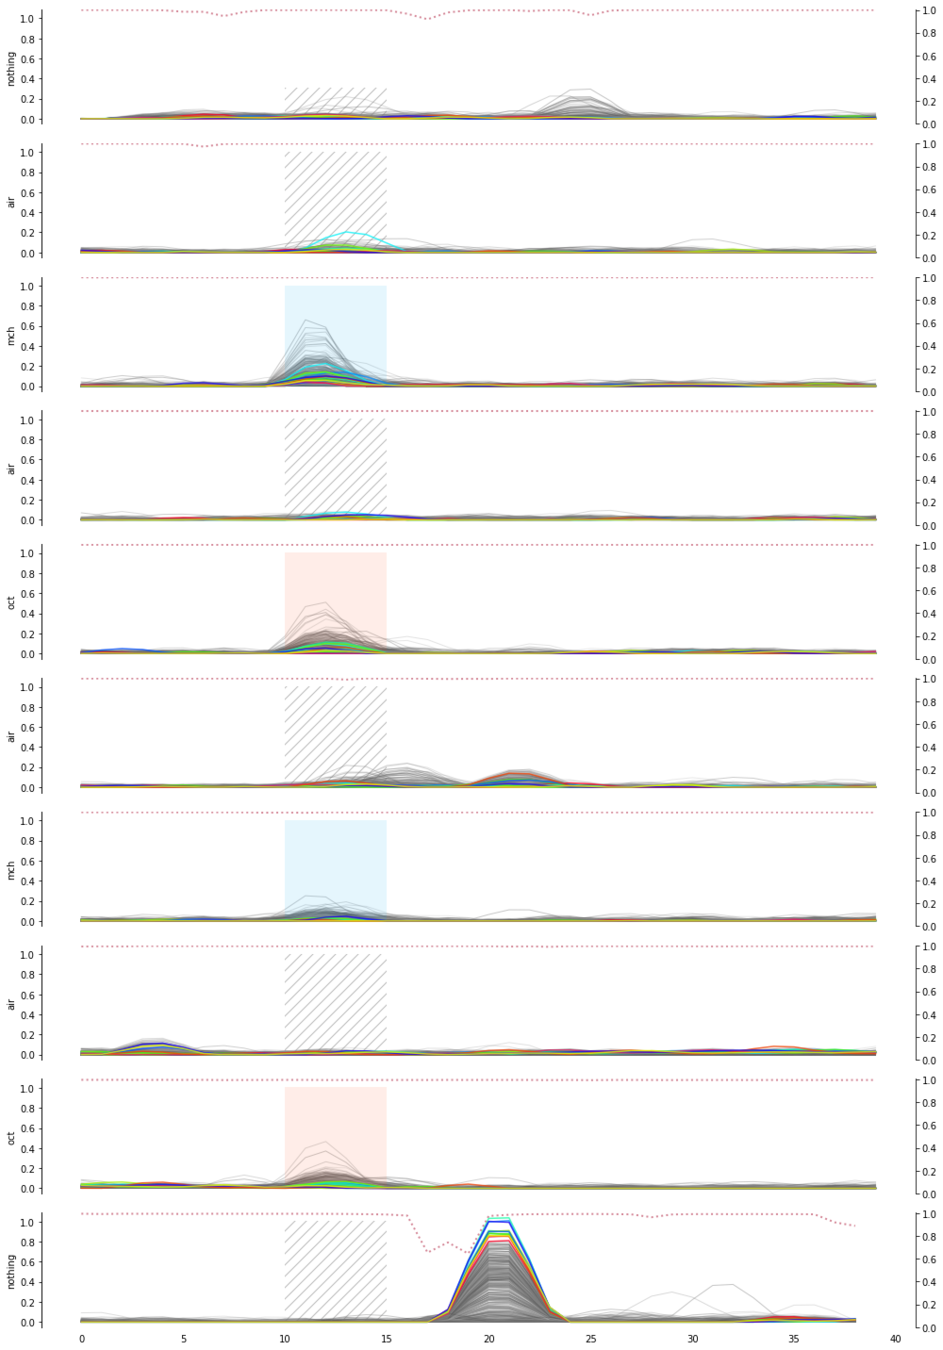
Signal quality
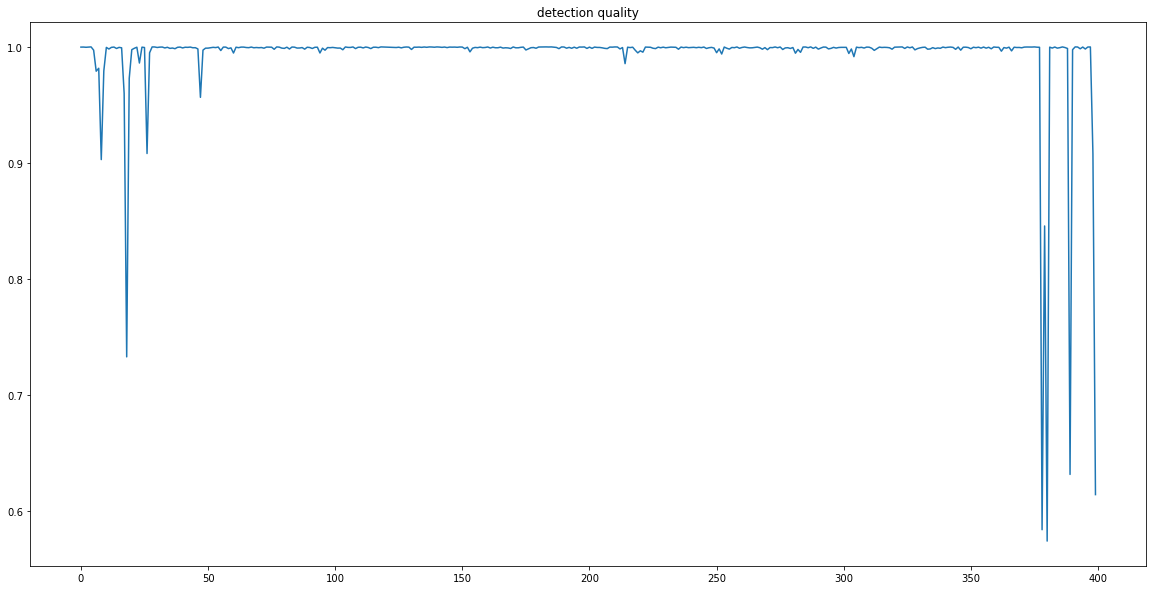
Signal quality
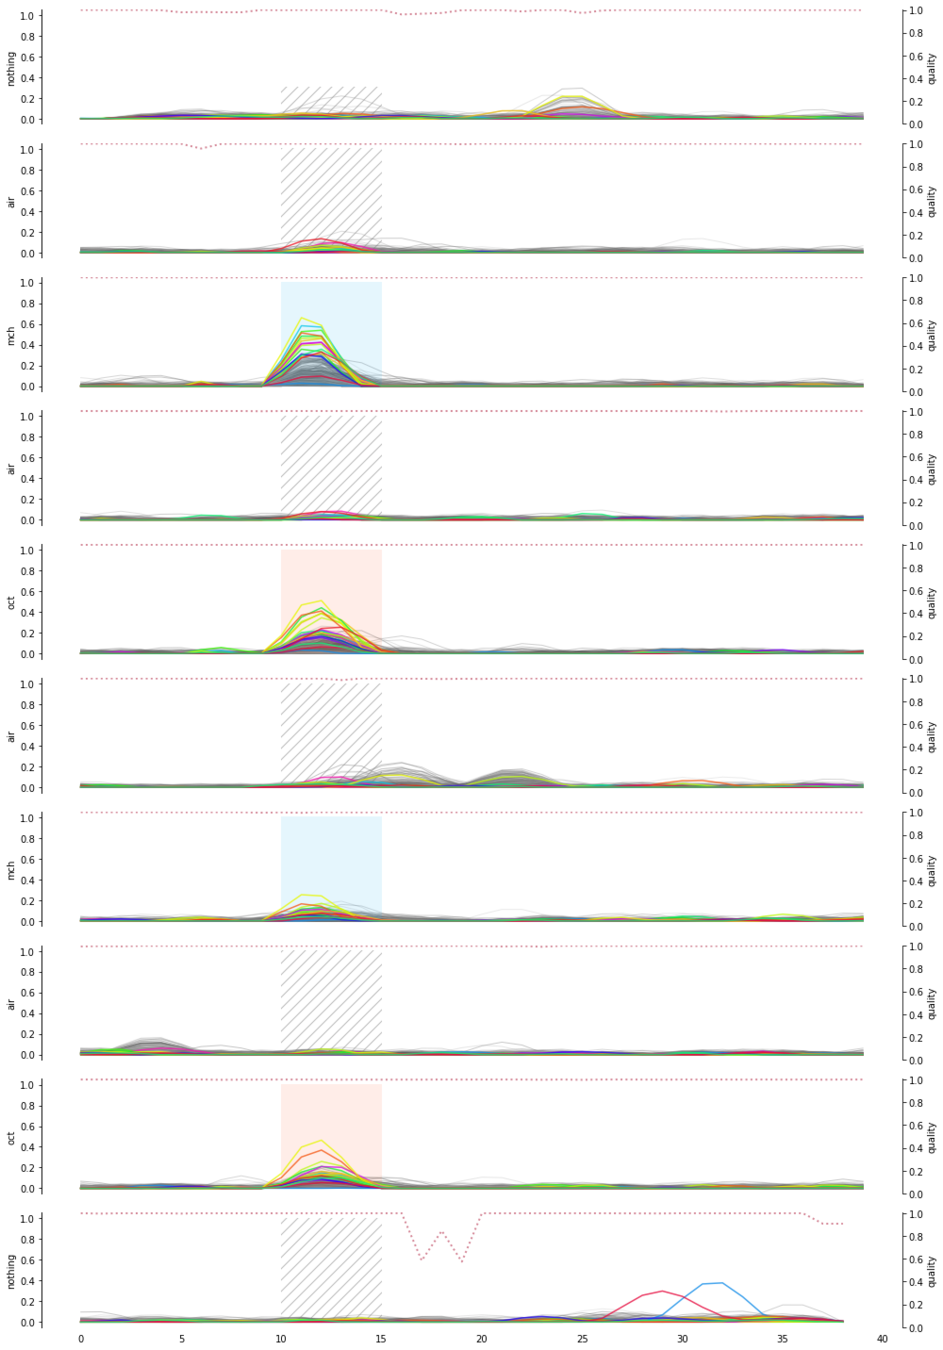
Signal quality
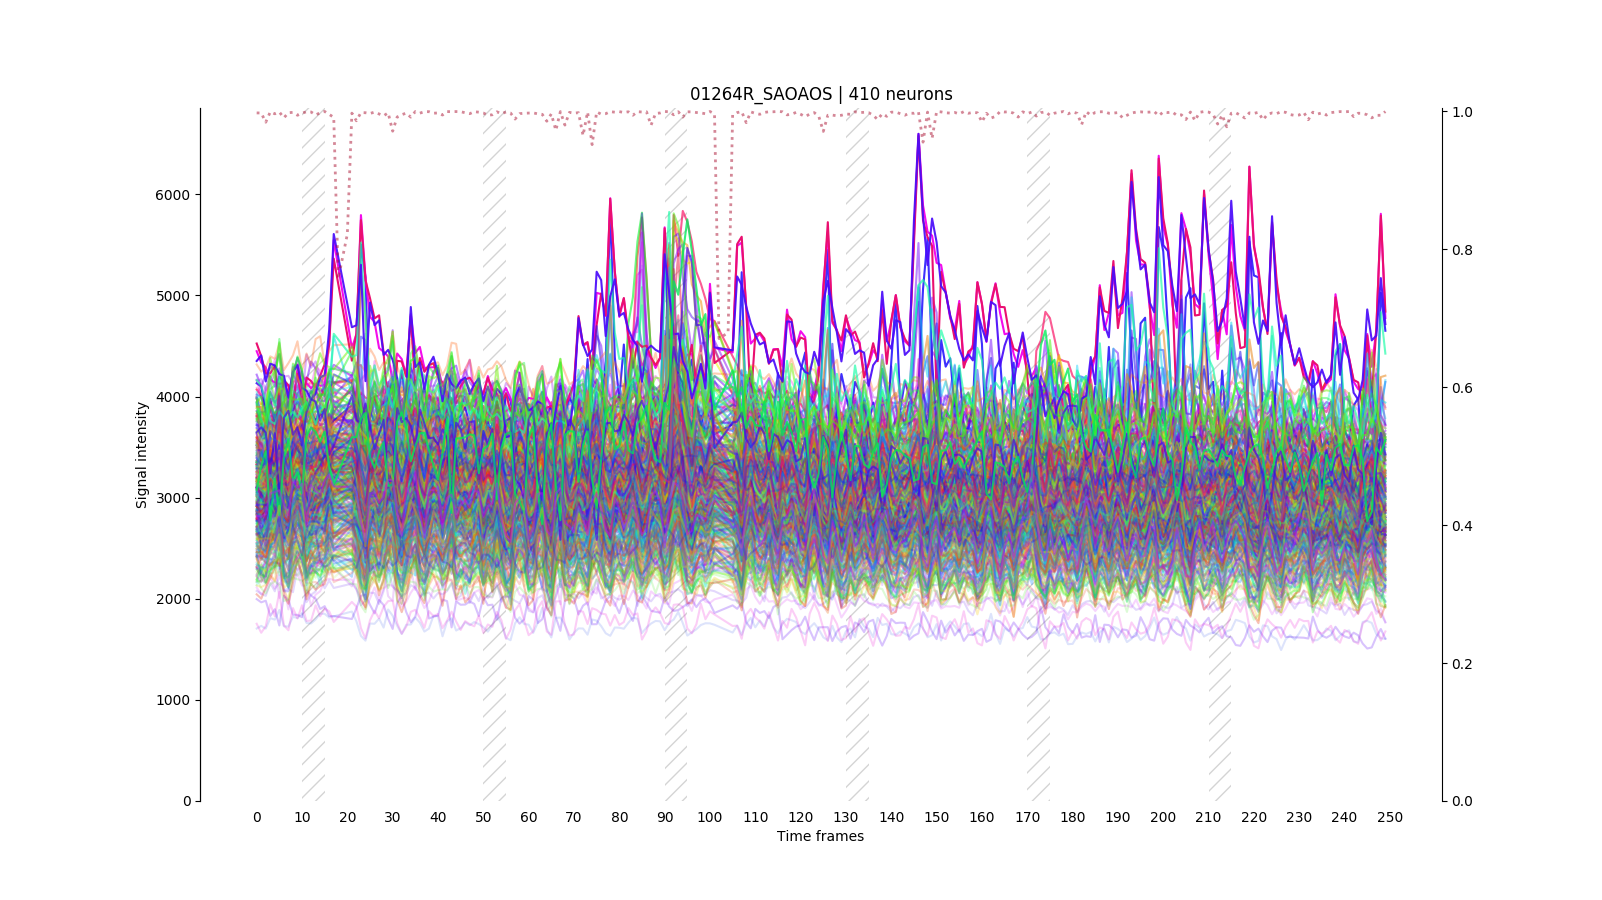
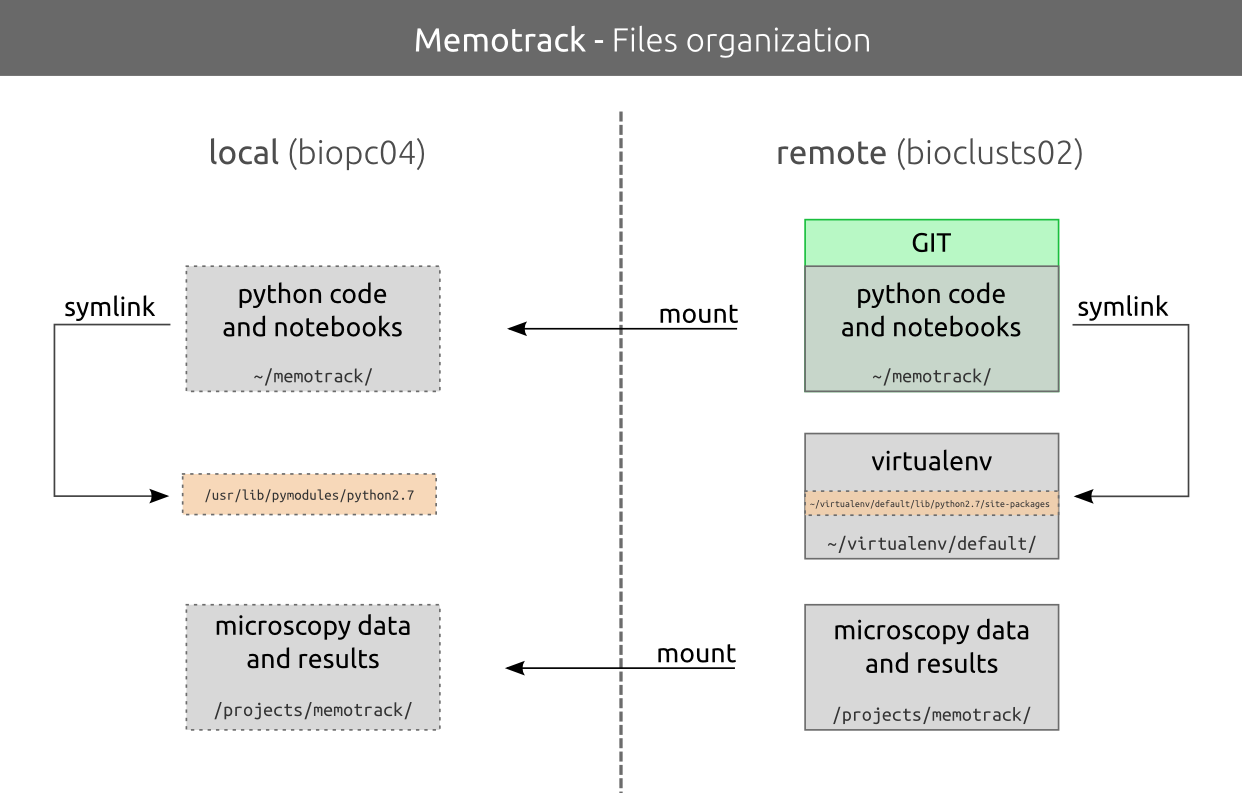
Data managment
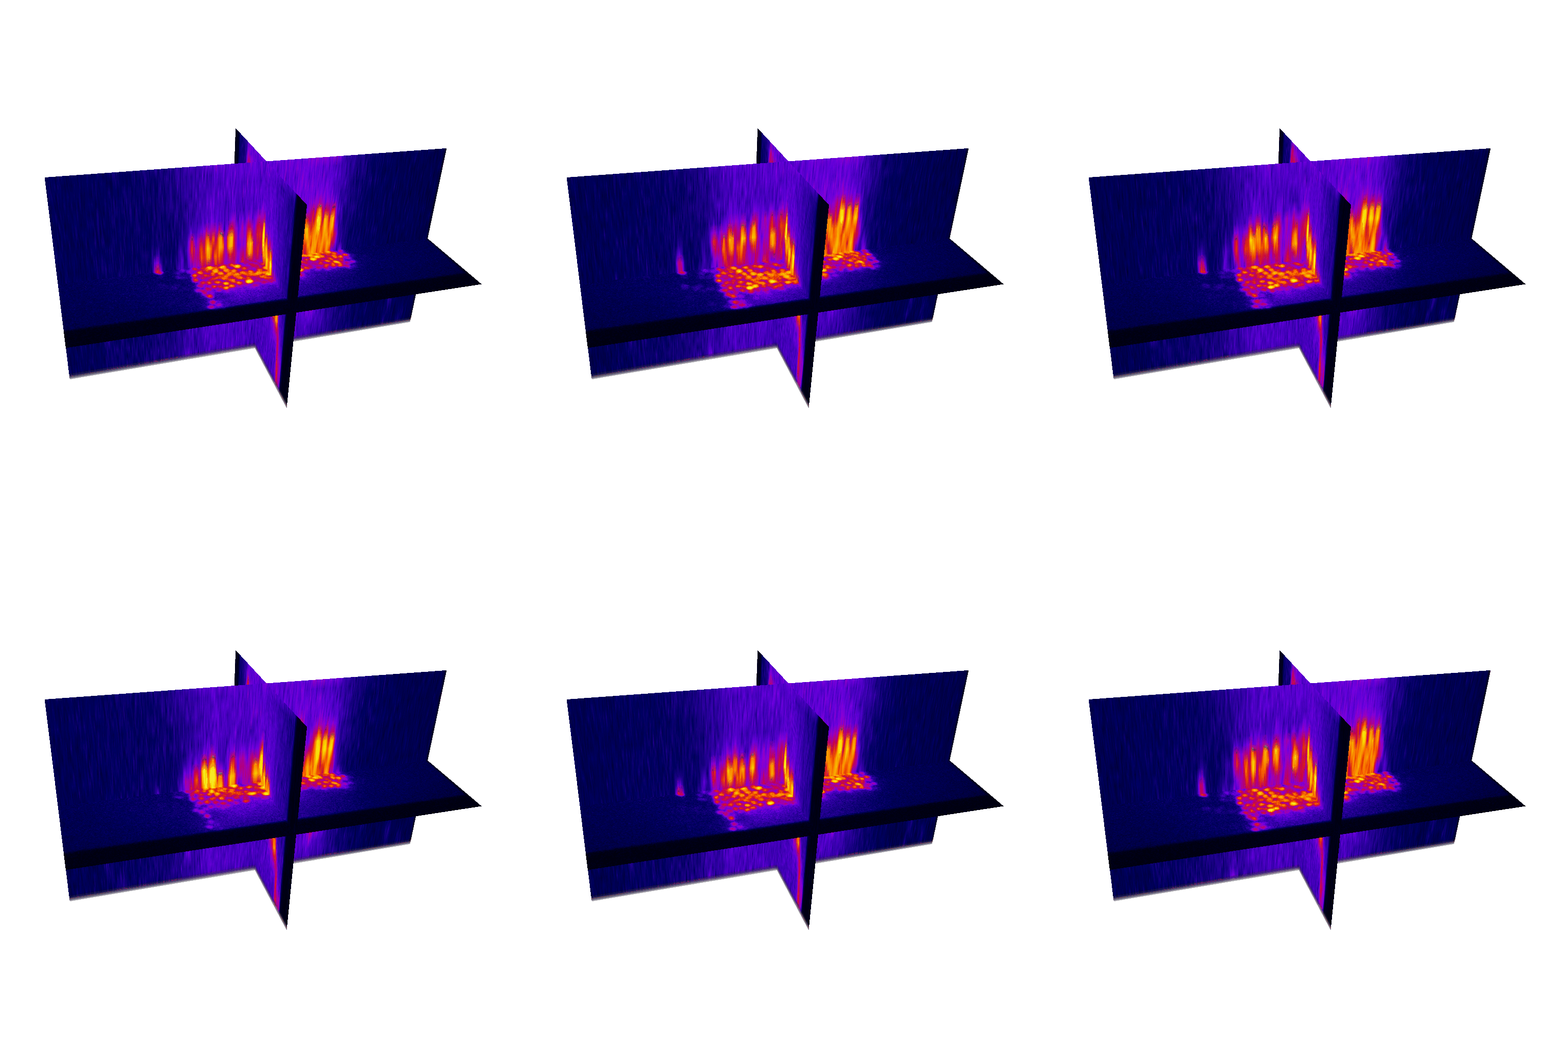
Raster image registration
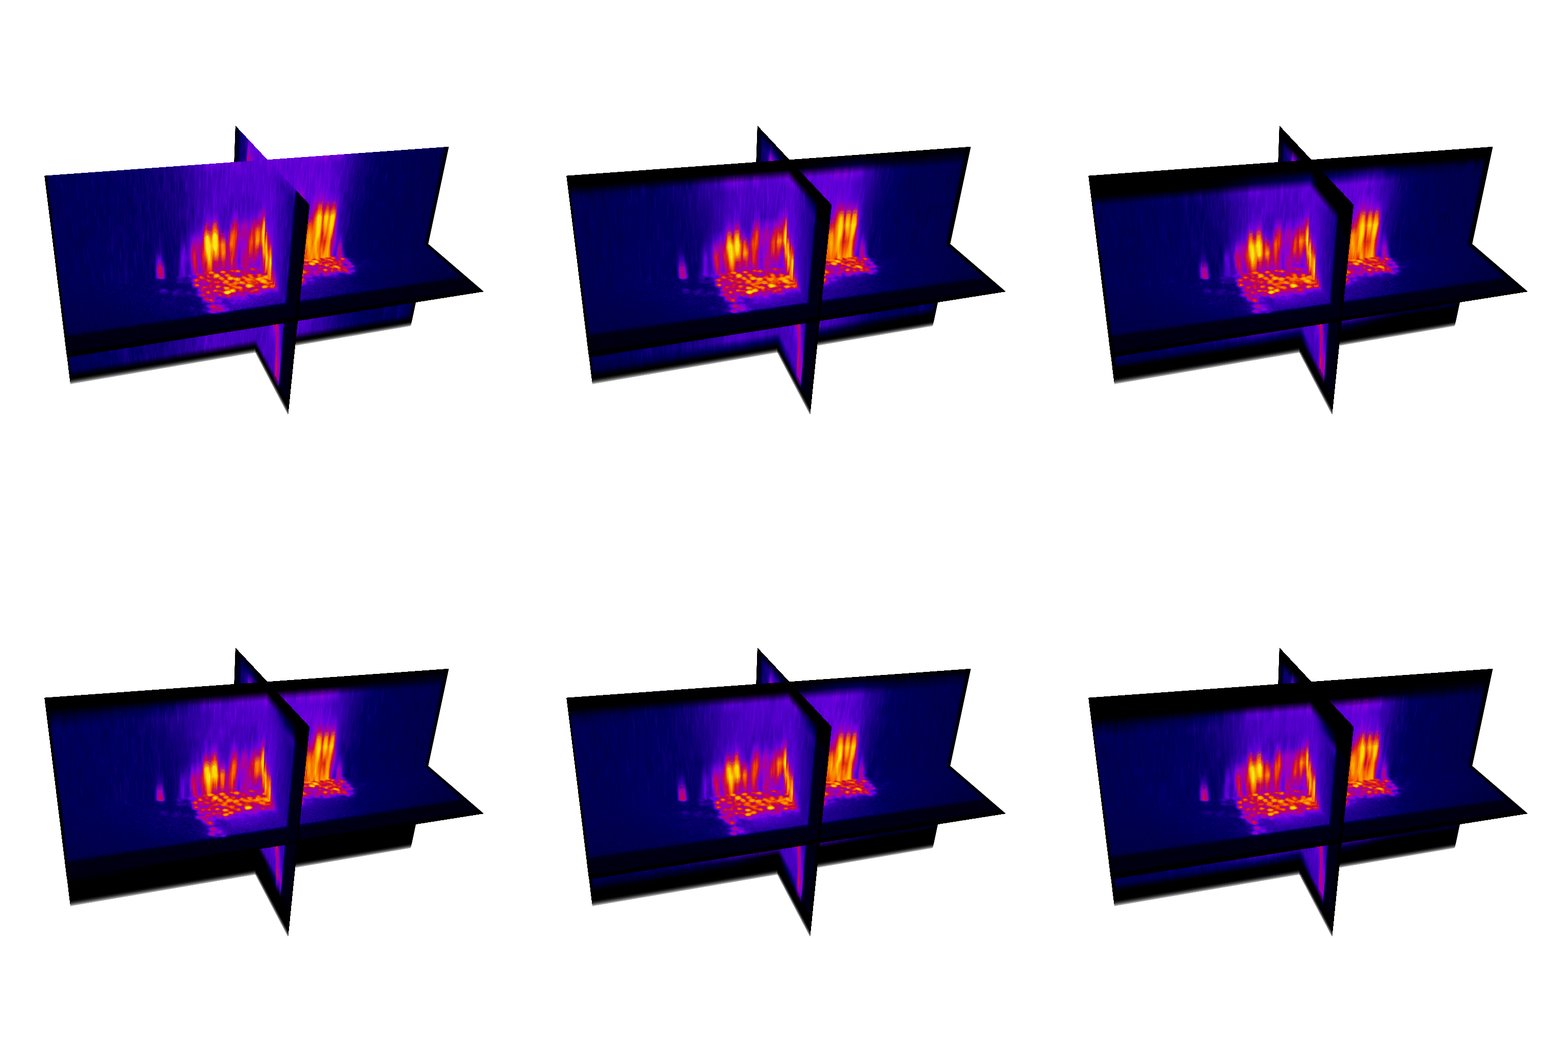
Raster image registration
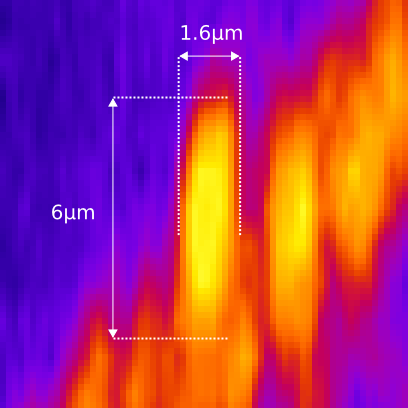
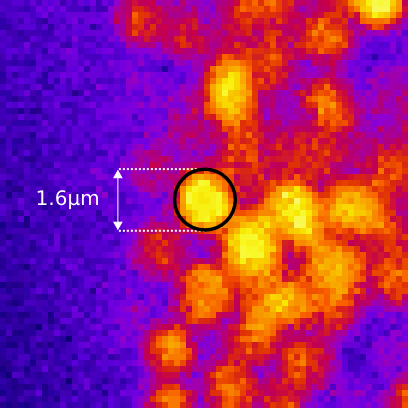
PSF distortion
Synthetic images
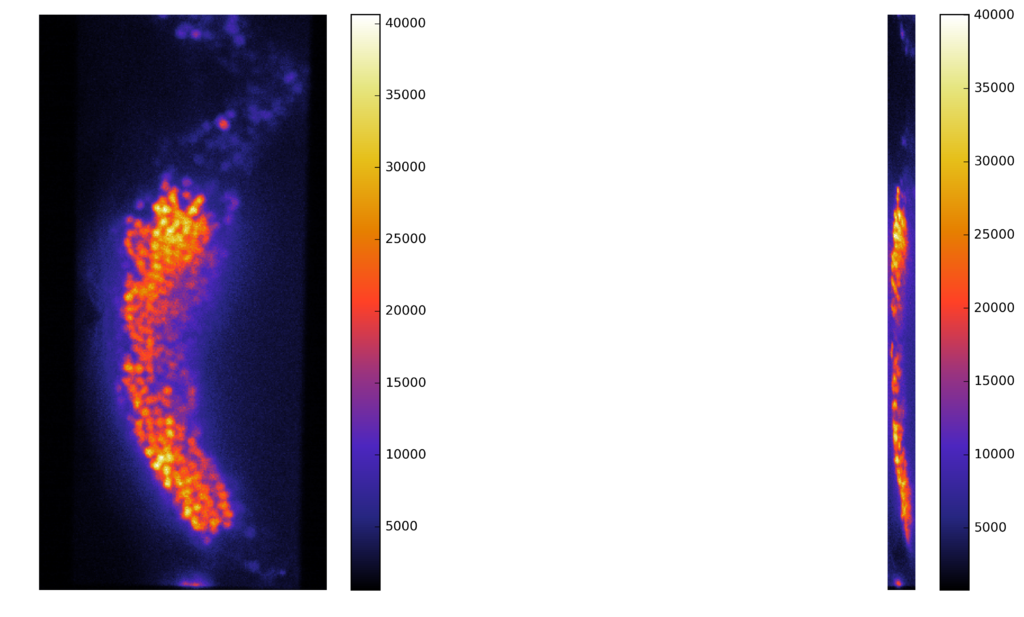
Synthetic images
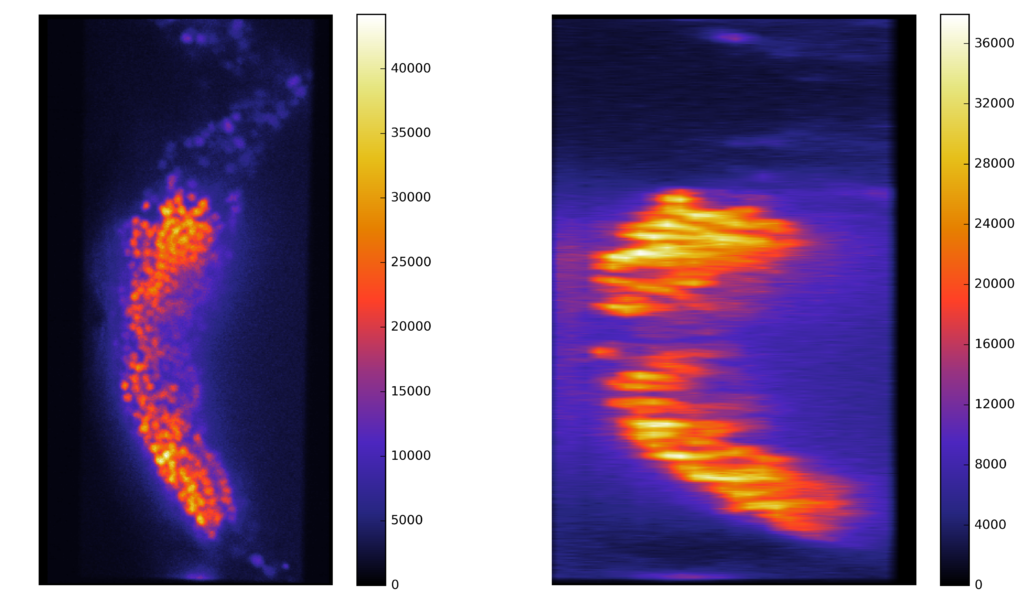
Synthetic images
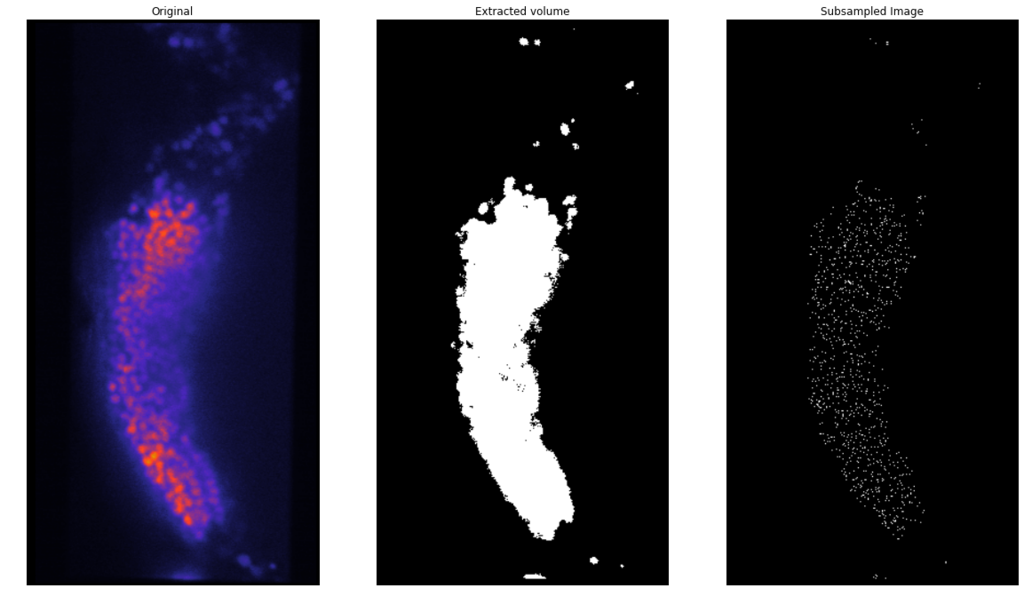
Synthetic images
Synthetic images
Synthetic images
Synthetic images
Synthetic images
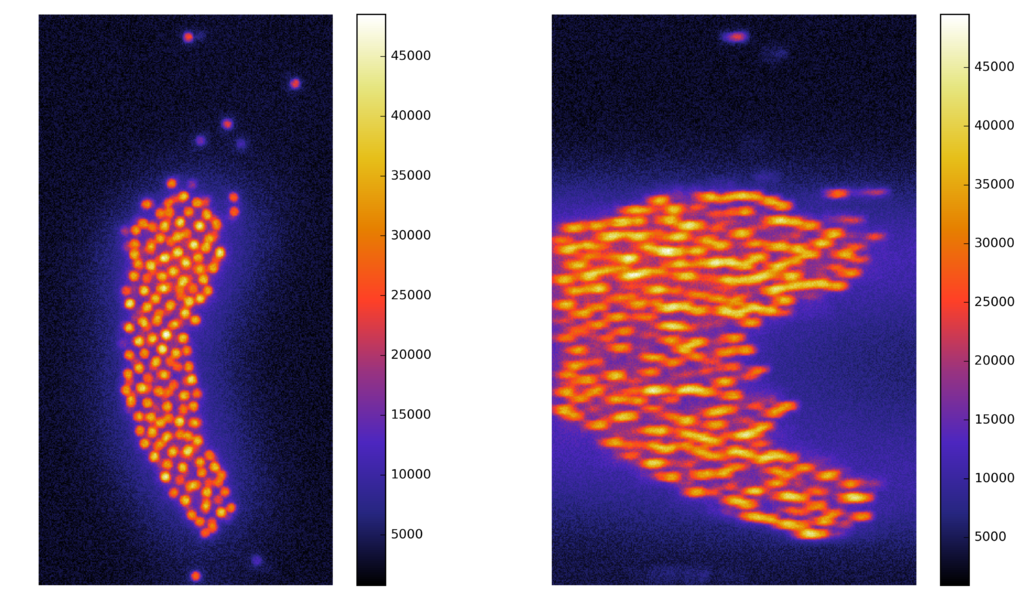
Synthetic images
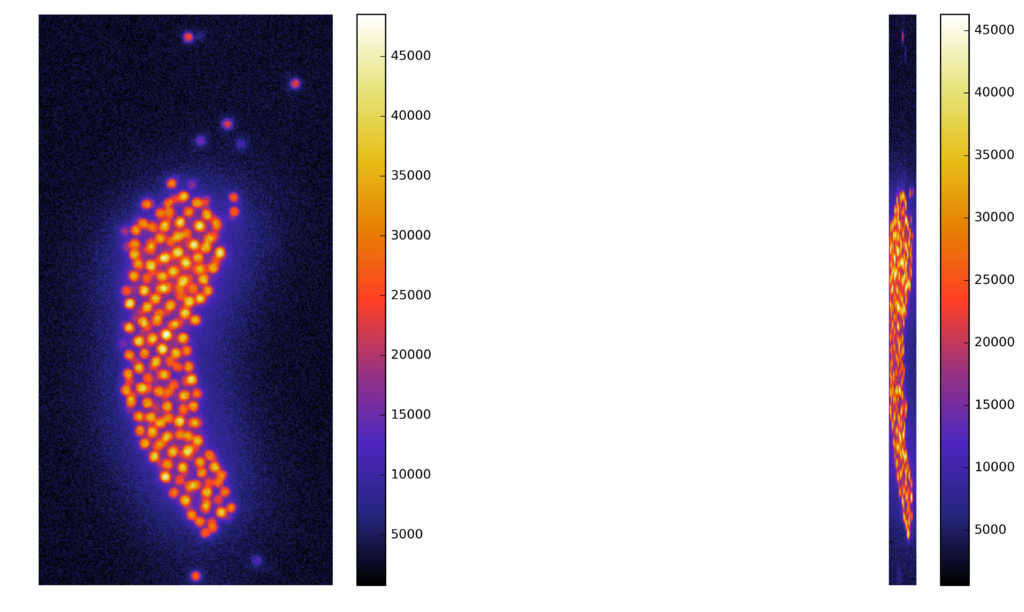

Voxel dimensions
Copy of PhD defense
By Felipe Delestro
Copy of PhD defense
- 797


