WIFI ACCESS

guest01 / im@agine01


FOLLOW THE SLIDES DURING THE PRESENTATION

https://slides.com/delestro/yrls2019/live


DOWNLOAD THE NECESSARY RESOURCES

https://bit.ly/2MrL9jn


Graphic design & Science

design tips for your scientific illustrations

FELIPE DELESTRO

contact@delestro.com

W  O  R  K  S  H  O  P

illustrations

A service proposed by the Bioinformatics platform of IBENS

Scientific

Thion, M. S., & Garel, S. (2017).
On place and time: microglia in embryonic and perinatal brain development.

Current opinion in neurobiology, 47, 121-130.

INTRODUCTION

PRACTICAL WORK

&

01

02

Before anything else,

we need to know how
images are displayed

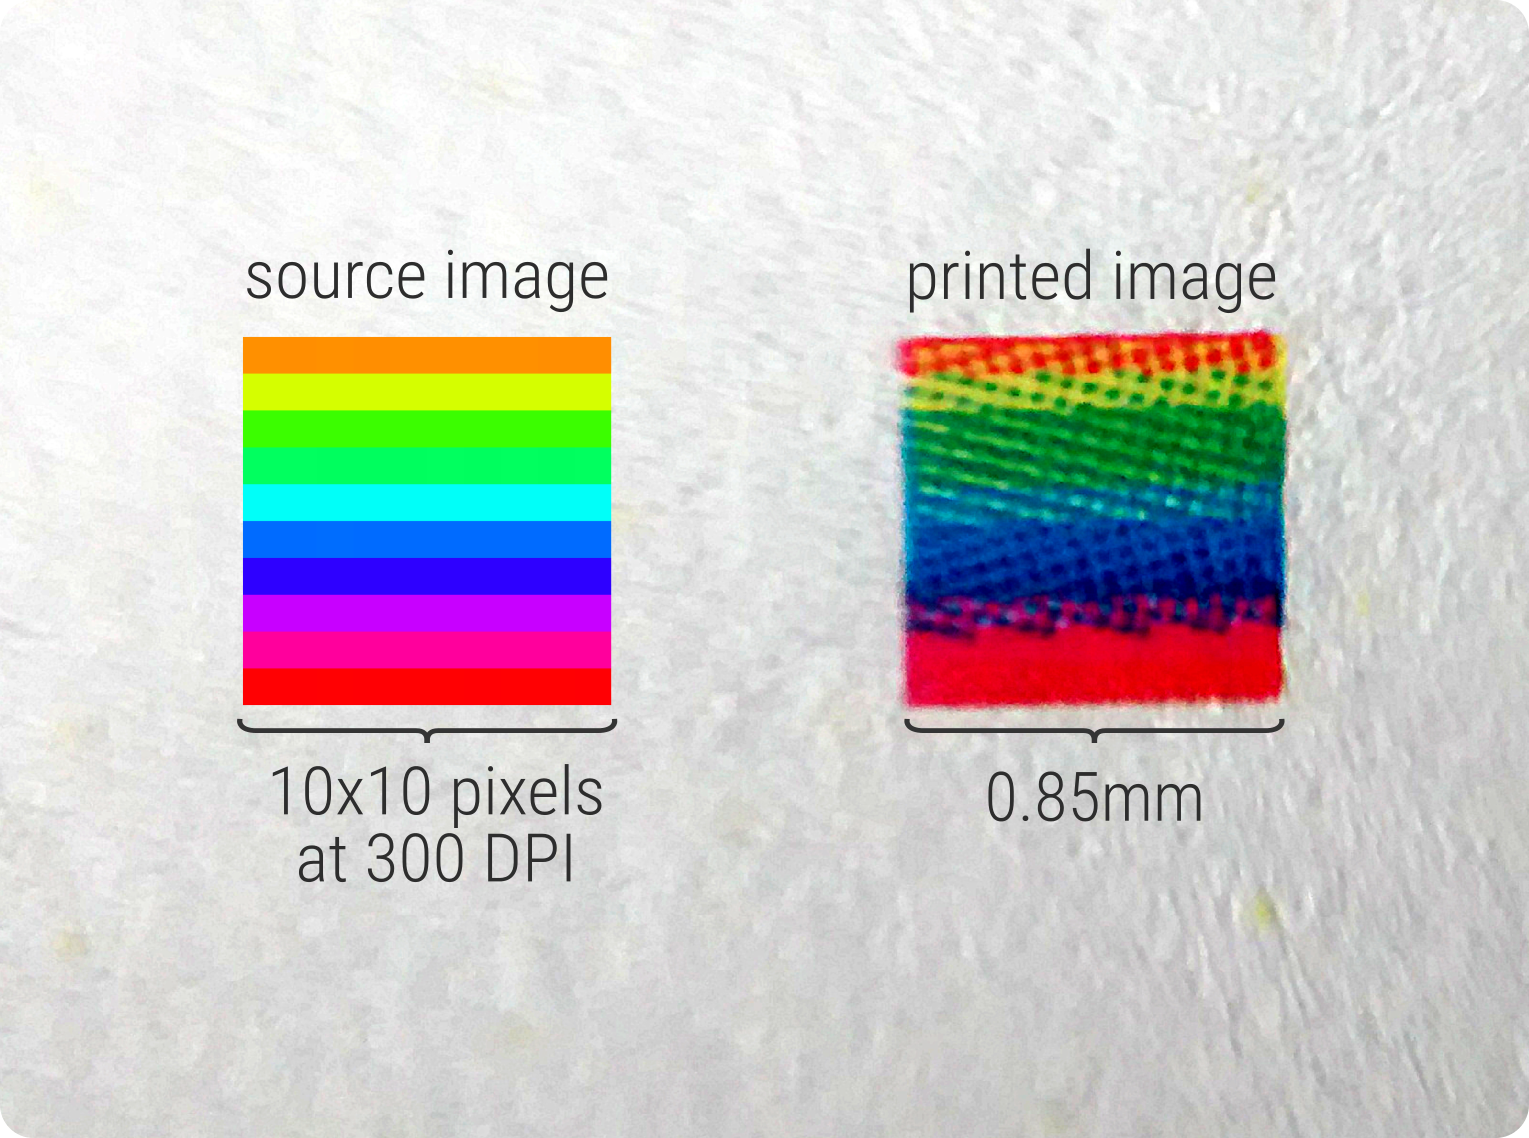
DIGITAL SCREENS

additive color model

PRINTED PAPER

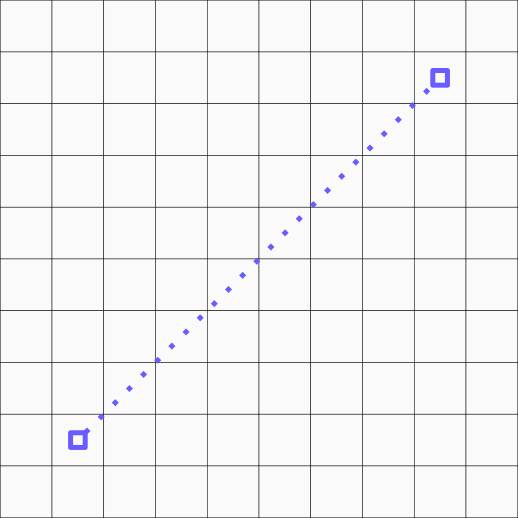
To better understand the relationship of size between pixels on screen and on printed paper, follow this tutorial

subtractive color model

RASTER

VECTOR

&

raster

raster

raster

vector

raster

vector

raster

vector

raster

vector

raster

vector

raster

vector

raster

vector

Use the right software for the right task !

RASTER

Photoshop or GIMP

JPG, PNG, BMP, TIFF

VECTOR

Illustrator or Inskcape

AI, EPS, SVG, PDF

PRACTICAL
EXERCISE

01

Load a PDF file and extract an image from it. This can be very useful when we need to use figures from other papers !


Suggested paper:
Smooth 2D manifold extraction from 3D image stack | Nature communications
https://www.nature.com/articles/ncomms15554

PRACTICAL
EXERCISE

02

Load a plot made with default settings, and remove all the unnecessary cluttering

PRACTICAL
EXERCISE

03

It's time to drawn ! 

Let's see how it is possible to make
a clear schematic for your paper
or presentation.


Suggested image:
Zebrafish embryo

http://zebrafishlab.be/media-gallery/detail/6/10

YRLS2019-Workshop

By Felipe Delestro

YRLS2019-Workshop

Enrich your work: design tips for your scientific illustrations On this workshop you'll learn the basic guidelines on how to use design techniques to better show your scientific results. From making illustrations to improving the clarity of your plots, both theoretical and practical lessons (always using open-source software) will change the way people perceive and understand your work.

  • 624