


Dhrumil Mehta
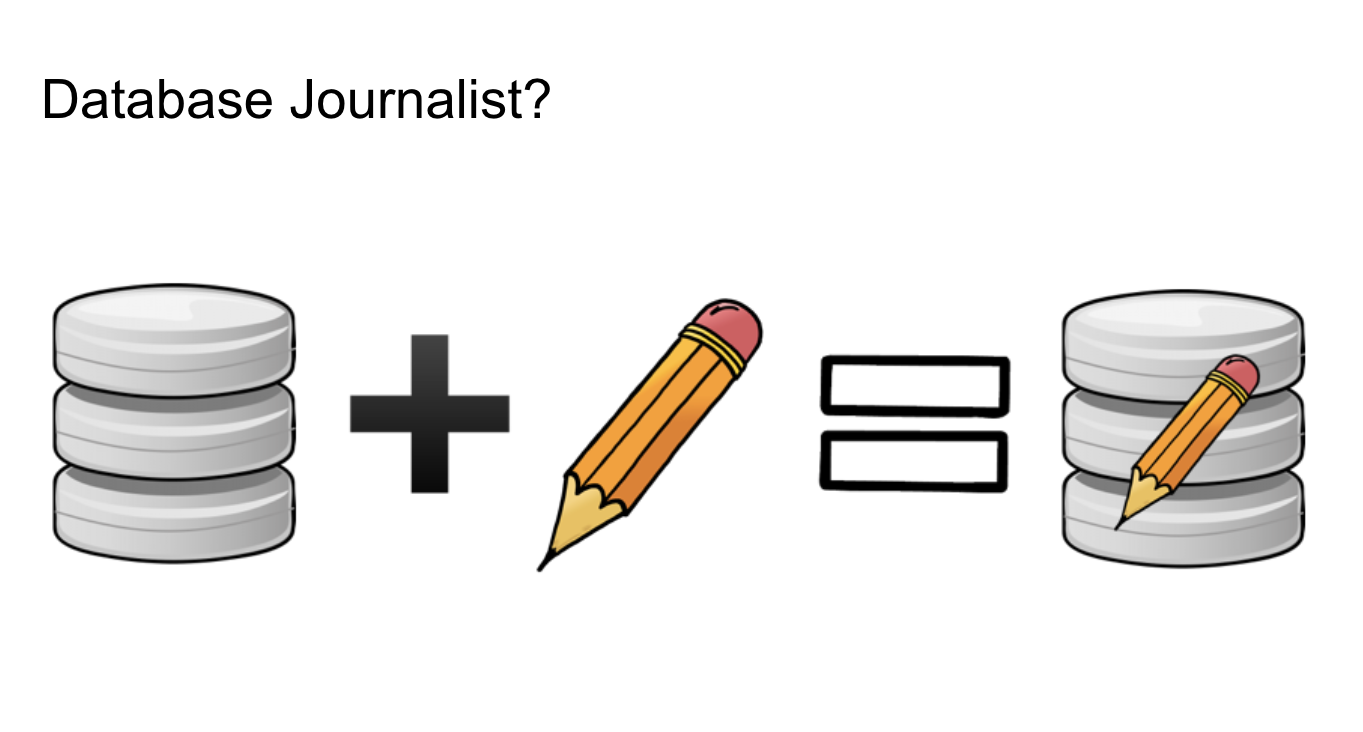
Database Journalist, Politics @ FiveThirtyEight
Numbers to Narrative
Database Journalist, Politics - FiveThirtyEight
Adjunct Lecturer in Public Policy - Harvard Kennedy School
dhrumil.mehta@fivethirtyeight.com
@datadhrumil
@dmil
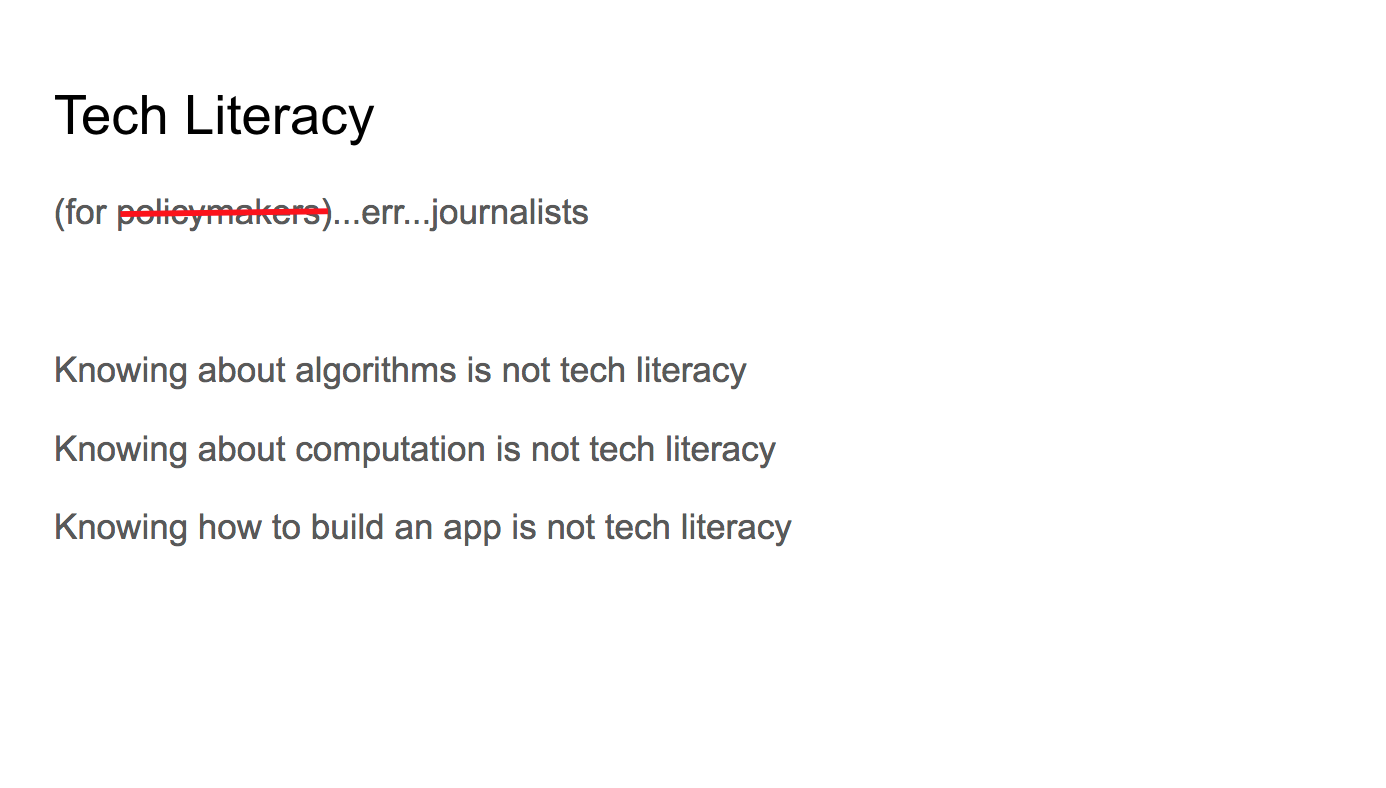
Unlocking Quant Skills
Data in the Classroom
Data in Journalism
Database Journalist, Politics
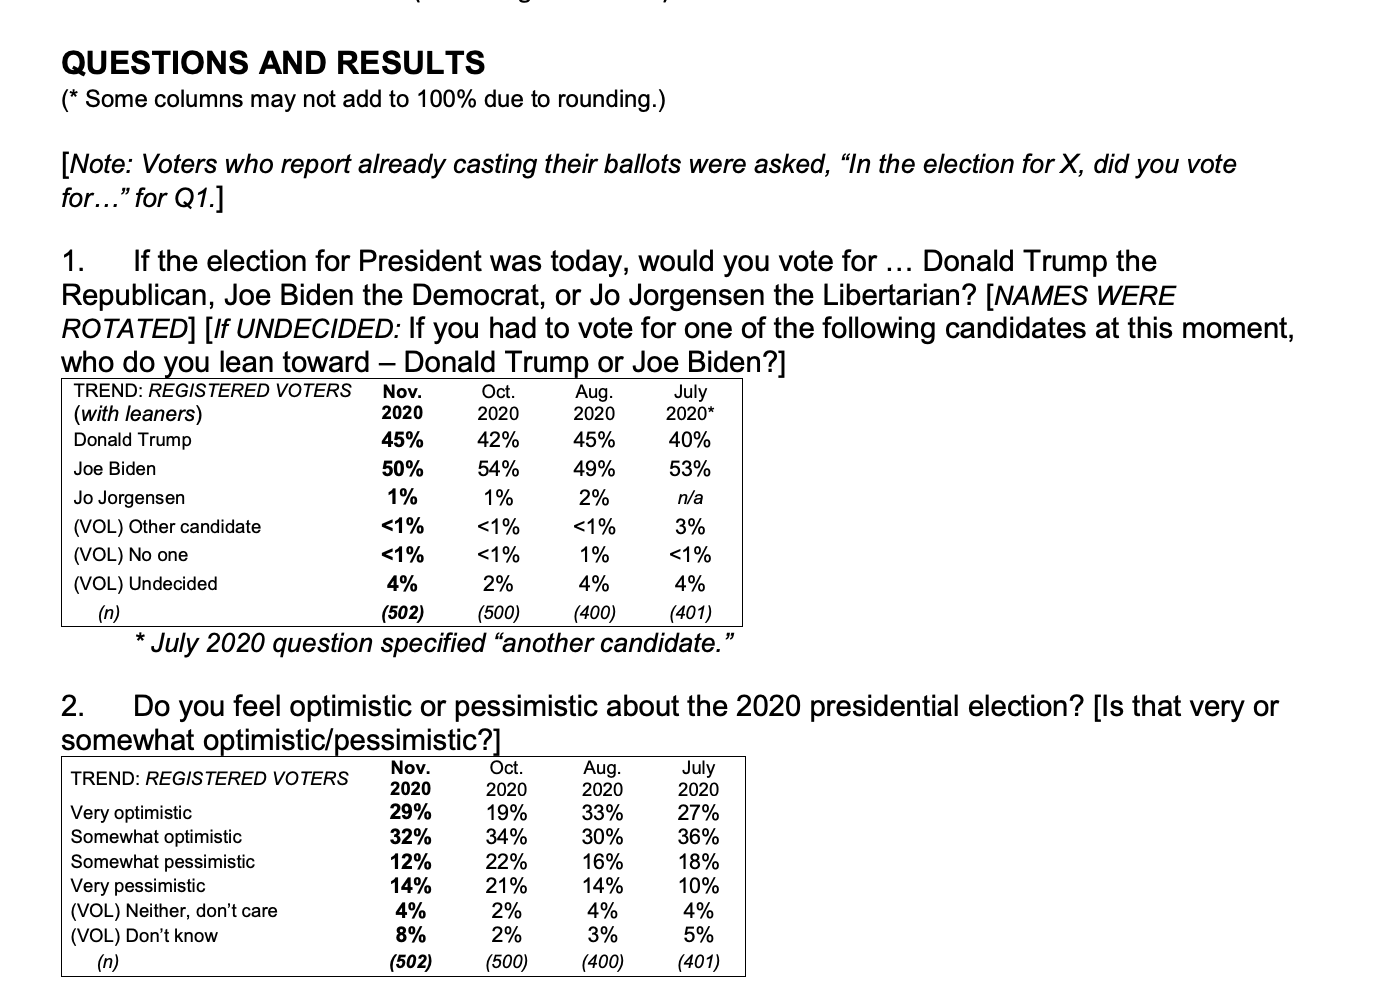
Public Opinion
(and Pollapalooza)
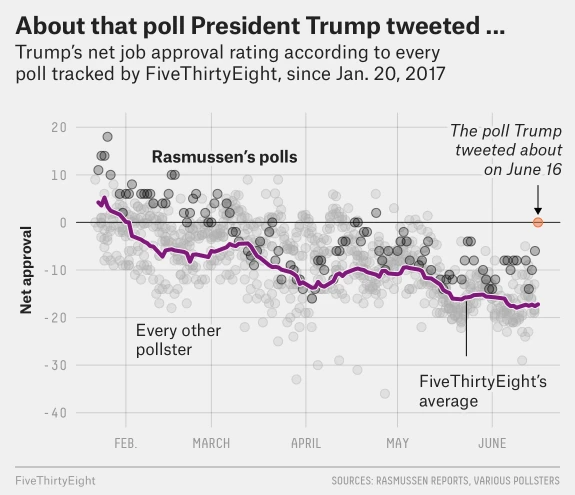
Media Analysis
(data-driven)
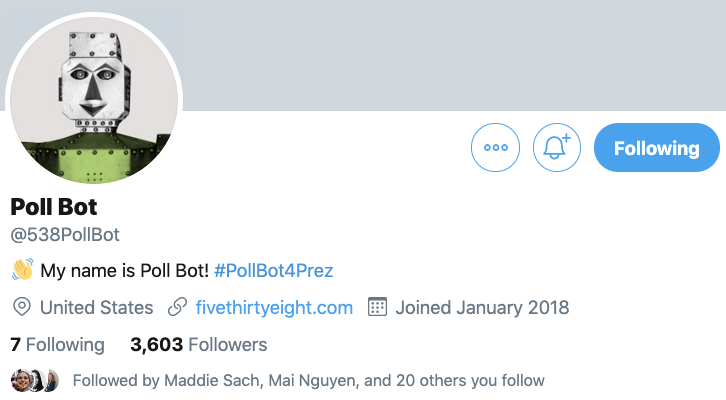
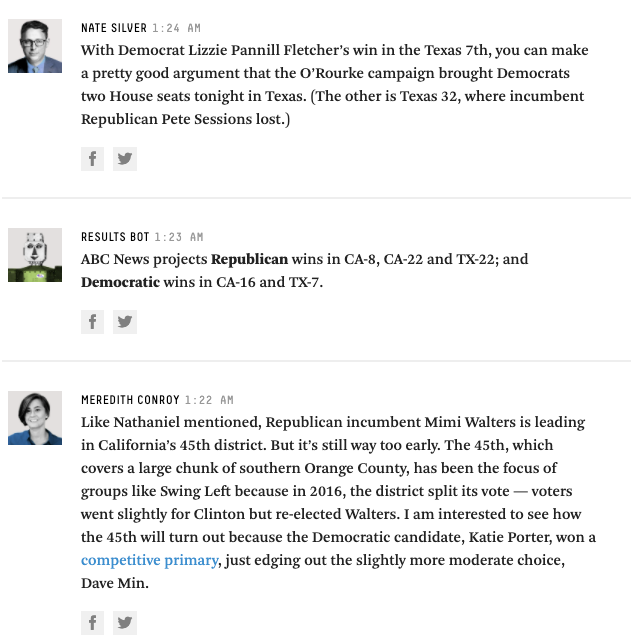
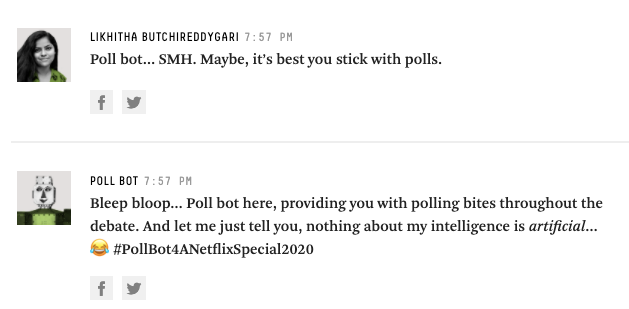
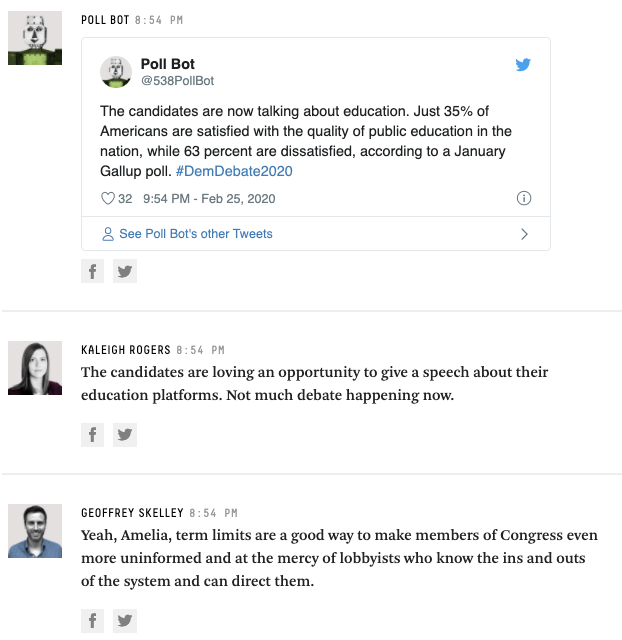
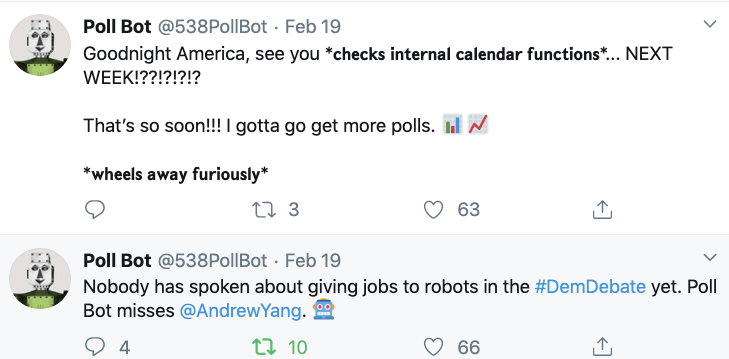
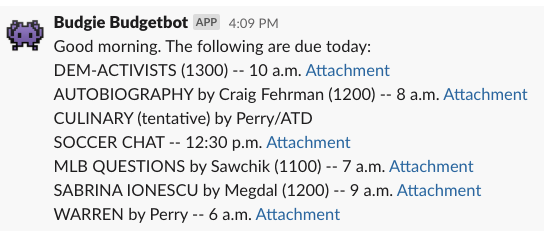
I edit POLL-BOT
... which is actually just 538's politics intern
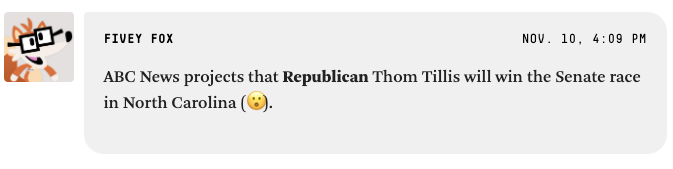
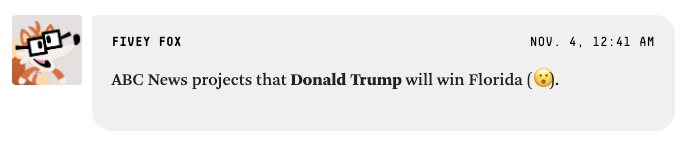
(Fivey Fox as of 2020...RIP poll bot)
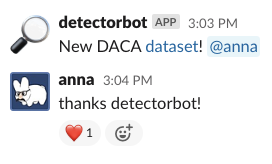
Bots let humans do what they're good at
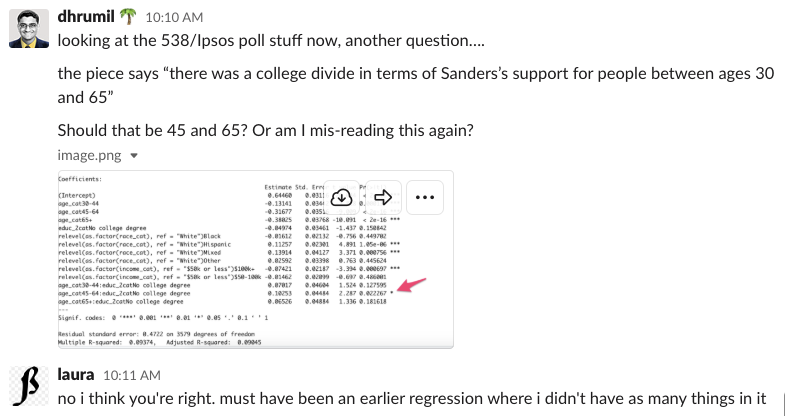
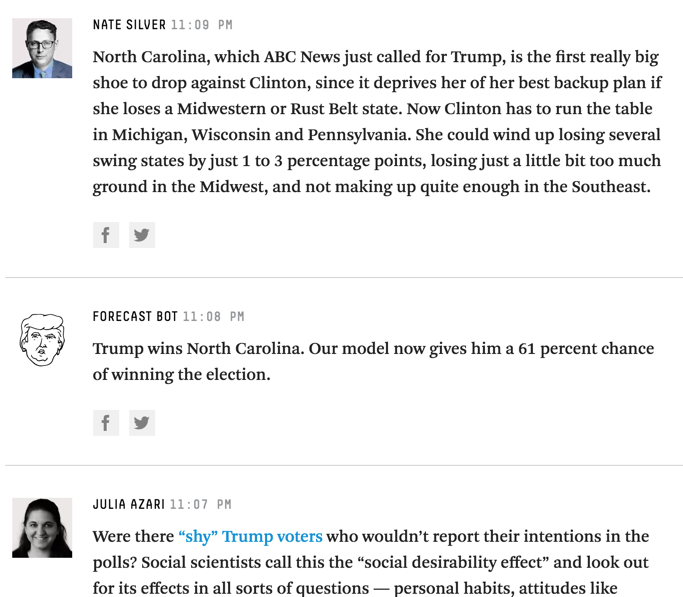
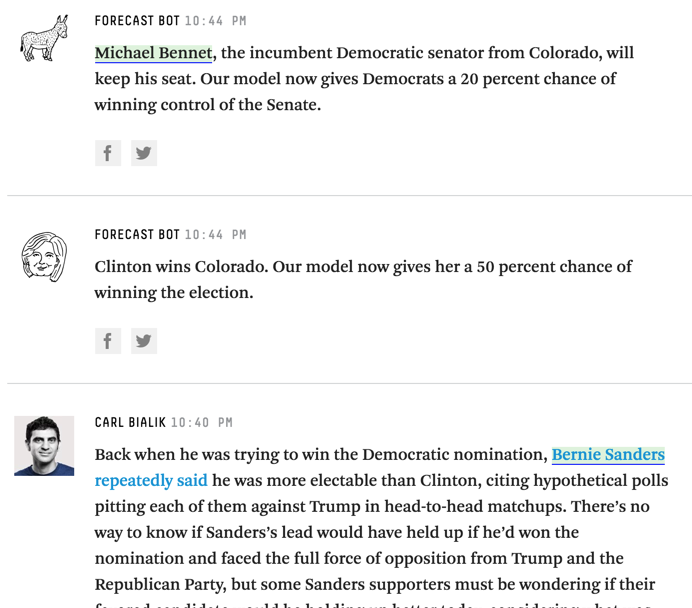
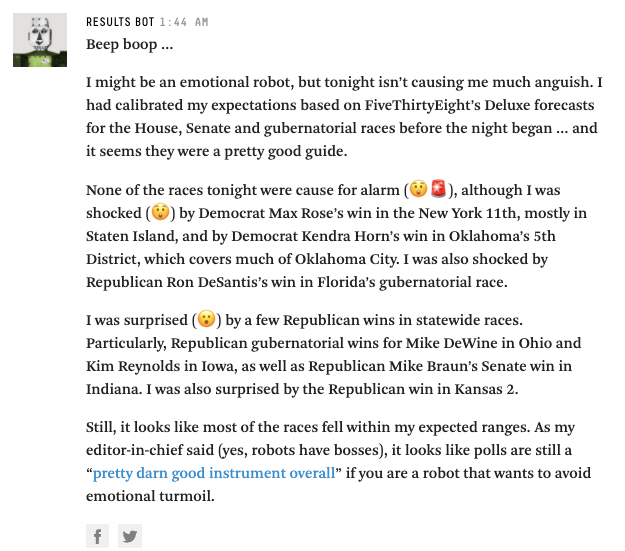
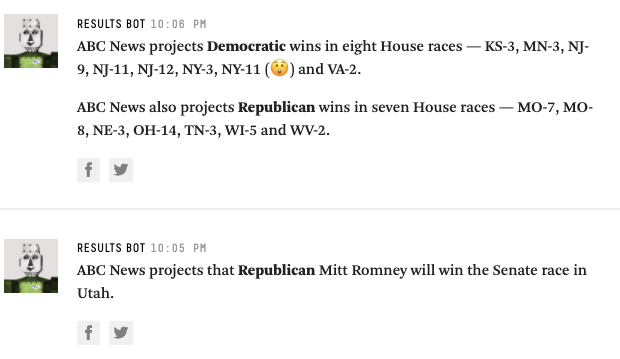
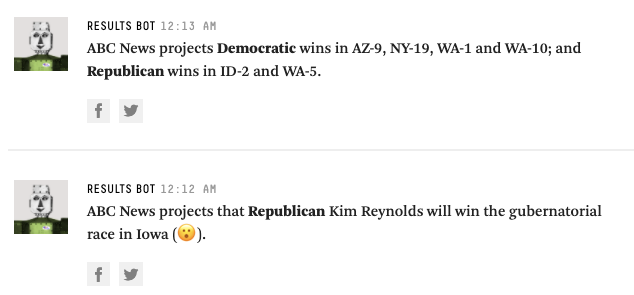
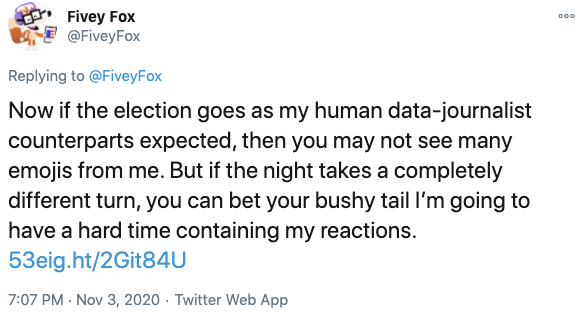
Bot reports the facts, leaving time for humans to interpret them.
But the bot also helps interpret facts!
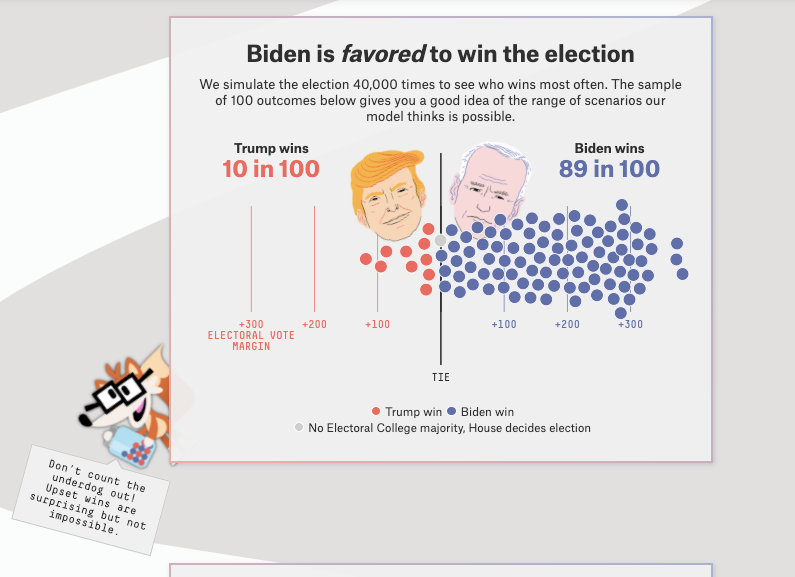
Lets readers see results that FiveThirtyEight deems unexpected
Expectations are calibrated before results ever start coming in.
Same concept, new branding.
Bot evolves into a human...
...jk
C+J Conference @ Stanford (2016)
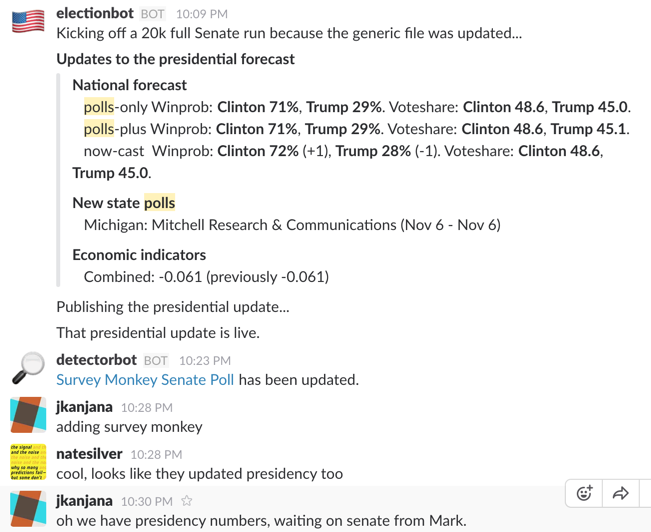
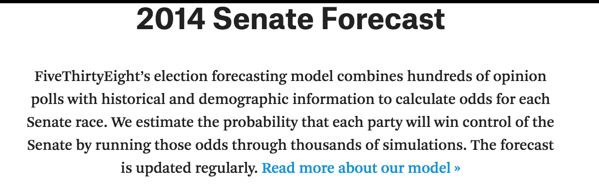
Forecast (How to..)
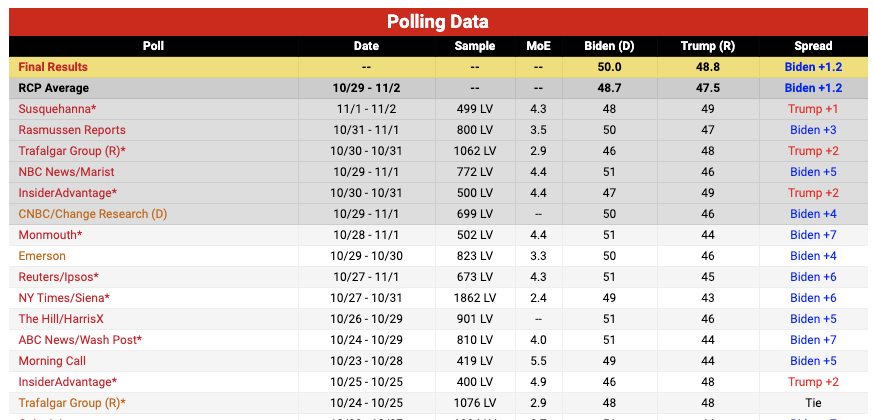
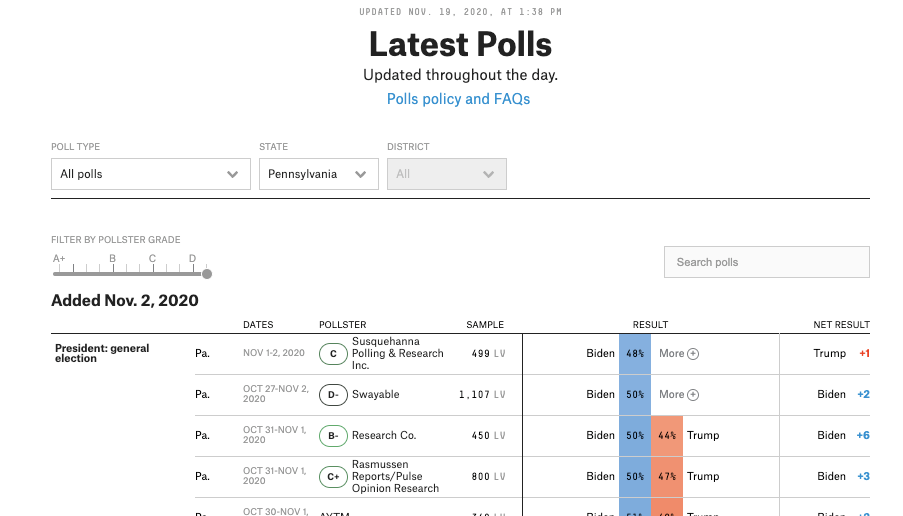
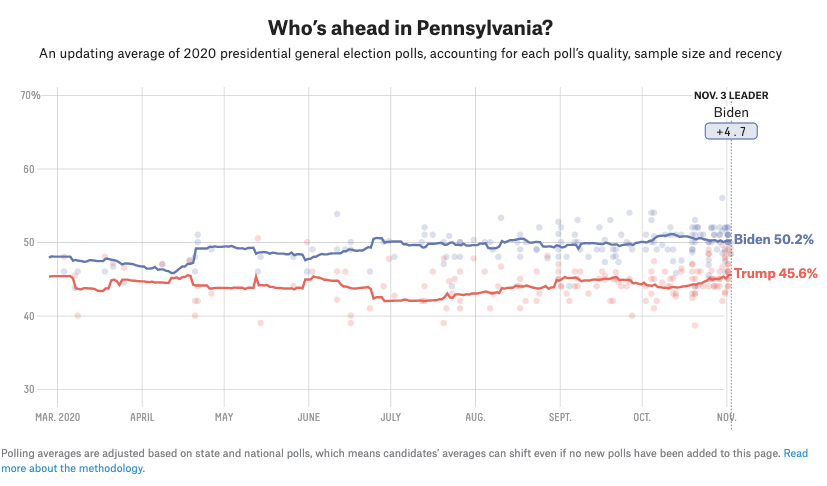
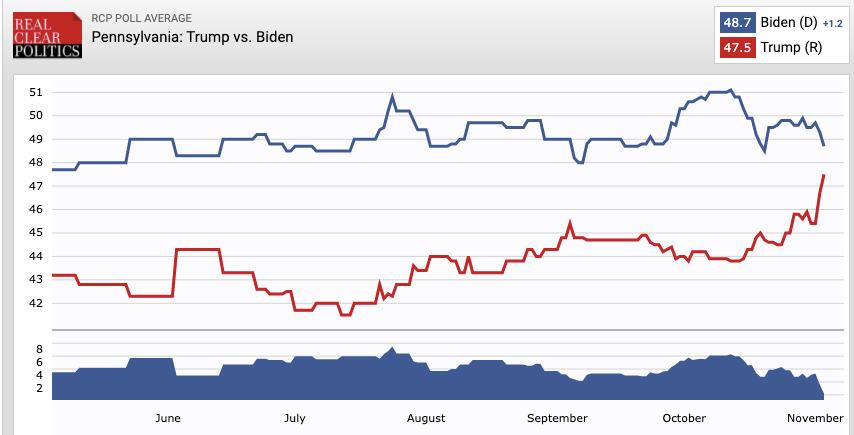
Polling Averages
"modeled estimate" (Historical Vote Patterns & Demographics)
Popular Vote
Electoral College
Individual States
Tipping-point states
etc...etc...
dhrumil.mehta@fivethirtyeight.com
@datadhrumil
@dmil
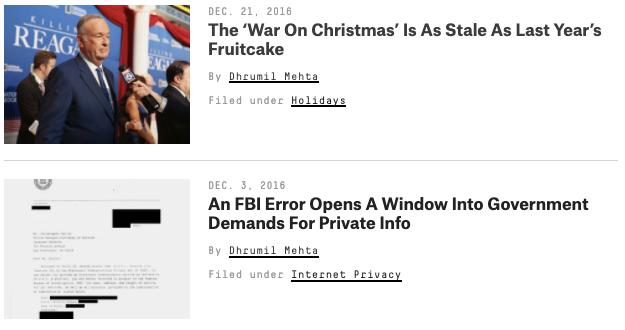
By Dhrumil Mehta
Telling stories with data.


