Methods for dealing with sparse and incomplete environmental datasets
An open source tool-set for obtaining and working with environmental data sets
Ann Gledson, Douglas Lowe, Manuele Reani, Caroline Jay, Dave Topping
The University of Manchester


-
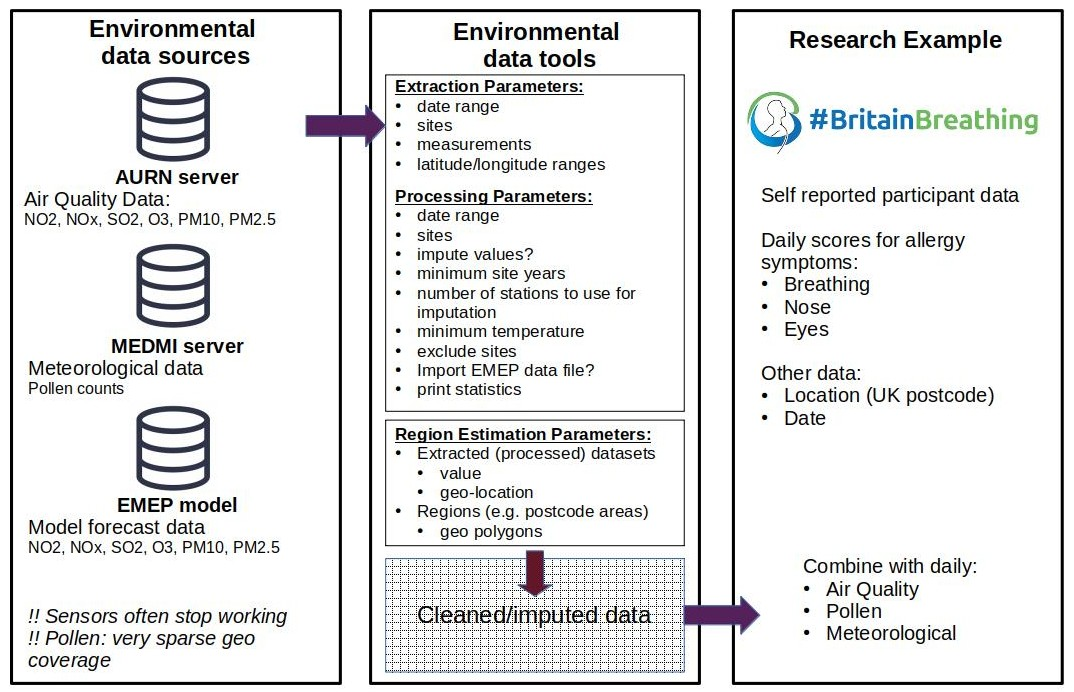
Automatic Urban and Rural Network (AURN)
- NOx, SO2, O3, NO2, PM10, PM2.5 (hourly data)
- Rdata formatted files, available via web API
-
Medical and Environmental Data (Mash-up) Infrastructure (MEDMI)
- Meteorological: air temperature, pressure, relative humidity (hourly)
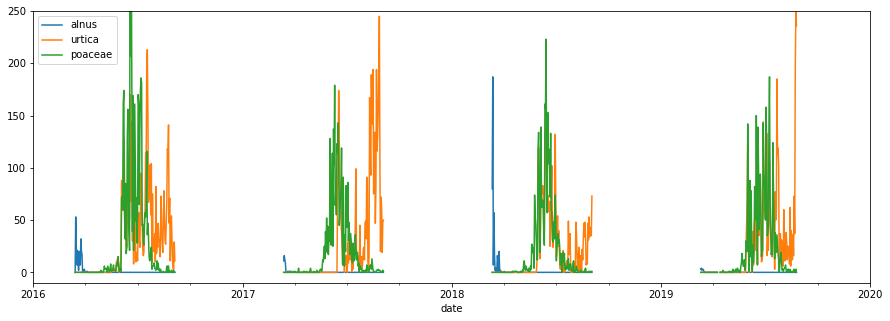
- Pollens (12 species): alnus, ambrosia, artemesia, ..., urtica (daily)
- Accessible to registered users via unix server (ssh access)
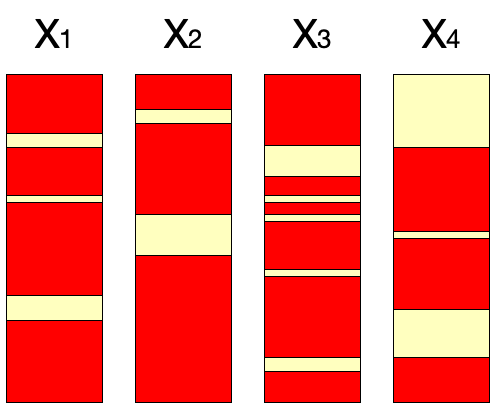
Environmental Data Sources
Pollen Data:
50%+ missing (measurements are seasonal)
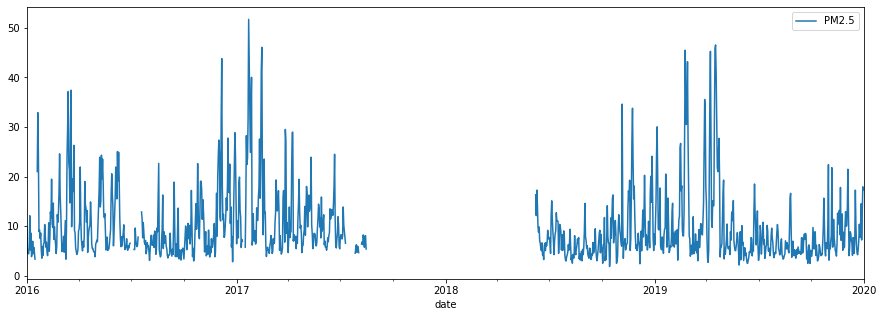
Air Quality Data:
5-12% missing (per pollutant)
Meteorology:
1.5-5.5% missing (per variable)
Missing Data Problem
-
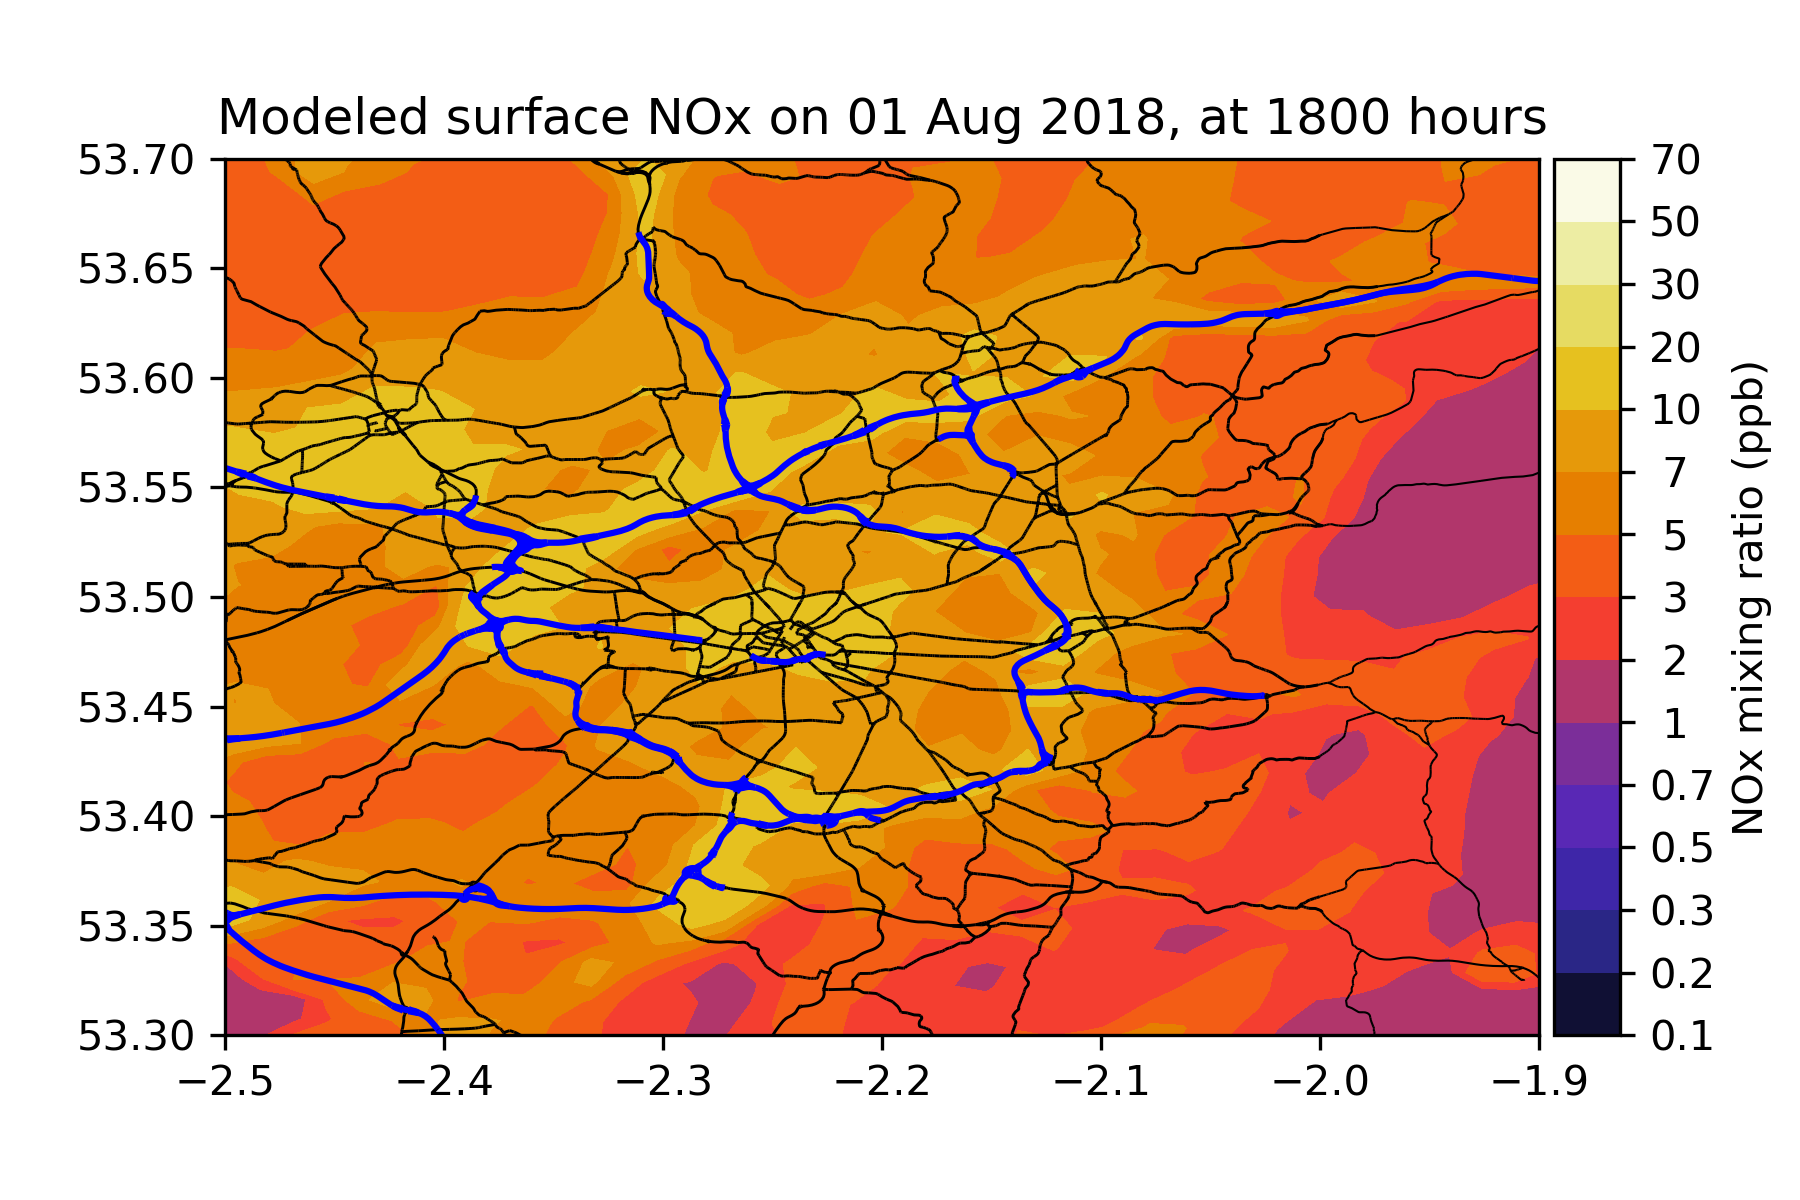
European Monitoring and Evaluation Programme (EMEP)
- NAEI emissions data
- gas: NOx, NO2, SO2, O3
- particulate: PM10, PM2.5
-
Issues:
- Coarse resolution (3km grid)
- Assumed activity cycles - not responsive to environment changes (e.g. cold weather impacts on use of domestic wood-burning stoves)
(Extra) Modelled AQ Data
Use Machine Learning to iteratively fill gaps in timeseries data
Requirements:
- strong correlation between timeseries
- data available in reference datasets for periods of missing data
Use the python based scikit-learn iterative imputation library (not as complete as the R MICE library, but easier to integrate into our python workflow)
Solution: Multivariate Imputation
(default imputation method in scikit-learn)
- Ridge regression methods ensure stability of solution when working with highly-correlated variables
- Bayesian approach uses an (assumed) prior probability distribution to aid regression.
Assumptions:
- data probability distribution is normal
Bayesian Ridge Regression
Meteorological Data
- remove duplicate measurements
- remove sites with only single daily readings
- data reality checking:
- site 117 (Cairngorm mountains) removed - RH too unreliable (>110%)
- remove all data points (11) where T < -20degC
Pollution Data
- Remove all zero & negative datapoints (<2% of total data)
- sample EMEP (3km) gridded data at every AURN measurement site
Data Preparation: Cleaning
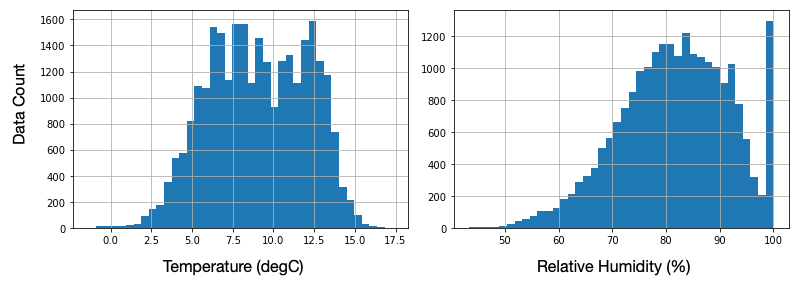
Raw Probability Distributions are not necessarly normal
e.g. temperature / RH for Kirkwall (Orkney Islands)
Solution: QuantileTransformer(output_distribution='normal')
Data Preparation: Preprocessing
Extreme bi-modal distribution impervious to transformation
Solution: Don't impute RH data - impute Temperature and Dew-point Temperature, then derive RH from these
(metpy.calc.relative_humidity_from_dewpoint)
Data Preparation: Preprocessing
- Retain only sites with >2 years of data
- Use sites with >3.5 years of data as reference sites
- Impute site of interest along with (closest) 5 reference sites
- Meteorological variables imputed separately (6 timeseries per imputation process)
- Pollution variables for a given site imputed together, along with EMEP data for the site (7-42 timeseries per imputation process)
Assumptions:
- Spatially closest sites are likely to have the strongest correlations
- For imputation, "it is expedient to select a suitable subset of data that contains no more than 15 to 25 variables" (van Buuren, S., & Groothuis-Oudshoorn, K.; JSS; 2011; doi:10.18637/jss.v045.i03)
Processing Method
- Use only reference sites
- Data removal for a given fraction of total period
- Data removal can be:
- random (non-contiguous)
- contiguous, either start/middle/end of period
Tools are provided with the processing toolkit for users to carry out these tests for themselves
Testing Imputation Methods
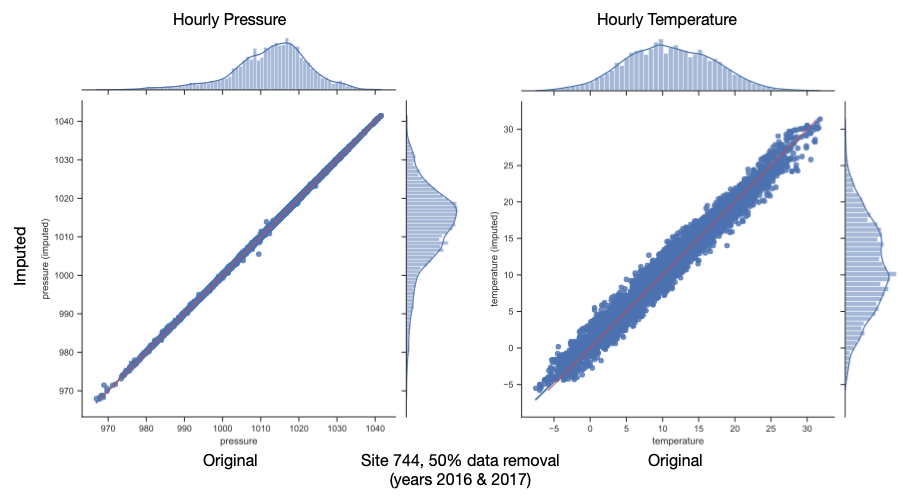
Test Results (Pressure & Temp)
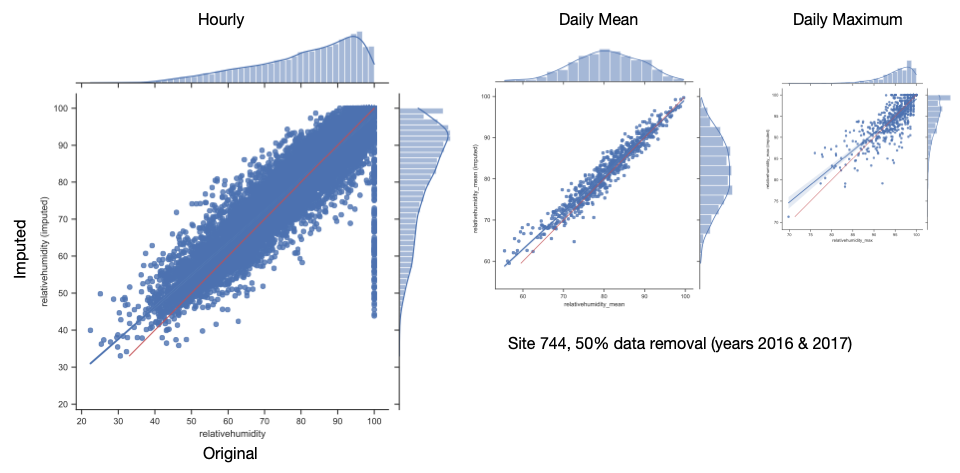
Test Results (Relative Humidity)
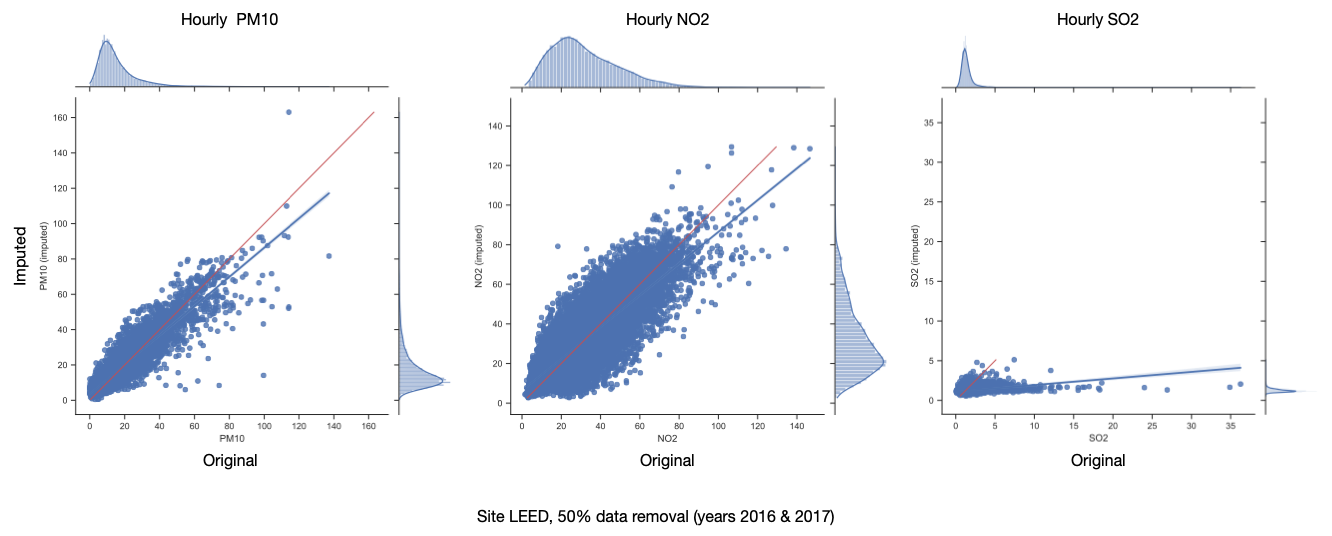
Test Results (Air Quality)
Test Results (RH Stats)
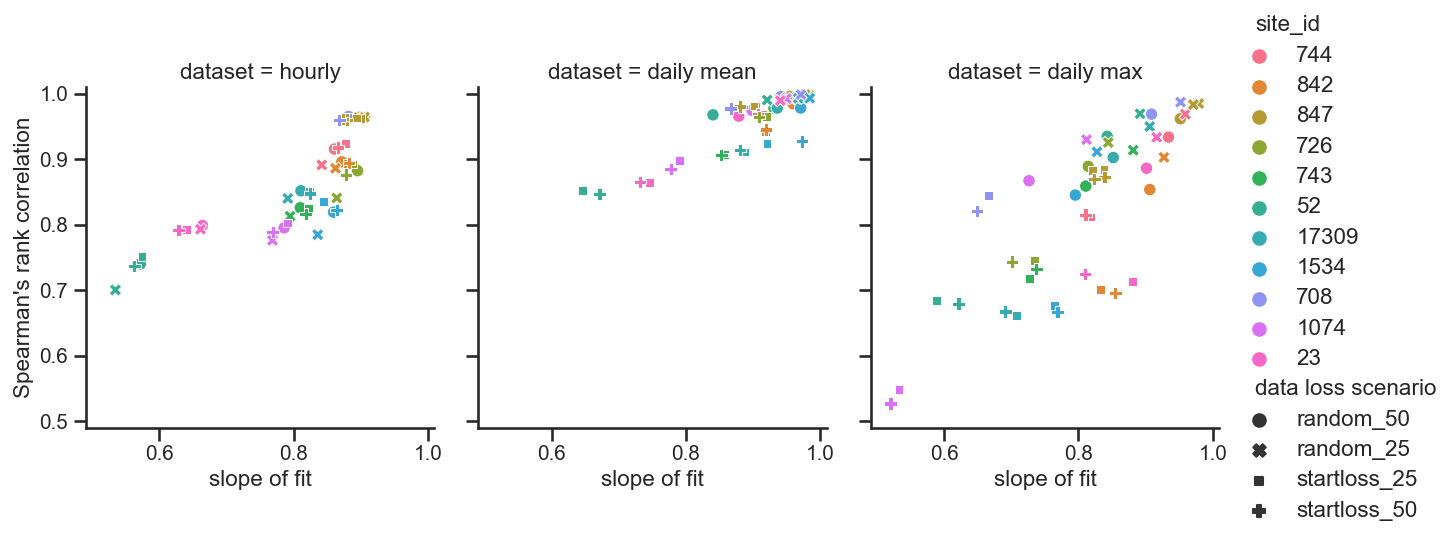
- for hourly data, scenarios cluster by site
- for daily mean/max data, scenarios clump by site and the contigiousness of data removal
Test Results (AQ Stats)
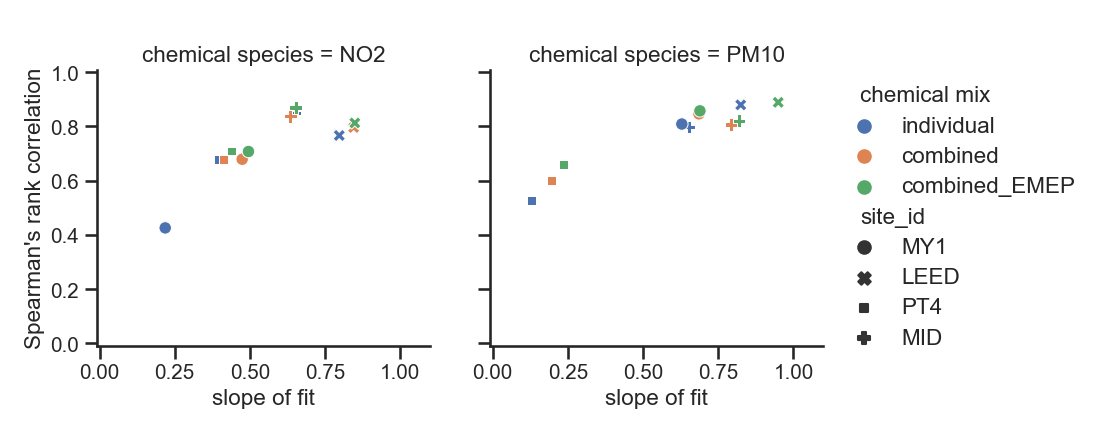
50% data removal (2016 & 2017)
- imputing pollutants together (and adding EMEP data) generally improves performance
Data Imputation Conclusions
- Unfortunately can't use imputation to fill gaps in pollen data
- Imputation of pressure and temperature data is very reliable / gives a good fit
- Imputation of relative humidity and (most) air quality data sets gives reasonable results
- SO2 imputation is not reasonable enough to provide in final dataset
- Imputing all air quality datasets for a given site together, and including EMEP data, gives better results than imputing these individually
Methods for dealing with sparse and incomplete environmental datasets
By douglowe
Methods for dealing with sparse and incomplete environmental datasets
Whilst the importance of quantifying the impacts of detrimental air quality remains a global priority for both researchers and policy makers, transparent methodologies that support the collection and manipulation of such data are currently lacking. In support of the Britain Breathing citizen science project, aiming to investigate the possible interactions between meteorological or air quality events and seasonal allergy symptoms, we have built a comprehensive data-set, and a web application: ‘Mine the Gaps’, which present daily air quality, pollen and weather readings from the Automatic Urban and Rural Network (AURN) and Met Office monitoring stations in the years 2016 to 2019 inclusive, for the United Kingdom. Measurement time series are rarely fully complete so we have used machine learning techniques to fill in gaps in these records to ensure as good coverage as possible. To address sparse regional coverage, we propose a simple baseline method called concentric regions. ‘Mine the Gaps’ can be used for graphically exploring and comparing the imputed dataset and the regional estimations. The application code is designed to be reusable and flexible so it can be used to interrogate other geographical datasets. In this talk we will cover the development of these datasets - discussing some of the choices that we made, as well as how reliable the imputation and estimation processes are for the different meteorological and air quality measurements. We will also demonstrate the ‘Mine the Gaps’ application. The datasets that we discuss in this talk are available to download at https://zenodo.org/record/4416028 and https://zenodo.org/record/4475652https://zenodo.org/record/4475652 The data processing toolkit is written in python (and uses scikit-learn for the machine learning processes) and is available at https://zenodo.org/record/4545257https://zenodo.org/record/4545257 The regional estimation code is written in python and available at https://zenodo.org/record/4518866https://zenodo.org/record/4518866 The ‘Mine the Gaps’ application is written in Python, using the Django web framework and can be accessed at http://minethegaps.manchester.ac.ukhttp://minethegaps.manchester.ac.uk The code repository will be linked to from the website when it is released.


